| Param | Original file | Final file |
|---|---|---|
| Filename | modeM0/AS1G02_018T06_9000000370_02468cztM0_level2.evt | modeM0/AS1G02_018T06_9000000370_02468cztM0_level2_quad_clean.evt |
| Size (bytes) | 519,736,320 | 95,788,800 |
| Size | 495.7 MB | 91.4 MB |
| Events in quadrant A | 3,293,722 | 597,824 |
| Events in quadrant B | 3,534,702 | 612,901 |
| Events in quadrant C | 5,049,267 | 587,218 |
| Events in quadrant D | 3,358,001 | 585,802 |
| Mode M9 | |||
|---|---|---|---|
| Quadrant | BADHDUFLAG | Total packets | Discarded packets |
| A | 0 | 10 | 0 |
| B | 0 | 10 | 0 |
| C | 0 | 10 | 0 |
| D | 0 | 10 | 0 |
| Mode SS | |||
|---|---|---|---|
| Quadrant | BADHDUFLAG | Total packets | Discarded packets |
| A | 0 | 154 | 0 |
| B | 0 | 154 | 0 |
| C | 0 | 154 | 0 |
| D | 0 | 154 | 0 |
| Mode M0 | |||
|---|---|---|---|
| Quadrant | BADHDUFLAG | Total packets | Discarded packets |
| A | 0 | 15169 | 3 |
| B | 0 | 15637 | 2 |
| C | 0 | 20416 | 2 |
| D | 0 | 15709 | 2 |
| Quadrant | Total seconds | Saturated seconds | Saturation percentage |
|---|---|---|---|
| A | 7423 | 31 | 0.417621% |
| B | 7423 | 79 | 1.064260% |
| C | 7423 | 512 | 6.897481% |
| D | 7423 | 33 | 0.444564% |
Noise dominated data is calculated using 1-second bins in cleaned event files. If a bin has >2000 counts, and if more than 50% of those come from <1% of pixels, then it is considered to be noise-dominated and hence unusable.
| Quadrant | # 1 sec bins | Bins with >0 counts | Bins with >2000 counts | High rate bins dominated by noise | Noise dominated (total time) | Noise dominated (detector-on time) | Marked lightcurve |
|---|---|---|---|---|---|---|---|
| A | 8493 | 7425 | 1 | 1 | 0.01% | 0.01% | 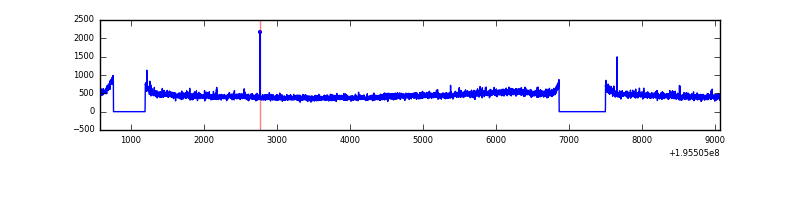 |
| B | 8493 | 7425 | 22 | 22 | 0.26% | 0.30% | 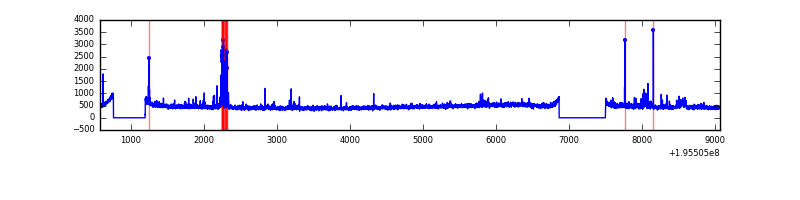 |
| C | 8493 | 7425 | 332 | 332 | 3.91% | 4.47% | 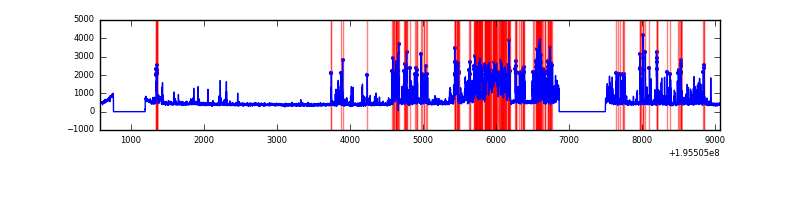 |
| D | 8493 | 7425 | 20 | 20 | 0.24% | 0.27% | 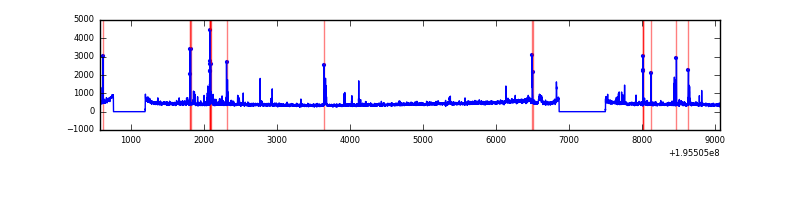 |
Top three noisy pixels from each quadrant. If the there are fewer than three noisy pixels in the level2.evt file, extra rows are filled as -1
| Pixel properties | Quadrant properties | ||||||
|---|---|---|---|---|---|---|---|
| Quadrant | DetID | PixID | Counts | Sigma | Mean | Median | Sigma |
| A | 8 | 15 | 29047 | 163.59 | 844 | 825 | 172.5 |
| A | 12 | 194 | 9518 | 50.39 | 844 | 825 | 172.5 |
| A | 0 | 226 | 9012 | 47.46 | 844 | 825 | 172.5 |
| B | 10 | 244 | 117023 | 698.31 | 862 | 841 | 166.4 |
| B | 4 | 48 | 54360 | 321.67 | 862 | 841 | 166.4 |
| B | 5 | 172 | 21962 | 126.94 | 862 | 841 | 166.4 |
| C | 14 | 223 | 1809755 | 9560.42 | 801 | 802 | 189.2 |
| C | 10 | 82 | 50044 | 260.25 | 801 | 802 | 189.2 |
| C | 10 | 65 | 31175 | 160.52 | 801 | 802 | 189.2 |
| D | 13 | 53 | 51905 | 262.68 | 811 | 791 | 194.6 |
| D | 12 | 79 | 47450 | 239.78 | 811 | 791 | 194.6 |
| D | 2 | 14 | 44775 | 226.04 | 811 | 791 | 194.6 |
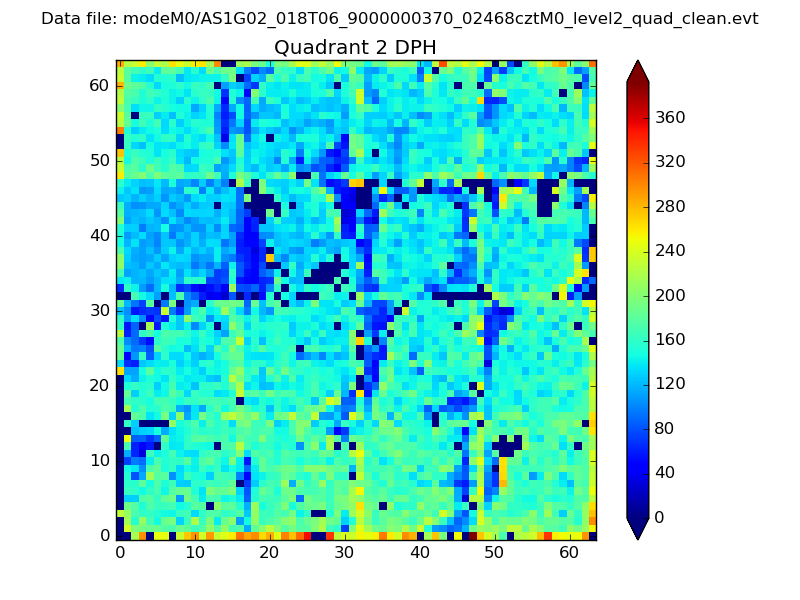
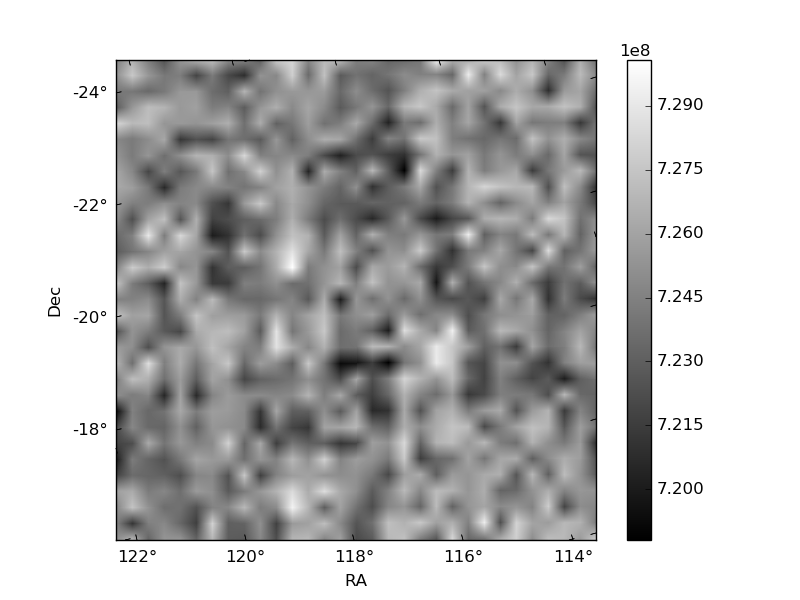
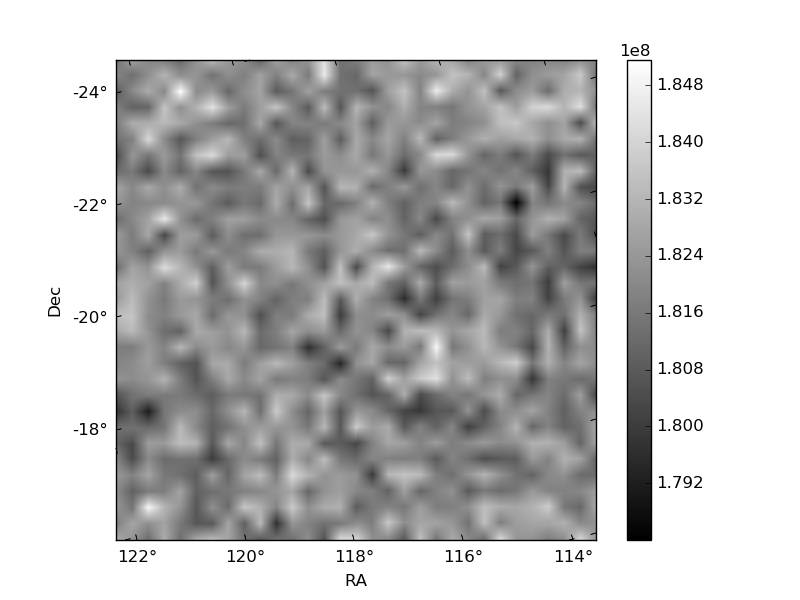
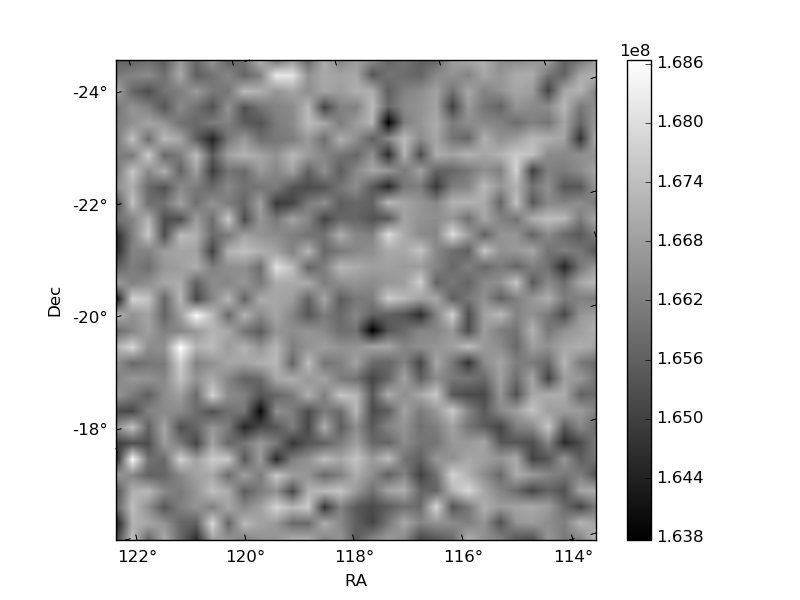
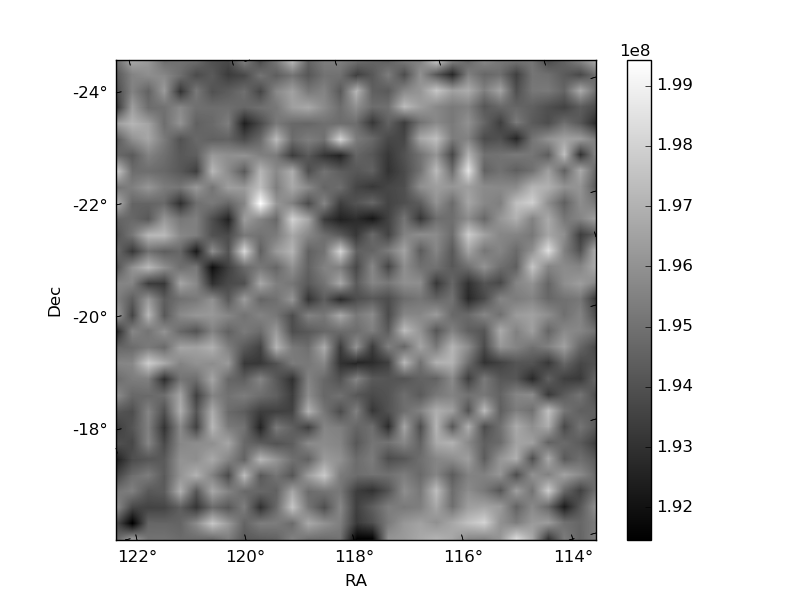
Histogram calculated using DETX and DETY for each event in the final _common_clean file
| Quadrant A | 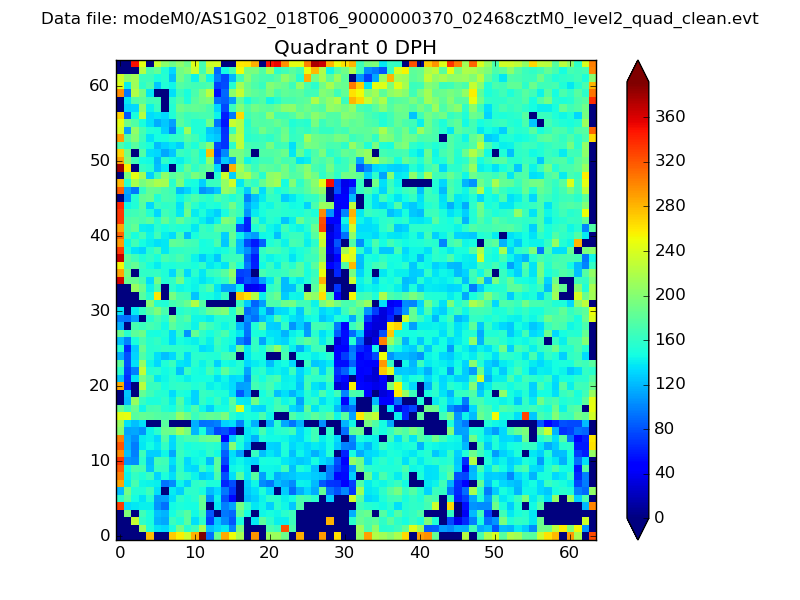 |
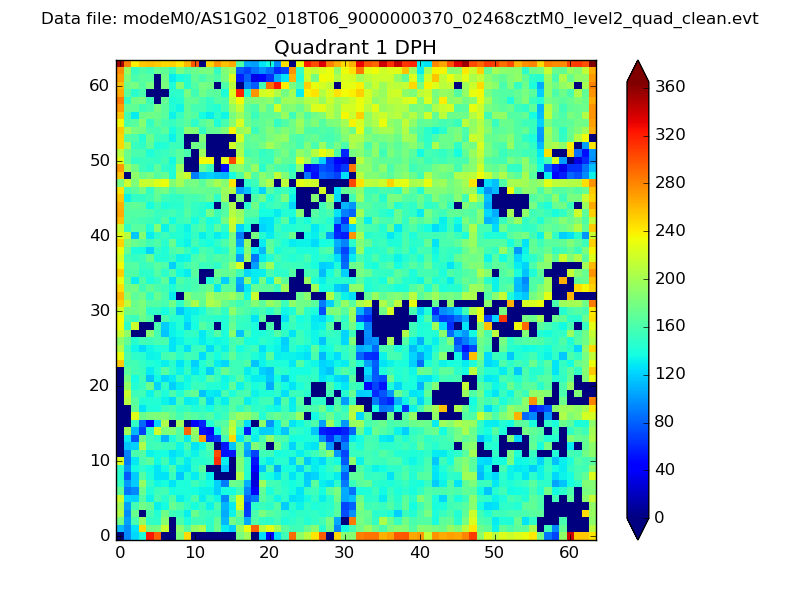 |
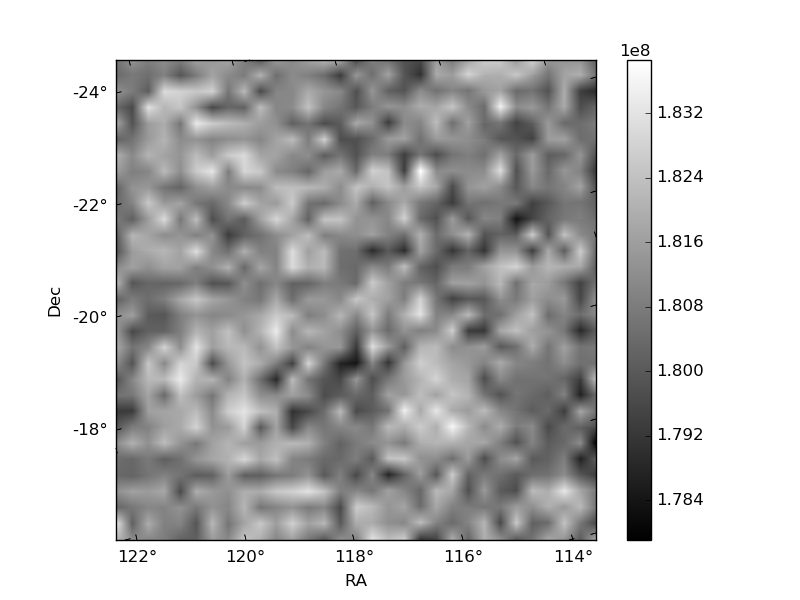
Quadrant B |
|---|---|---|---|
| Quadrant D | 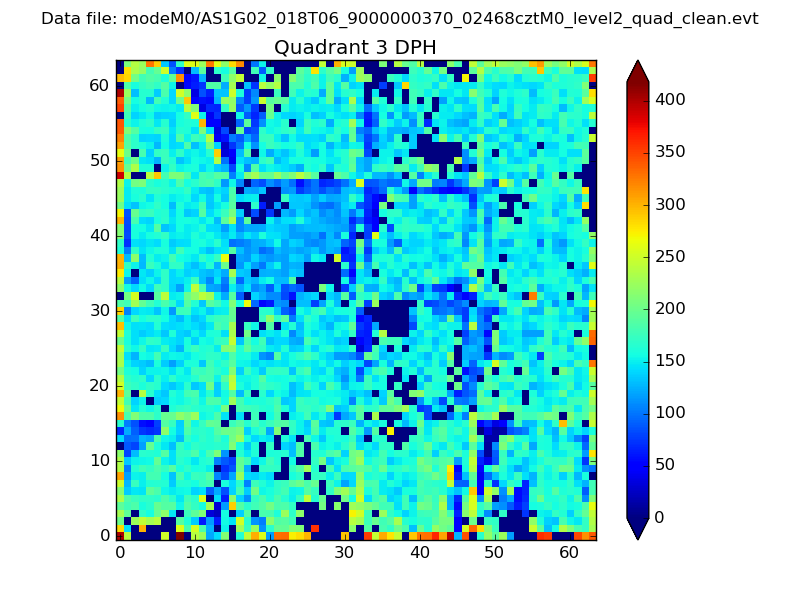 |
 |
Quadrant C |
| Plot type | Count rate plots | Images |
|---|---|---|
| Comparison with Poisson distribution Blue bars denote a histogram of data divided into 1 sec bins. Red curve is a Poisson curve with rate = median count rate of data. |
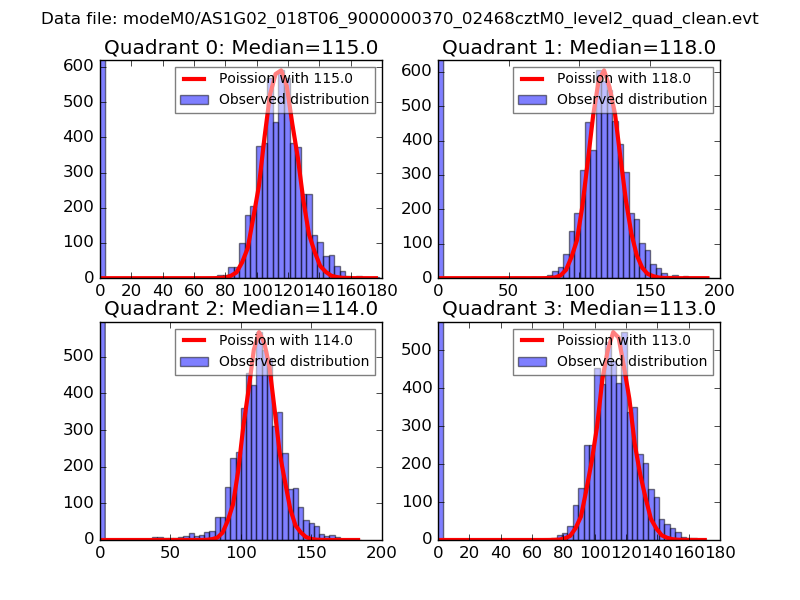 |
 |
| Quadrant-wise count rates Data is divided into 100 sec bins |
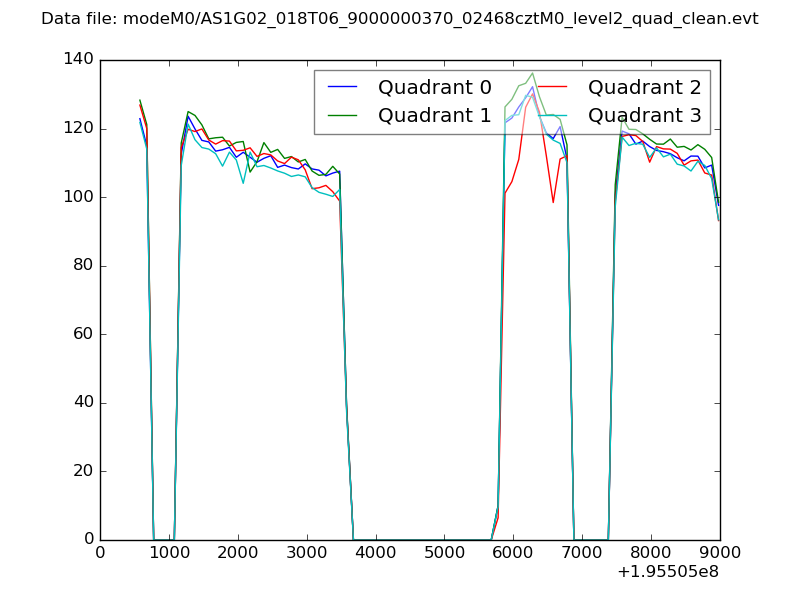 |
|
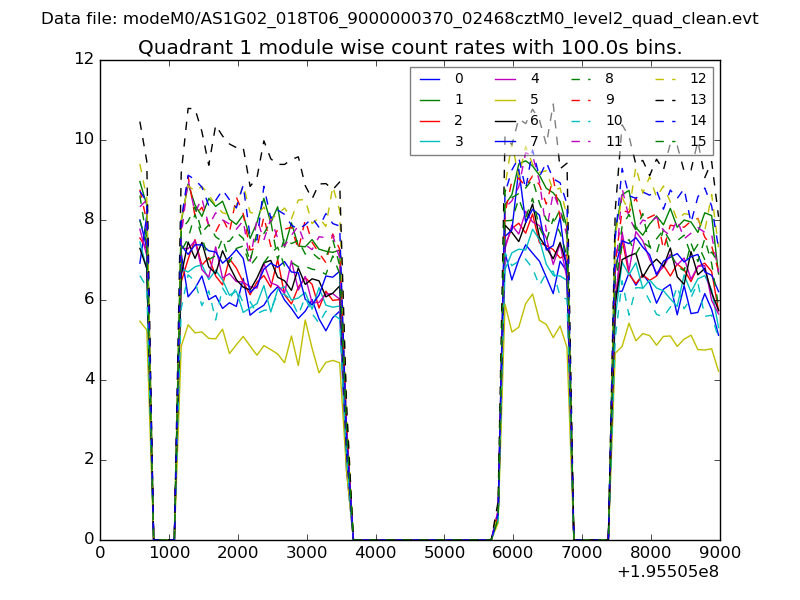
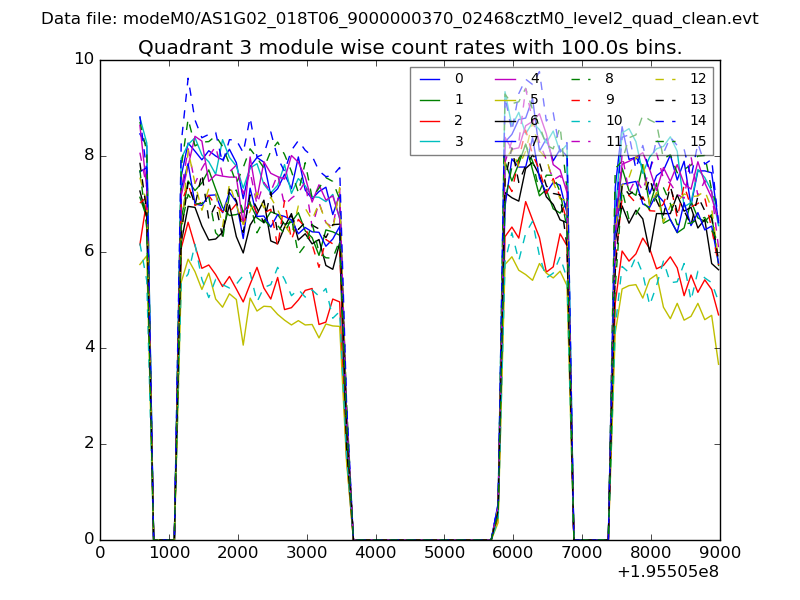
| Module-wise count rates for Quadrant A Data is divided into 100 sec bins |
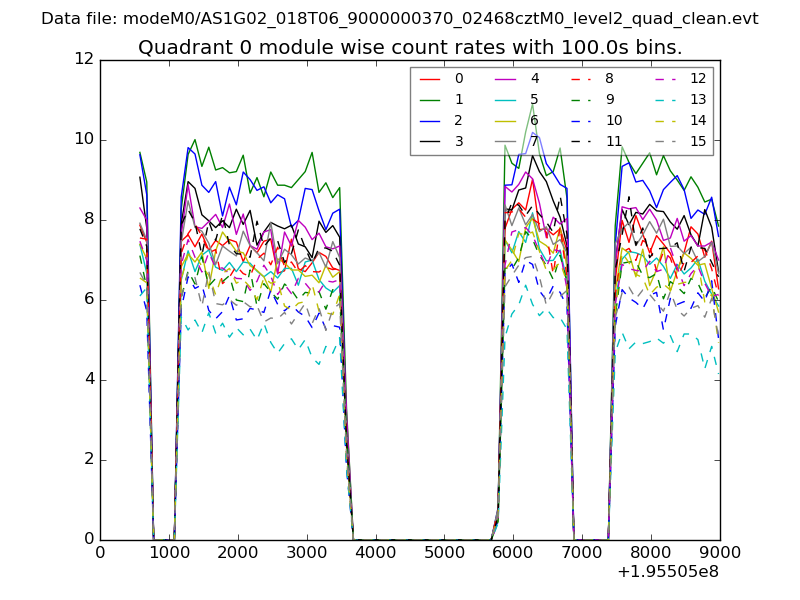 |
 |
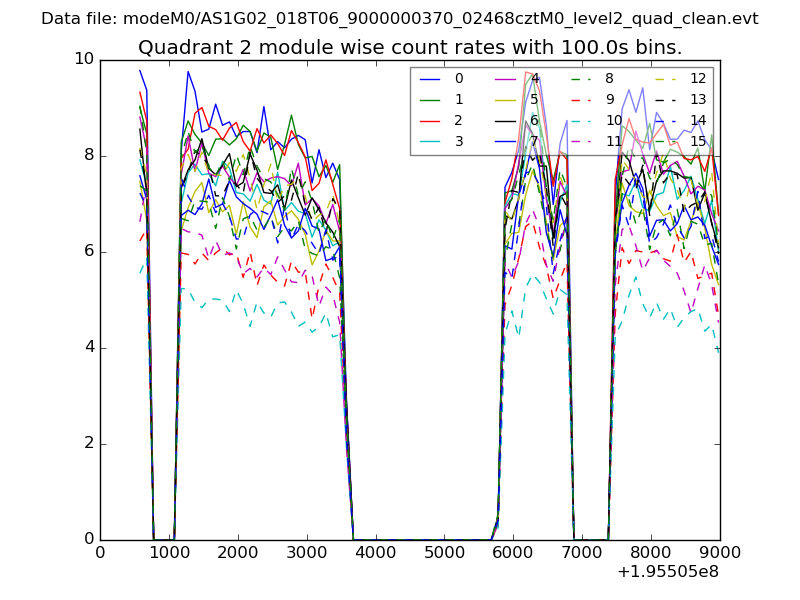
| Module-wise count rates for Quadrant B Data is divided into 100 sec bins |
 |
 |
| Module-wise count rates for Quadrant C Data is divided into 100 sec bins |
 |
 |
| Module-wise count rates for Quadrant D Data is divided into 100 sec bins |
 |
 |
| Parameter | Plot |
|---|---|
| CZT HV Monitor | 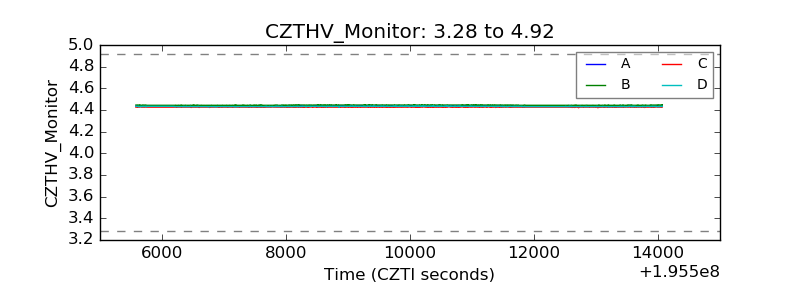 |
| D_VDD | 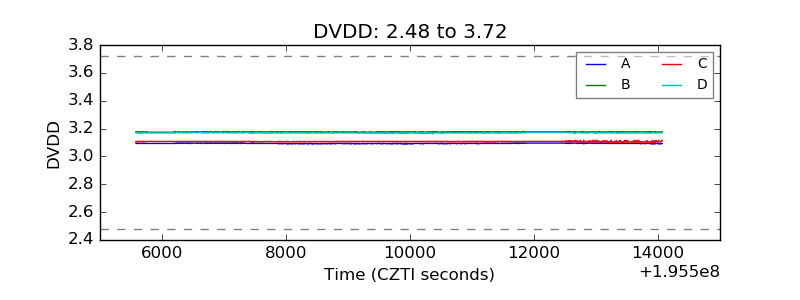 |
| Temperature 1 | 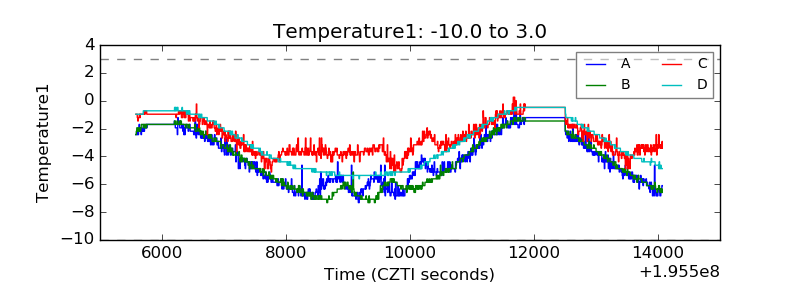 |
| Veto HV Monitor | 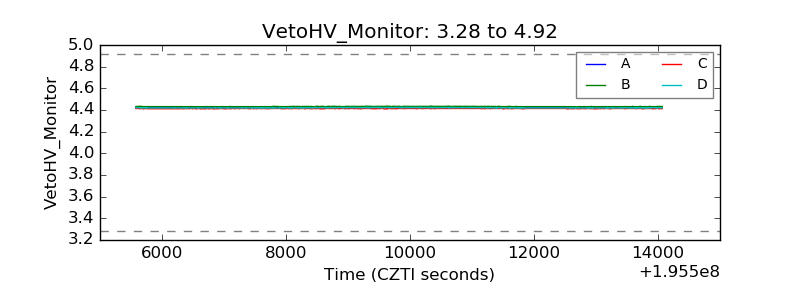 |
| Veto LLD | 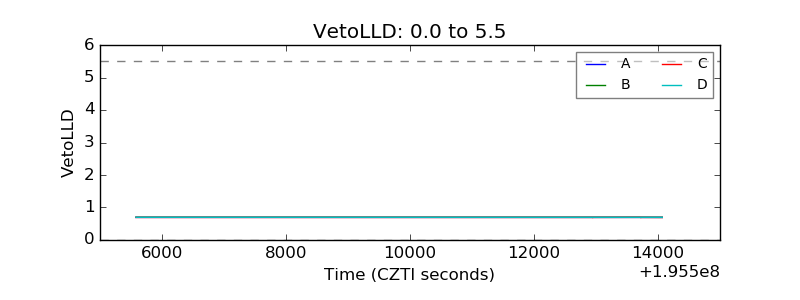 |
| Alpha Counter | 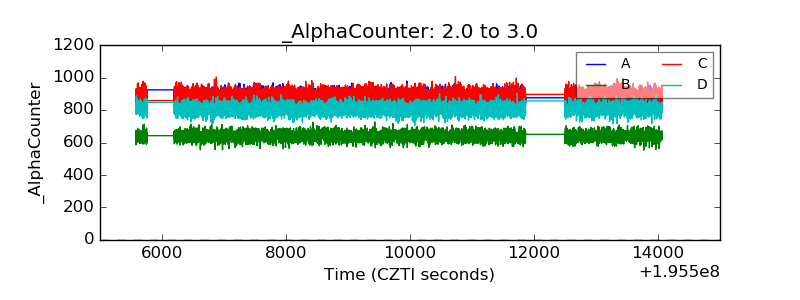 |
| _CPM_Rate | 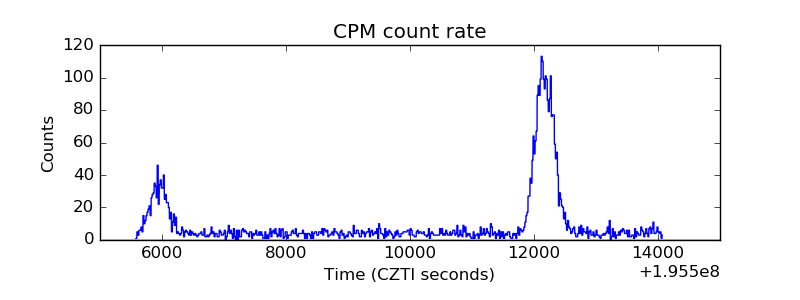 |
| CZT Counter | 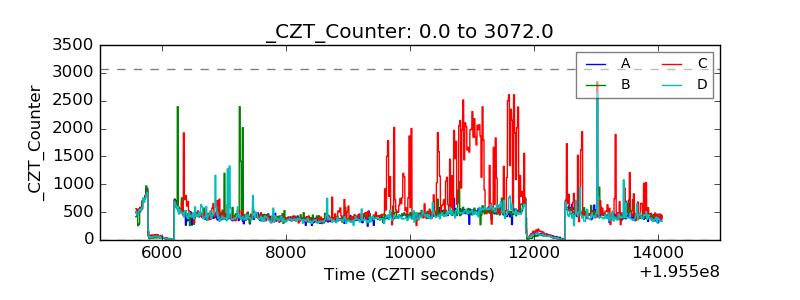 |
| +2.5 Volts monitor | 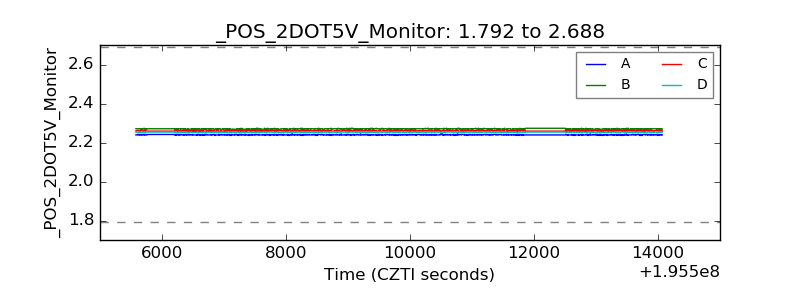 |
| +5 Volts monitor | 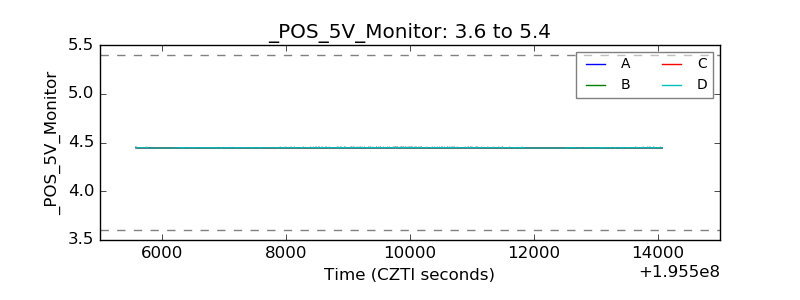 |
| _ROLL_ROT | 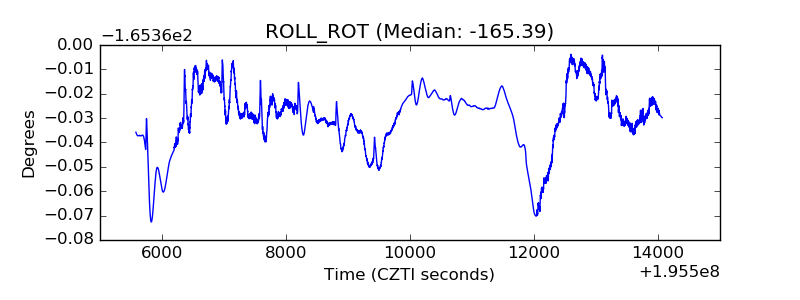 |
| _Roll_DEC | 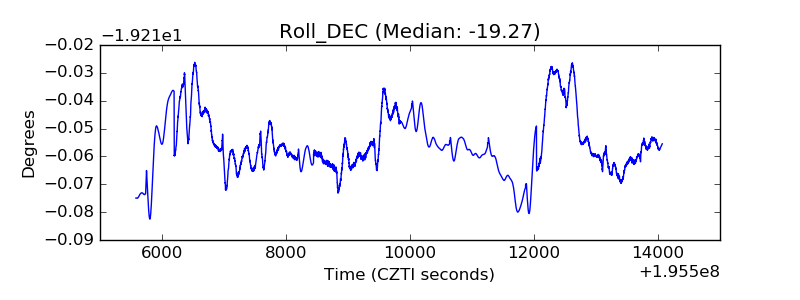 |
| _Roll_RA | 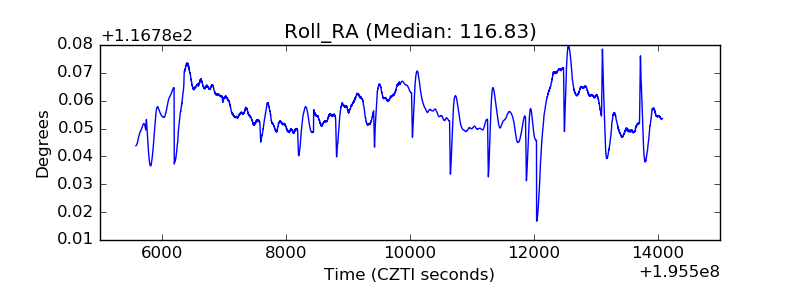 |
| Veto Counter | 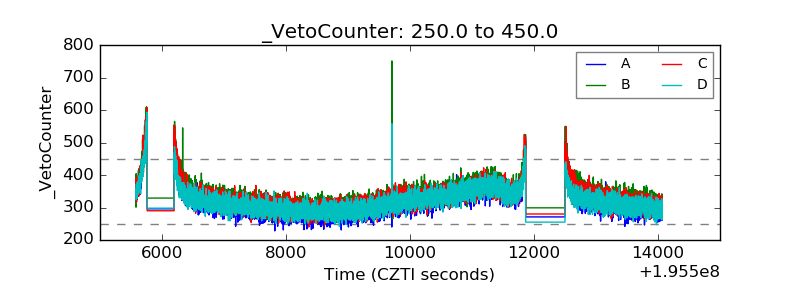 |