| Param | Original file | Final file |
|---|---|---|
| Filename | modeM0/AS1G02_018T06_9000000370_02469cztM0_level2.evt | modeM0/AS1G02_018T06_9000000370_02469cztM0_level2_quad_clean.evt |
| Size (bytes) | 447,736,320 | 87,958,080 |
| Size | 427.0 MB | 83.9 MB |
| Events in quadrant A | 3,291,922 | 542,383 |
| Events in quadrant B | 3,186,682 | 558,794 |
| Events in quadrant C | 3,622,770 | 545,378 |
| Events in quadrant D | 2,986,358 | 533,422 |
| Mode M9 | |||
|---|---|---|---|
| Quadrant | BADHDUFLAG | Total packets | Discarded packets |
| A | 0 | 11 | 0 |
| B | 0 | 11 | 0 |
| C | 0 | 11 | 0 |
| D | 0 | 12 | 0 |
| Mode SS | |||
|---|---|---|---|
| Quadrant | BADHDUFLAG | Total packets | Discarded packets |
| A | 0 | 142 | 0 |
| B | 0 | 142 | 0 |
| C | 0 | 142 | 0 |
| D | 0 | 142 | 0 |
| Mode M0 | |||
|---|---|---|---|
| Quadrant | BADHDUFLAG | Total packets | Discarded packets |
| A | 0 | 14653 | 3 |
| B | 0 | 14237 | 2 |
| C | 0 | 15622 | 2 |
| D | 0 | 14234 | 2 |
| Quadrant | Total seconds | Saturated seconds | Saturation percentage |
|---|---|---|---|
| A | 6938 | 31 | 0.446815% |
| B | 6938 | 29 | 0.417988% |
| C | 6938 | 89 | 1.282790% |
| D | 6938 | 18 | 0.259441% |
Noise dominated data is calculated using 1-second bins in cleaned event files. If a bin has >2000 counts, and if more than 50% of those come from <1% of pixels, then it is considered to be noise-dominated and hence unusable.
| Quadrant | # 1 sec bins | Bins with >0 counts | Bins with >2000 counts | High rate bins dominated by noise | Noise dominated (total time) | Noise dominated (detector-on time) | Marked lightcurve |
|---|---|---|---|---|---|---|---|
| A | 7728 | 6939 | 0 | 0 | 0.00% | 0.00% | 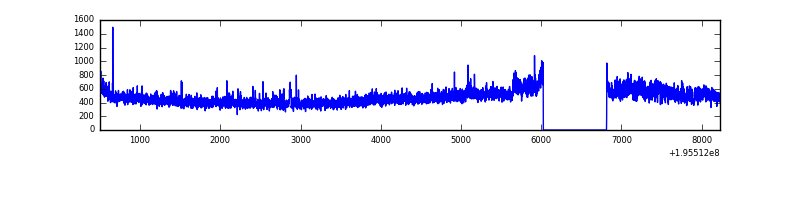 |
| B | 7728 | 6939 | 4 | 4 | 0.05% | 0.06% | 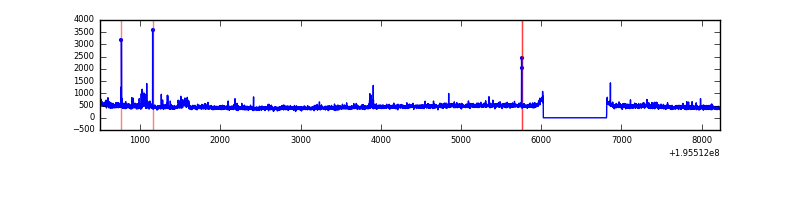 |
| C | 7728 | 6939 | 45 | 45 | 0.58% | 0.65% | 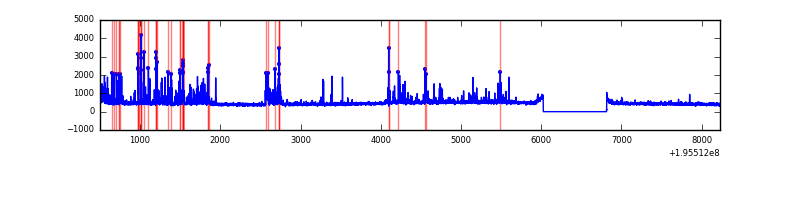 |
| D | 7728 | 6939 | 14 | 14 | 0.18% | 0.20% | 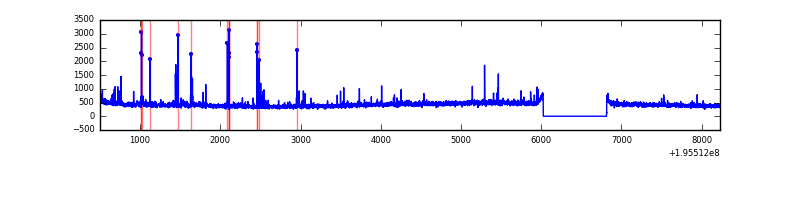 |
Top three noisy pixels from each quadrant. If the there are fewer than three noisy pixels in the level2.evt file, extra rows are filled as -1
| Pixel properties | Quadrant properties | ||||||
|---|---|---|---|---|---|---|---|
| Quadrant | DetID | PixID | Counts | Sigma | Mean | Median | Sigma |
| A | 8 | 15 | 291832 | 1828.21 | 778 | 760 | 159.2 |
| A | 12 | 194 | 8508 | 48.66 | 778 | 760 | 159.2 |
| A | 0 | 226 | 8220 | 46.86 | 778 | 760 | 159.2 |
| B | 4 | 48 | 60041 | 384.89 | 796 | 778 | 154.0 |
| B | 4 | 200 | 16638 | 103.01 | 796 | 778 | 154.0 |
| B | 5 | 6 | 14614 | 89.86 | 796 | 778 | 154.0 |
| C | 14 | 223 | 576511 | 3225.03 | 757 | 761 | 178.5 |
| C | 8 | 112 | 30153 | 164.64 | 757 | 761 | 178.5 |
| C | 10 | 65 | 28346 | 154.52 | 757 | 761 | 178.5 |
| D | 6 | 112 | 33072 | 180.51 | 749 | 730 | 179.2 |
| D | 13 | 53 | 25519 | 138.35 | 749 | 730 | 179.2 |
| D | 2 | 14 | 23819 | 128.87 | 749 | 730 | 179.2 |
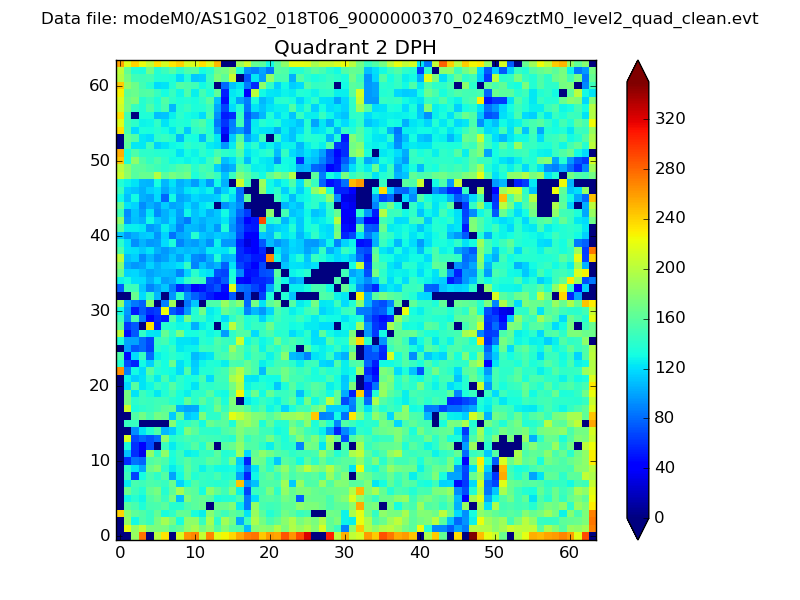
Histogram calculated using DETX and DETY for each event in the final _common_clean file
| Quadrant A | 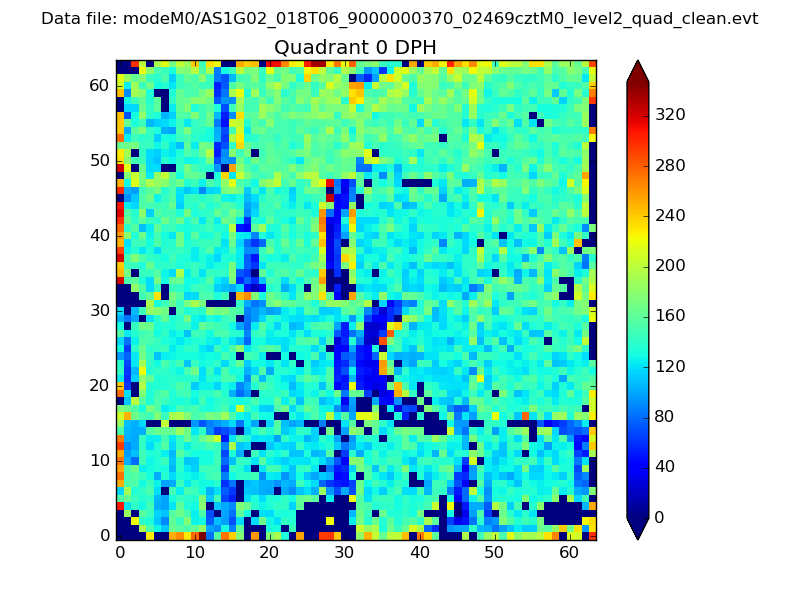 |
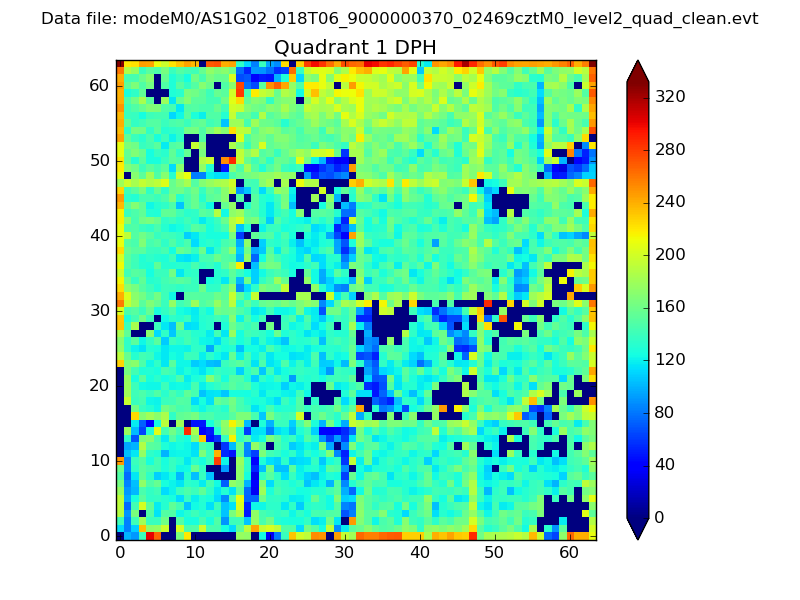 |
Quadrant B |
|---|---|---|---|
| Quadrant D | 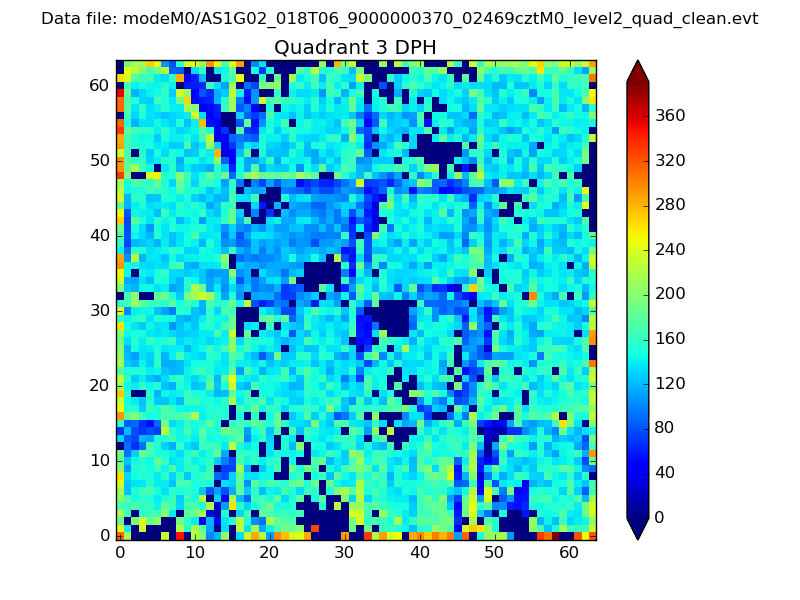 |
 |
Quadrant C |
| Plot type | Count rate plots | Images |
|---|---|---|
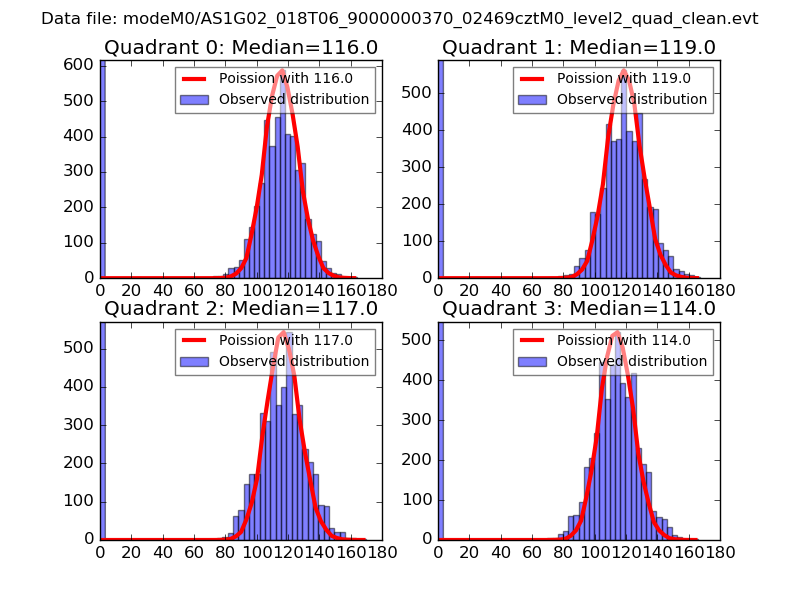
| Comparison with Poisson distribution Blue bars denote a histogram of data divided into 1 sec bins. Red curve is a Poisson curve with rate = median count rate of data. |
 |
 |
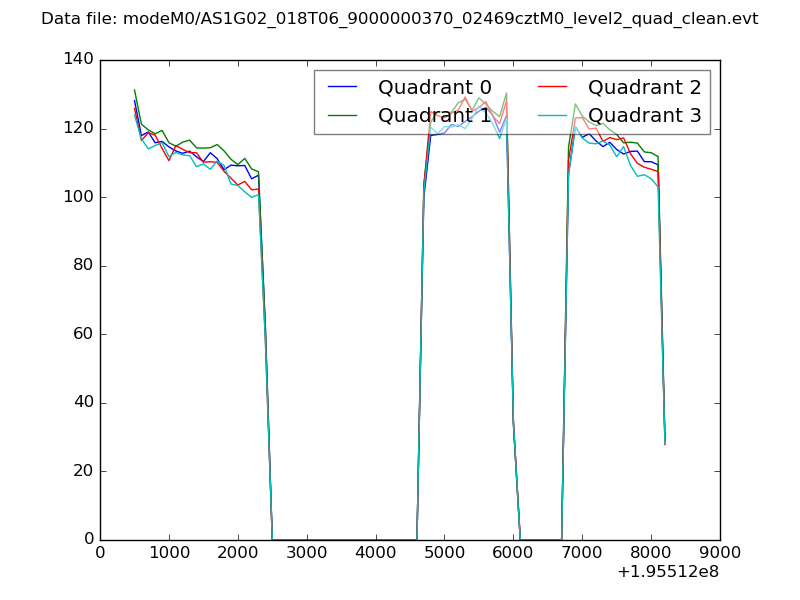
| Quadrant-wise count rates Data is divided into 100 sec bins |
 |
|
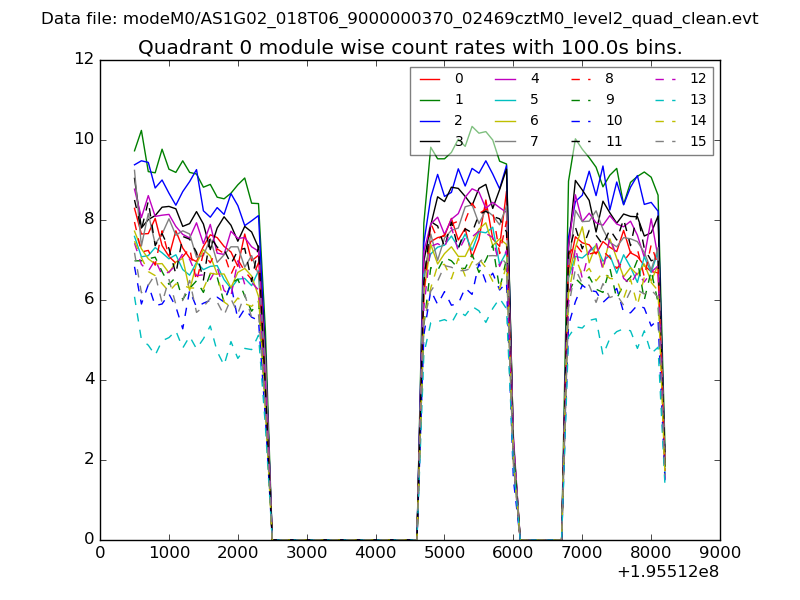
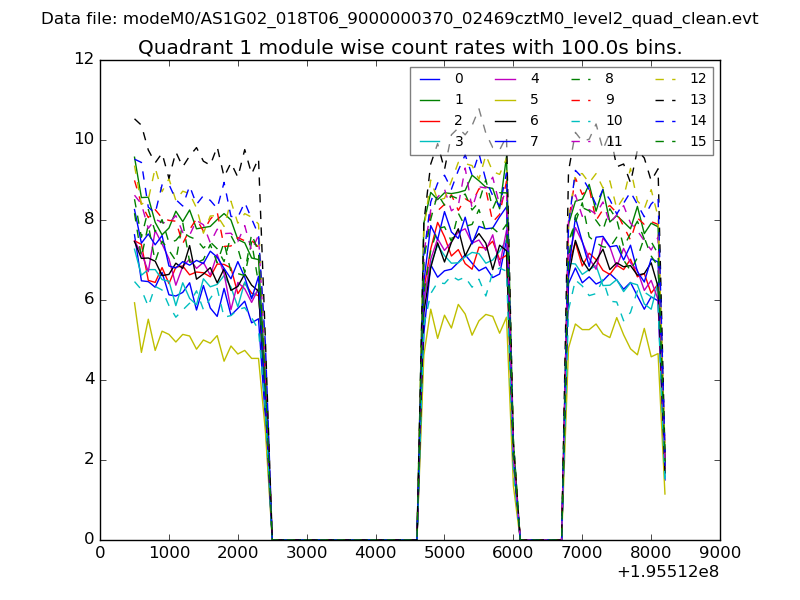
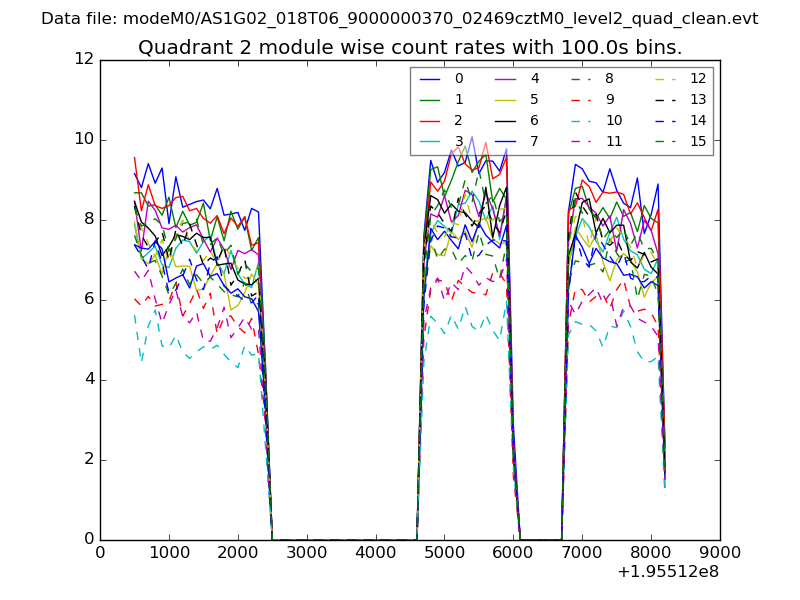
| Module-wise count rates for Quadrant A Data is divided into 100 sec bins |
 |
 |
| Module-wise count rates for Quadrant B Data is divided into 100 sec bins |
 |
 |
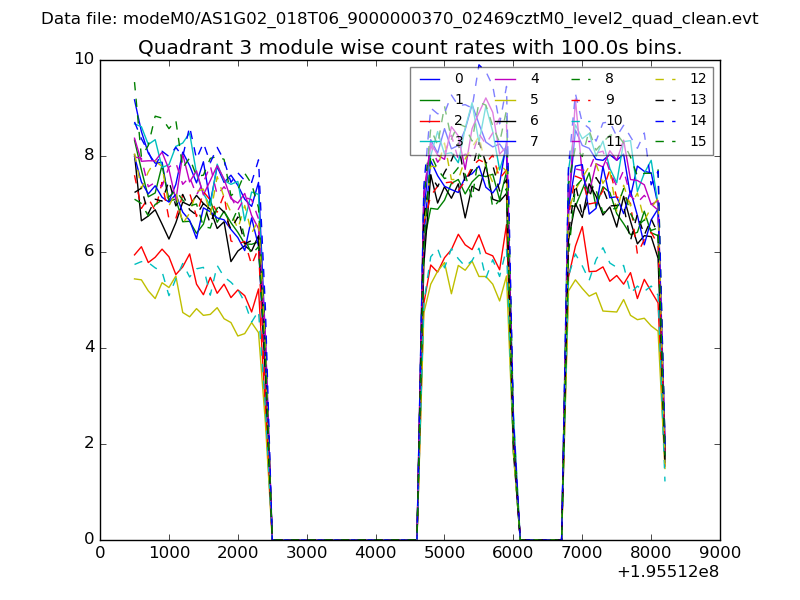
| Module-wise count rates for Quadrant C Data is divided into 100 sec bins |
 |
 |
| Module-wise count rates for Quadrant D Data is divided into 100 sec bins |
 |
 |
| Parameter | Plot |
|---|---|
| CZT HV Monitor | 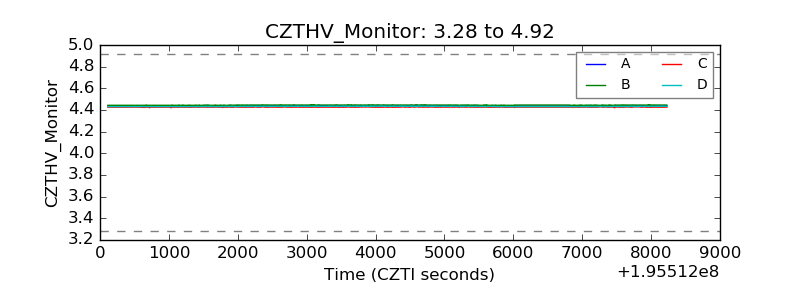 |
| D_VDD | 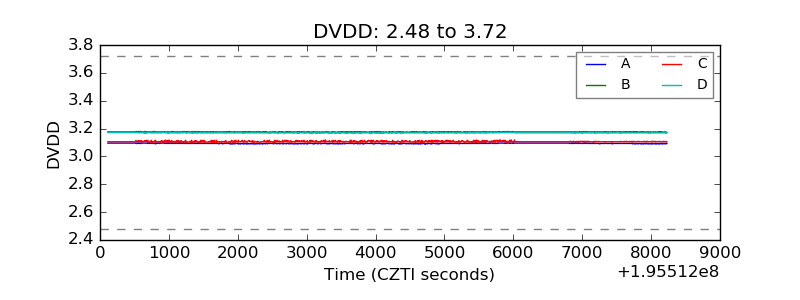 |
| Temperature 1 | 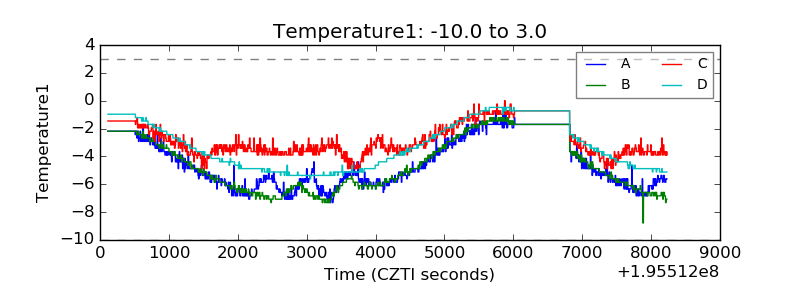 |
| Veto HV Monitor | 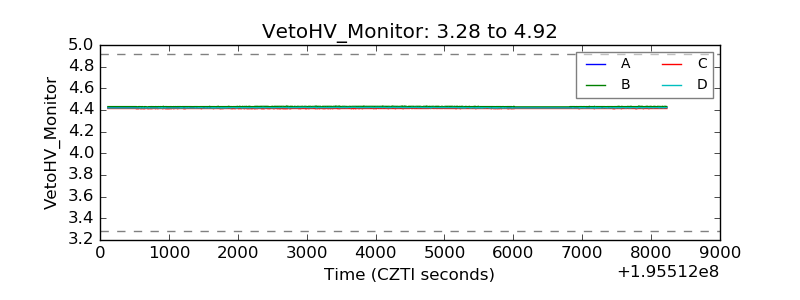 |
| Veto LLD | 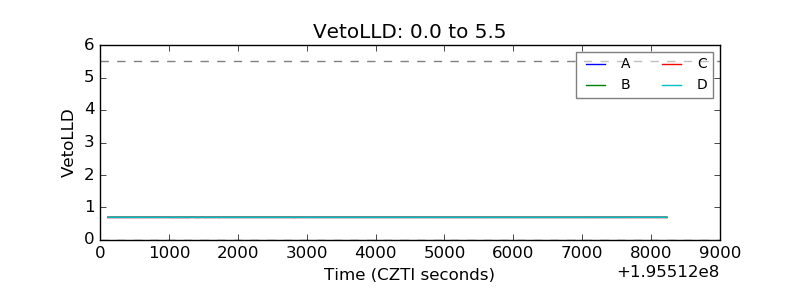 |
| Alpha Counter | 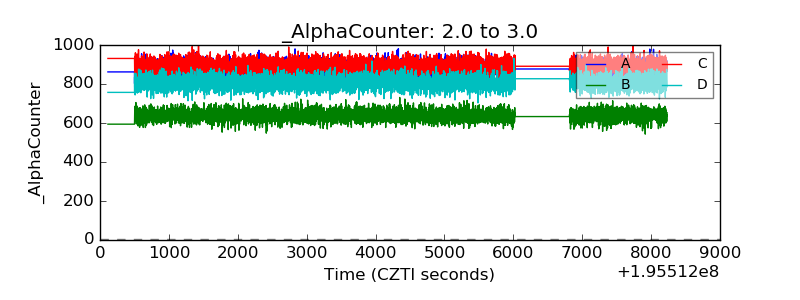 |
| _CPM_Rate | 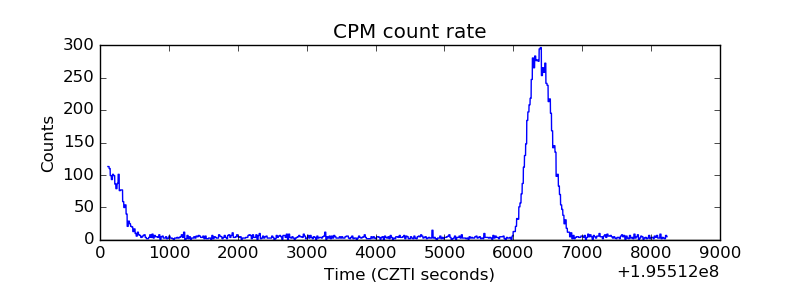 |
| CZT Counter | 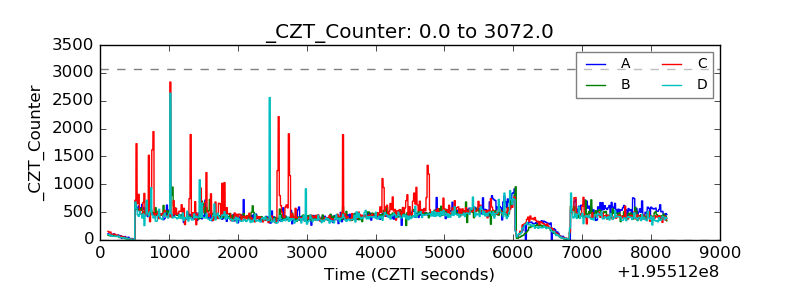 |
| +2.5 Volts monitor |  |
| +5 Volts monitor |  |
| _ROLL_ROT | 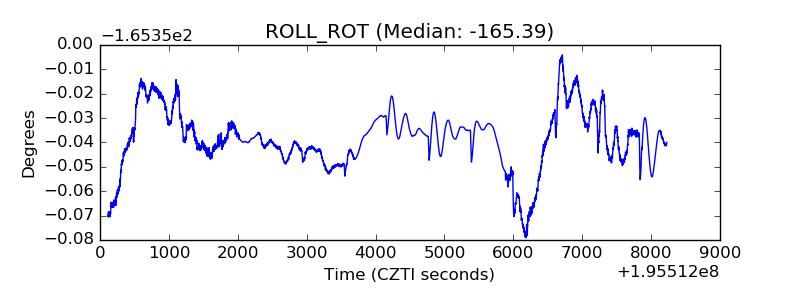 |
| _Roll_DEC | 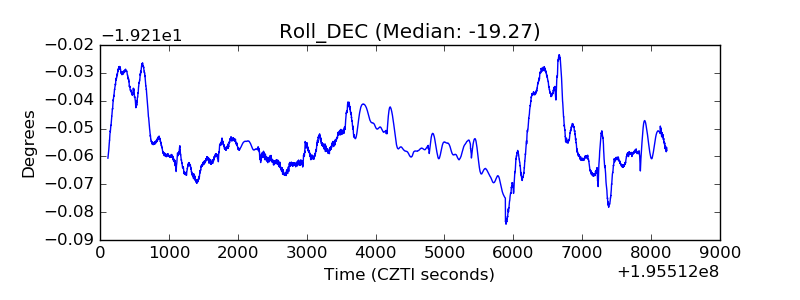 |
| _Roll_RA | 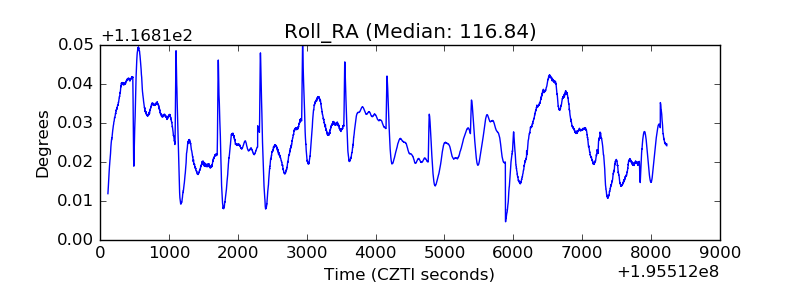 |
| Veto Counter | 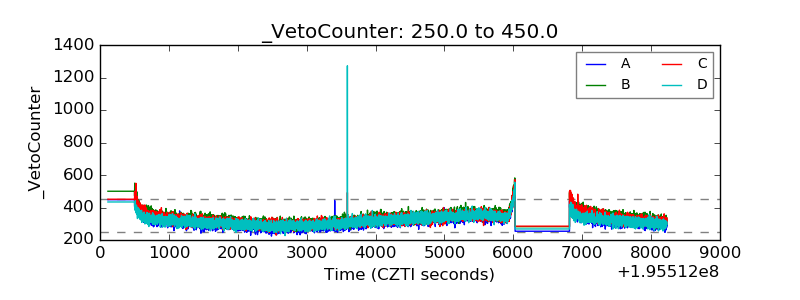 |