| Param | Original file | Final file |
|---|---|---|
| Filename | modeM0/AS1G02_018T06_9000000370_02470cztM0_level2.evt | modeM0/AS1G02_018T06_9000000370_02470cztM0_level2_quad_clean.evt |
| Size (bytes) | 451,247,040 | 86,074,560 |
| Size | 430.3 MB | 82.1 MB |
| Events in quadrant A | 3,460,461 | 524,082 |
| Events in quadrant B | 3,281,710 | 539,357 |
| Events in quadrant C | 3,332,617 | 529,487 |
| Events in quadrant D | 3,102,290 | 512,898 |
| Mode M9 | |||
|---|---|---|---|
| Quadrant | BADHDUFLAG | Total packets | Discarded packets |
| A | 0 | 18 | 0 |
| B | 0 | 18 | 0 |
| C | 0 | 18 | 0 |
| D | 0 | 18 | 0 |
| Mode SS | |||
|---|---|---|---|
| Quadrant | BADHDUFLAG | Total packets | Discarded packets |
| A | 0 | 146 | 0 |
| B | 0 | 146 | 0 |
| C | 0 | 146 | 0 |
| D | 0 | 146 | 0 |
| Mode M0 | |||
|---|---|---|---|
| Quadrant | BADHDUFLAG | Total packets | Discarded packets |
| A | 0 | 15097 | 3 |
| B | 0 | 14657 | 2 |
| C | 0 | 15050 | 2 |
| D | 0 | 14747 | 2 |
| Quadrant | Total seconds | Saturated seconds | Saturation percentage |
|---|---|---|---|
| A | 7196 | 33 | 0.458588% |
| B | 7196 | 30 | 0.416898% |
| C | 7196 | 53 | 0.736520% |
| D | 7196 | 13 | 0.180656% |
Noise dominated data is calculated using 1-second bins in cleaned event files. If a bin has >2000 counts, and if more than 50% of those come from <1% of pixels, then it is considered to be noise-dominated and hence unusable.
| Quadrant | # 1 sec bins | Bins with >0 counts | Bins with >2000 counts | High rate bins dominated by noise | Noise dominated (total time) | Noise dominated (detector-on time) | Marked lightcurve |
|---|---|---|---|---|---|---|---|
| A | 8966 | 7198 | 0 | 0 | 0.00% | 0.00% | 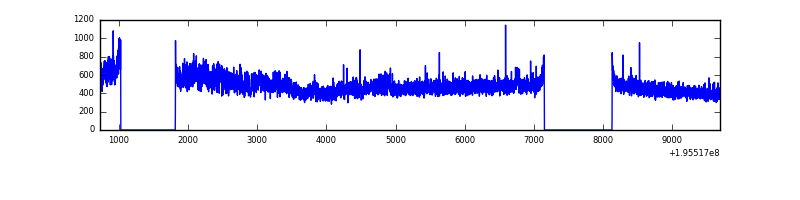 |
| B | 8966 | 7198 | 2 | 2 | 0.02% | 0.03% | 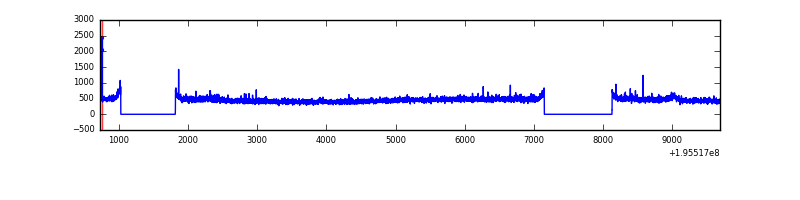 |
| C | 8966 | 7198 | 20 | 20 | 0.22% | 0.28% | 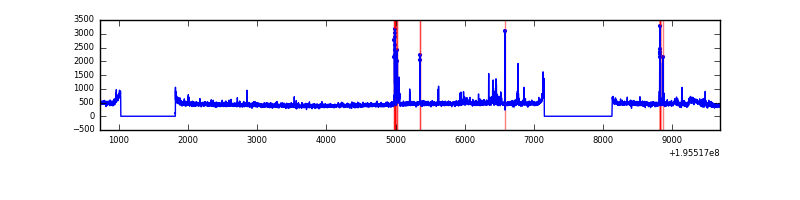 |
| D | 8966 | 7198 | 5 | 5 | 0.06% | 0.07% | 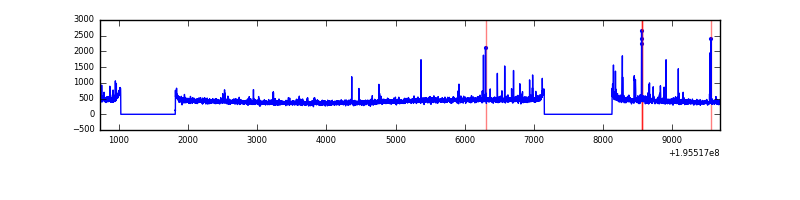 |
Top three noisy pixels from each quadrant. If the there are fewer than three noisy pixels in the level2.evt file, extra rows are filled as -1
| Pixel properties | Quadrant properties | ||||||
|---|---|---|---|---|---|---|---|
| Quadrant | DetID | PixID | Counts | Sigma | Mean | Median | Sigma |
| A | 8 | 15 | 325844 | 1962.2 | 812 | 794 | 165.7 |
| A | 12 | 194 | 9077 | 50.0 | 812 | 794 | 165.7 |
| A | 0 | 226 | 8669 | 47.54 | 812 | 794 | 165.7 |
| B | 12 | 0 | 23146 | 138.9 | 832 | 811 | 160.8 |
| B | 4 | 48 | 17012 | 100.75 | 832 | 811 | 160.8 |
| B | 15 | 85 | 12589 | 73.25 | 832 | 811 | 160.8 |
| C | 14 | 223 | 124743 | 659.98 | 794 | 796 | 187.8 |
| C | 10 | 82 | 73165 | 385.34 | 794 | 796 | 187.8 |
| C | 10 | 65 | 19944 | 101.96 | 794 | 796 | 187.8 |
| D | 2 | 14 | 16936 | 86.43 | 784 | 766 | 187.1 |
| D | 10 | 149 | 14985 | 76.01 | 784 | 766 | 187.1 |
| D | 1 | 20 | 14570 | 73.79 | 784 | 766 | 187.1 |
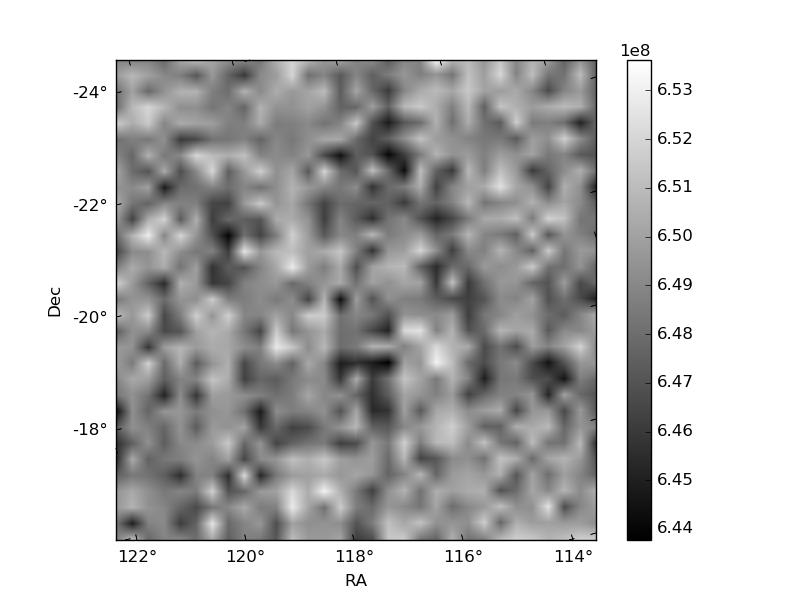
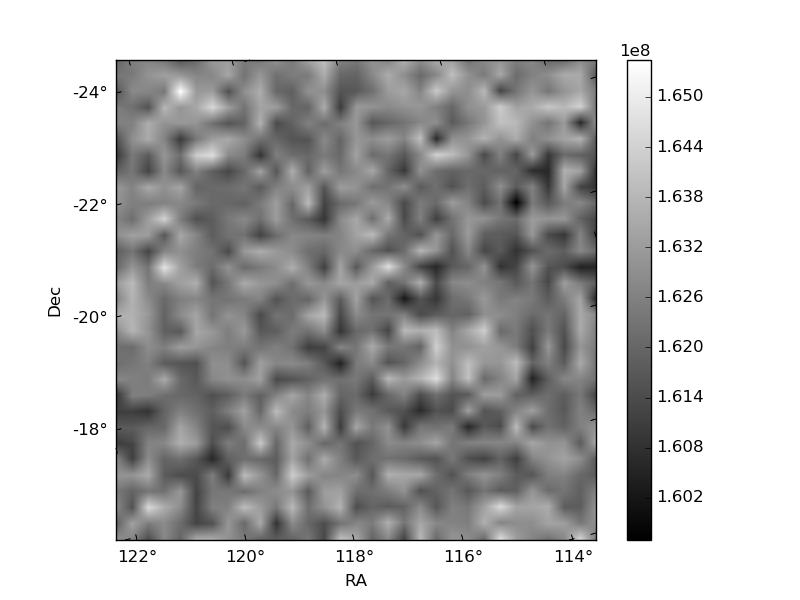
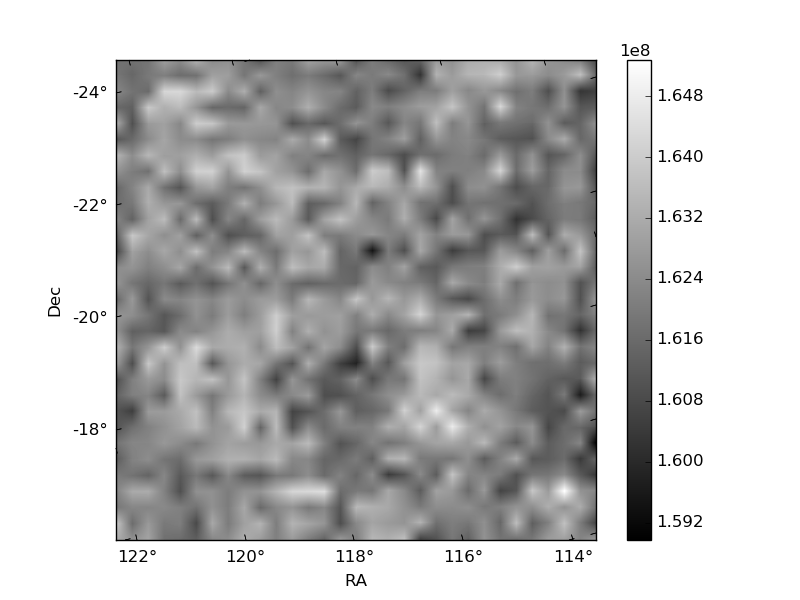
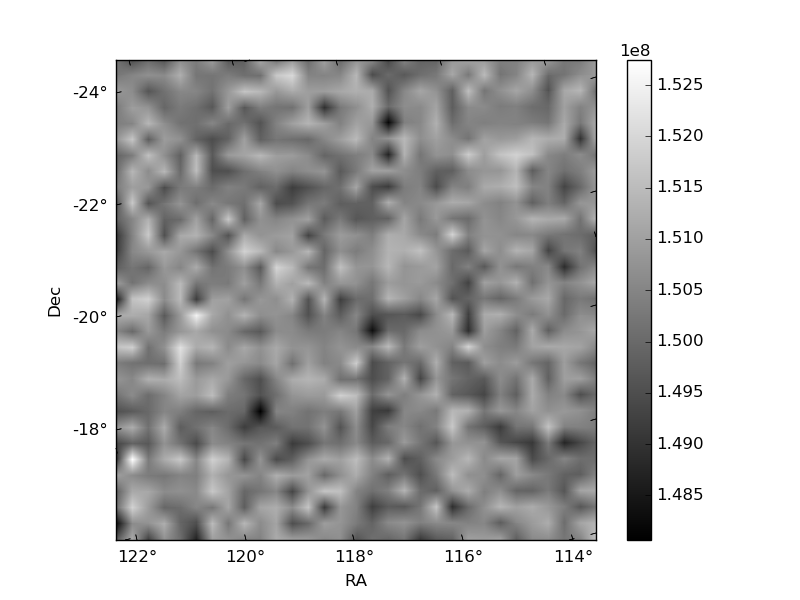
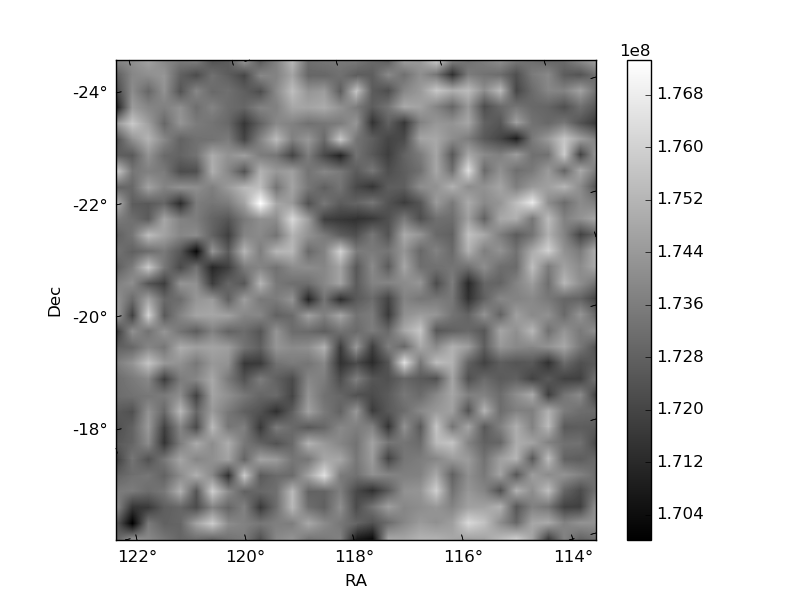
Histogram calculated using DETX and DETY for each event in the final _common_clean file
| Quadrant A | 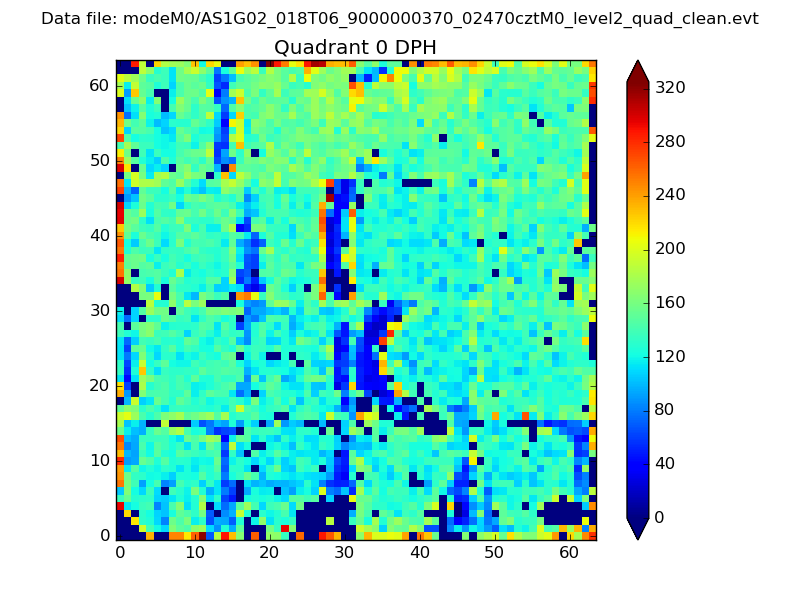 |
 |
Quadrant B |
|---|---|---|---|
| Quadrant D | 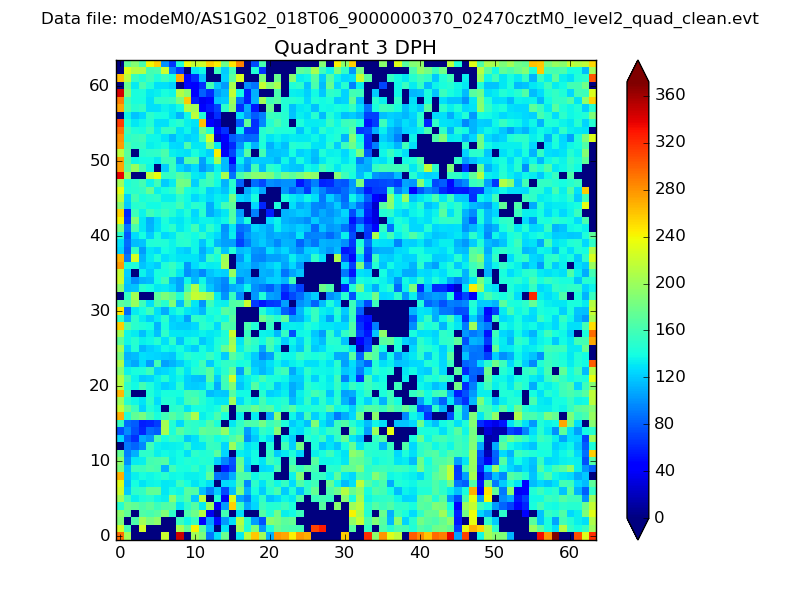 |
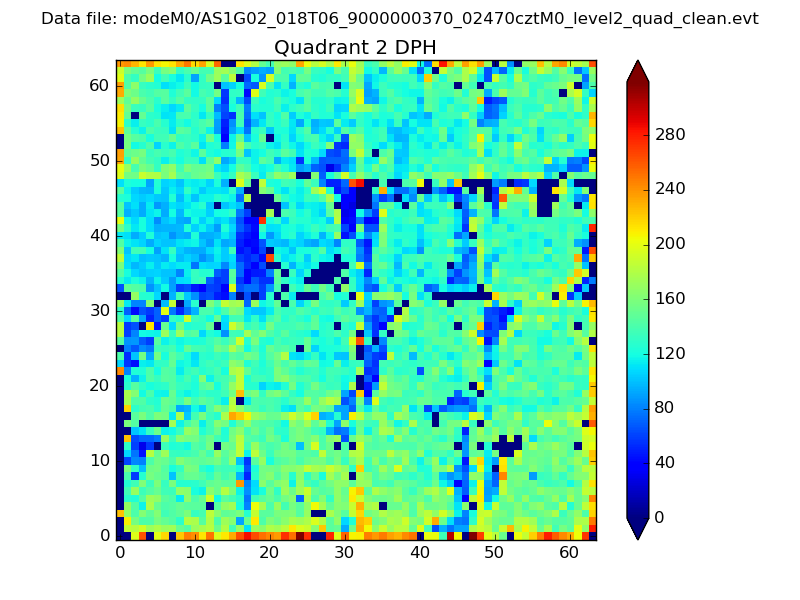 |
Quadrant C |
| Plot type | Count rate plots | Images |
|---|---|---|
| Comparison with Poisson distribution Blue bars denote a histogram of data divided into 1 sec bins. Red curve is a Poisson curve with rate = median count rate of data. |
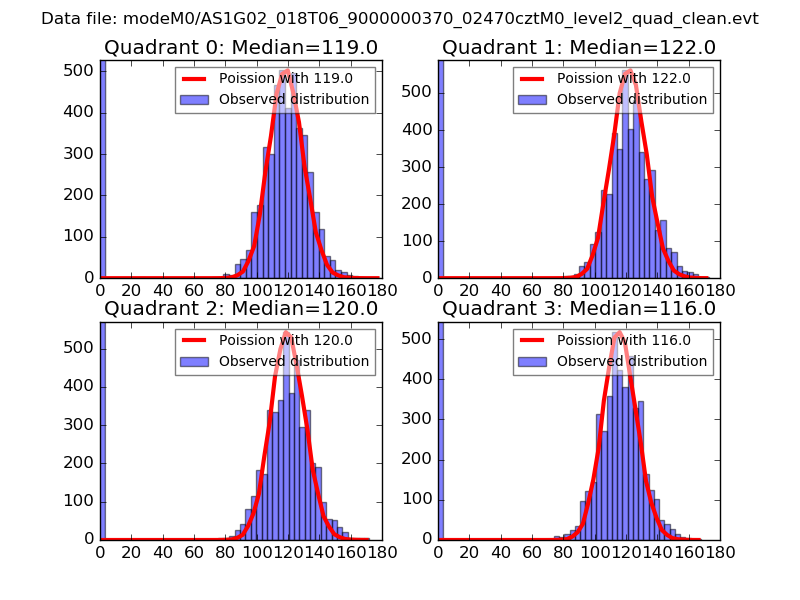 |
 |
| Quadrant-wise count rates Data is divided into 100 sec bins |
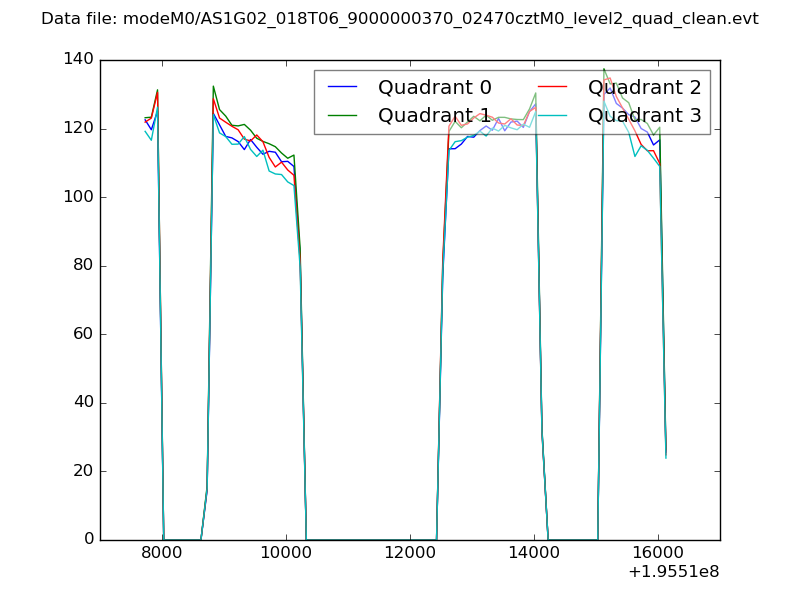 |
|
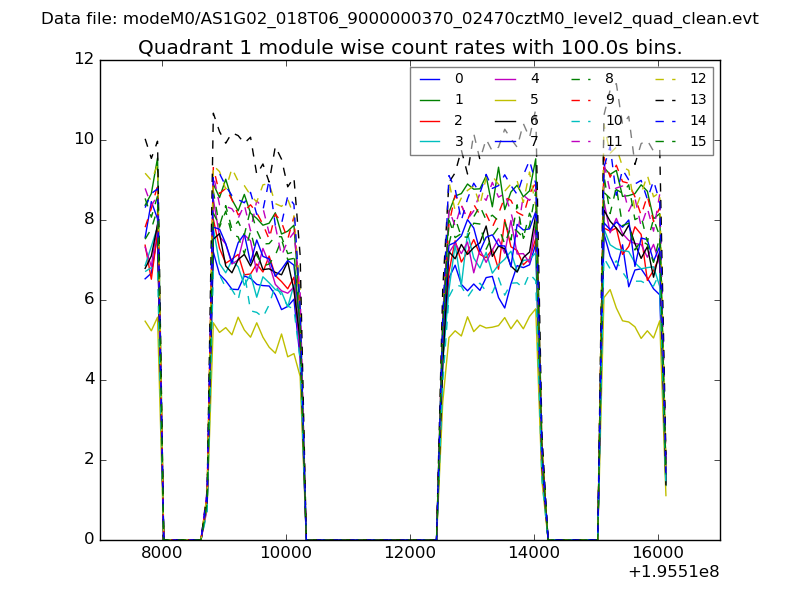
| Module-wise count rates for Quadrant A Data is divided into 100 sec bins |
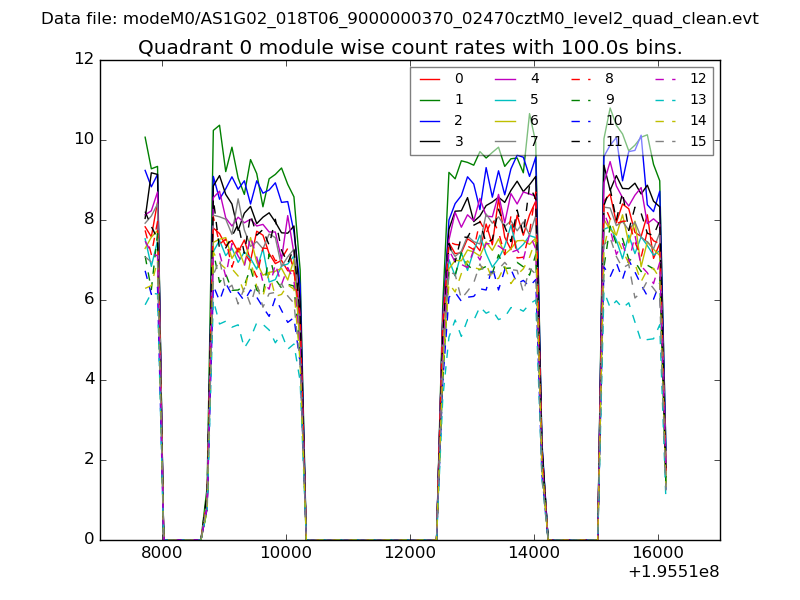 |
 |
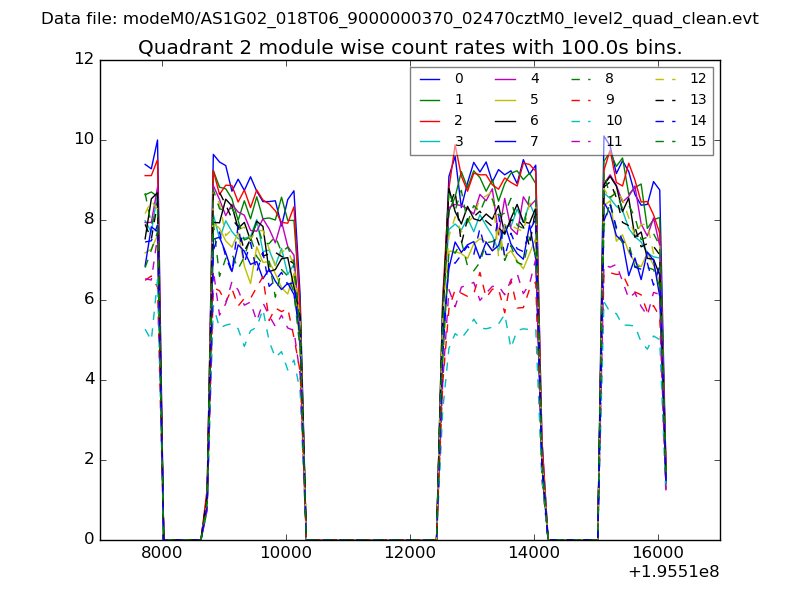
| Module-wise count rates for Quadrant B Data is divided into 100 sec bins |
 |
 |
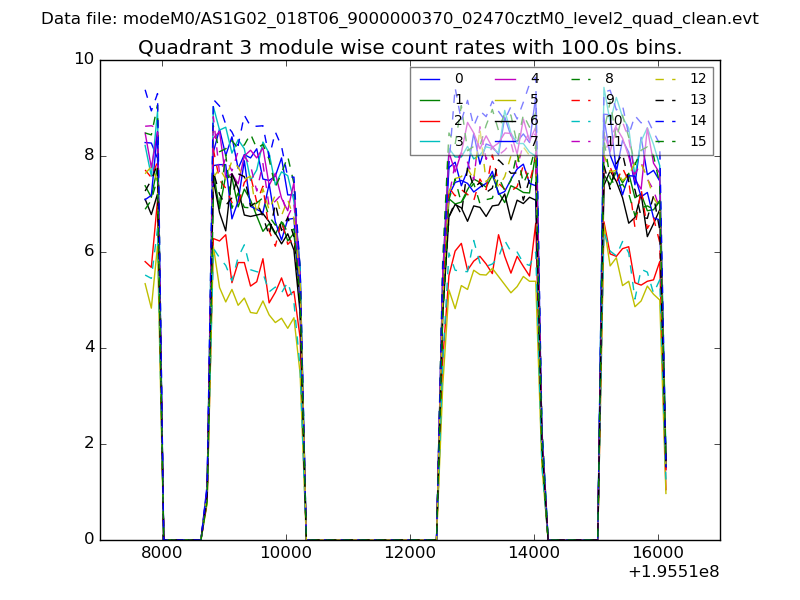
| Module-wise count rates for Quadrant C Data is divided into 100 sec bins |
 |
 |
| Module-wise count rates for Quadrant D Data is divided into 100 sec bins |
 |
 |
| Parameter | Plot |
|---|---|
| CZT HV Monitor | 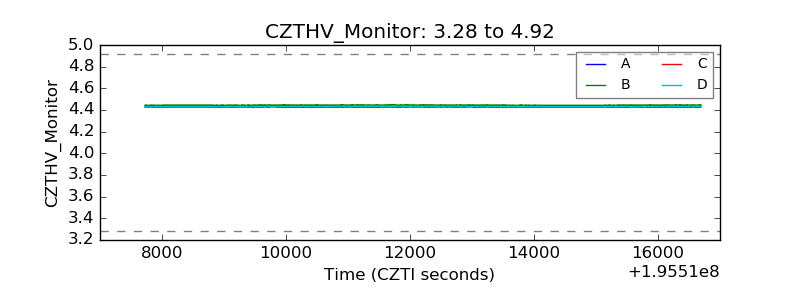 |
| D_VDD | 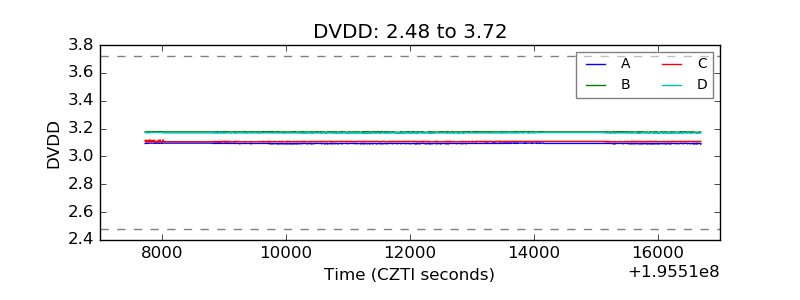 |
| Temperature 1 | 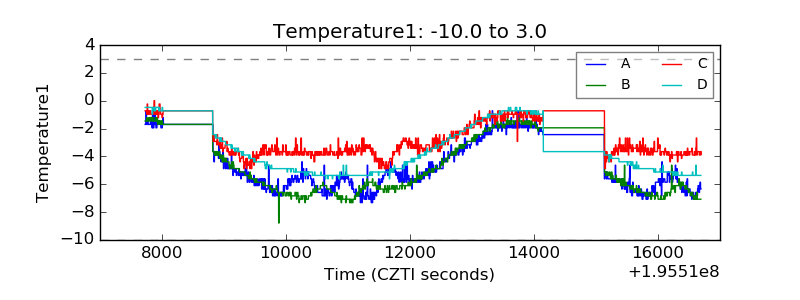 |
| Veto HV Monitor | 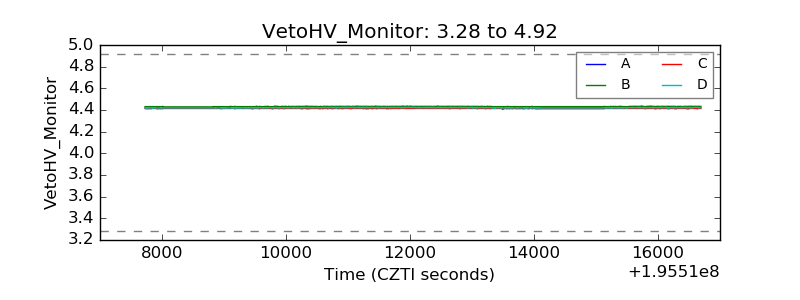 |
| Veto LLD | 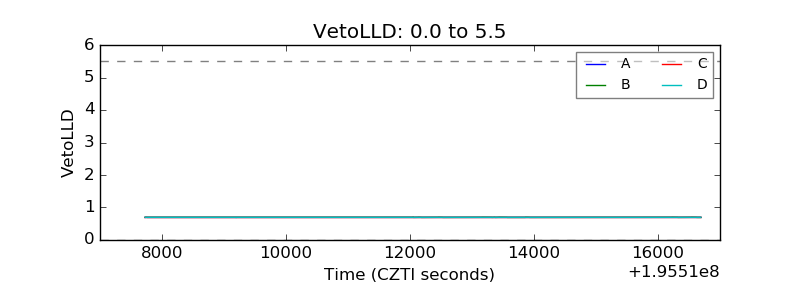 |
| Alpha Counter | 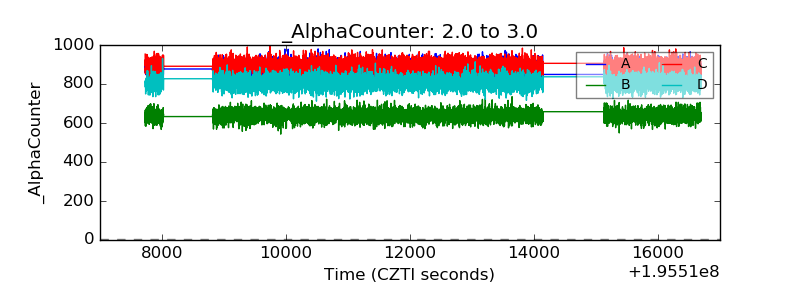 |
| _CPM_Rate | 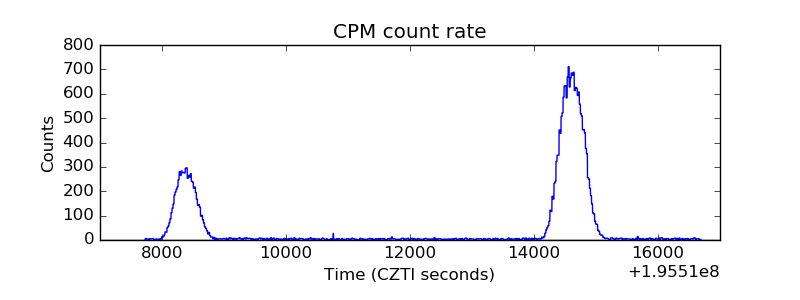 |
| CZT Counter | 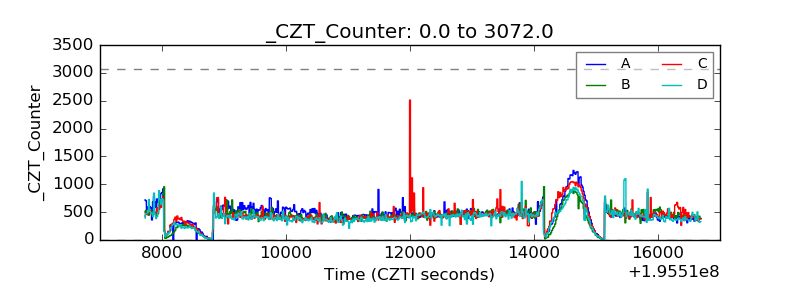 |
| +2.5 Volts monitor | 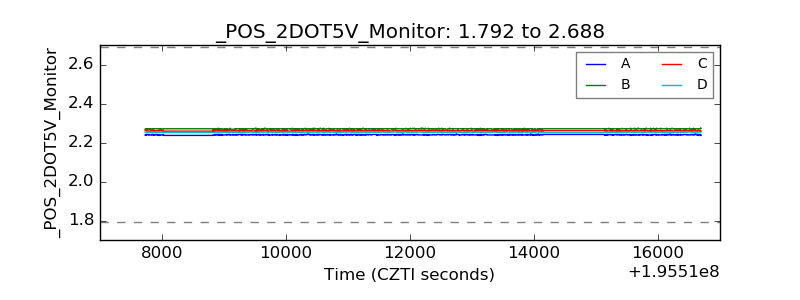 |
| +5 Volts monitor | 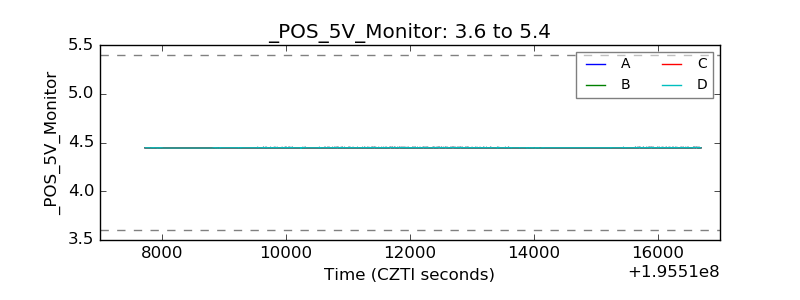 |
| _ROLL_ROT | 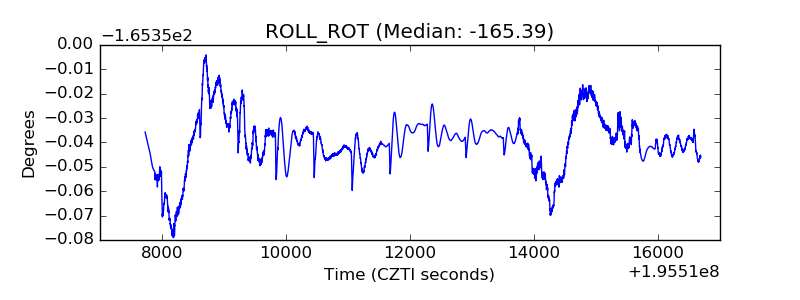 |
| _Roll_DEC | 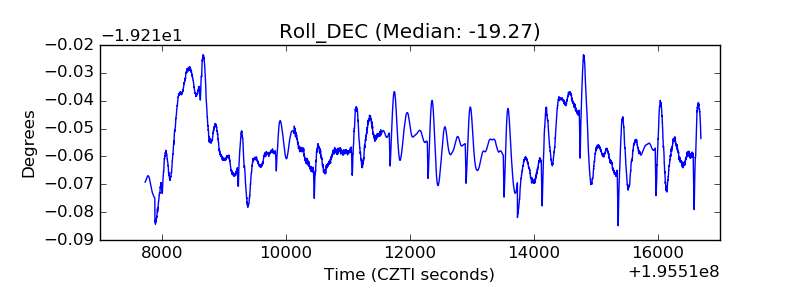 |
| _Roll_RA | 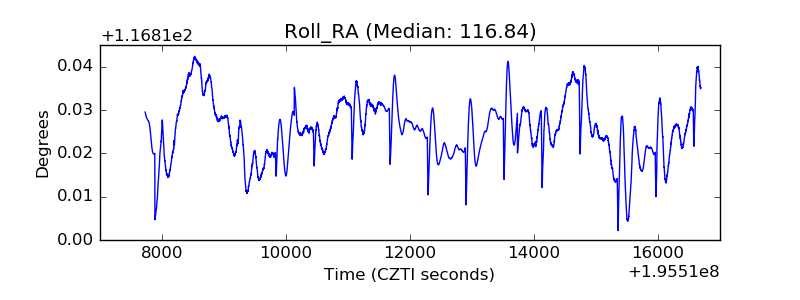 |
| Veto Counter | 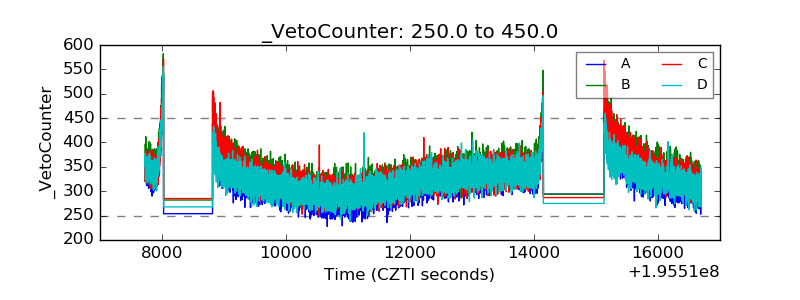 |