| Param | Original file | Final file |
|---|---|---|
| Filename | modeM0/AS1G02_018T06_9000000370_02473cztM0_level2.evt | modeM0/AS1G02_018T06_9000000370_02473cztM0_level2_quad_clean.evt |
| Size (bytes) | 421,392,960 | 65,157,120 |
| Size | 401.9 MB | 62.1 MB |
| Events in quadrant A | 2,981,543 | 374,584 |
| Events in quadrant B | 3,103,968 | 389,499 |
| Events in quadrant C | 3,152,809 | 383,305 |
| Events in quadrant D | 3,078,730 | 369,151 |
| Mode M9 | |||
|---|---|---|---|
| Quadrant | BADHDUFLAG | Total packets | Discarded packets |
| A | 0 | 15 | 0 |
| B | 0 | 15 | 0 |
| C | 0 | 15 | 0 |
| D | 0 | 16 | 0 |
| Mode SS | |||
|---|---|---|---|
| Quadrant | BADHDUFLAG | Total packets | Discarded packets |
| A | 0 | 134 | 0 |
| B | 0 | 134 | 0 |
| C | 0 | 134 | 0 |
| D | 0 | 134 | 0 |
| Mode M0 | |||
|---|---|---|---|
| Quadrant | BADHDUFLAG | Total packets | Discarded packets |
| A | 0 | 13283 | 3 |
| B | 0 | 13431 | 2 |
| C | 0 | 13749 | 2 |
| D | 0 | 13892 | 2 |
| Quadrant | Total seconds | Saturated seconds | Saturation percentage |
|---|---|---|---|
| A | 6535 | 12 | 0.183627% |
| B | 6535 | 28 | 0.428462% |
| C | 6535 | 26 | 0.397858% |
| D | 6535 | 42 | 0.642693% |
Noise dominated data is calculated using 1-second bins in cleaned event files. If a bin has >2000 counts, and if more than 50% of those come from <1% of pixels, then it is considered to be noise-dominated and hence unusable.
| Quadrant | # 1 sec bins | Bins with >0 counts | Bins with >2000 counts | High rate bins dominated by noise | Noise dominated (total time) | Noise dominated (detector-on time) | Marked lightcurve |
|---|---|---|---|---|---|---|---|
| A | 7730 | 6536 | 0 | 0 | 0.00% | 0.00% | 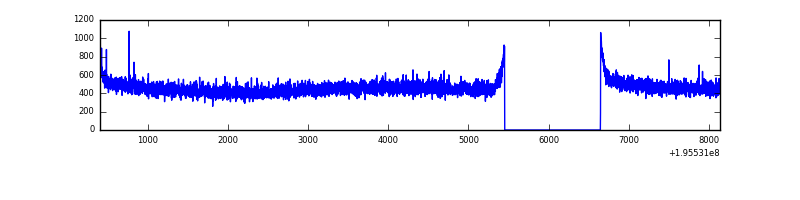 |
| B | 7730 | 6536 | 0 | 0 | 0.00% | 0.00% | 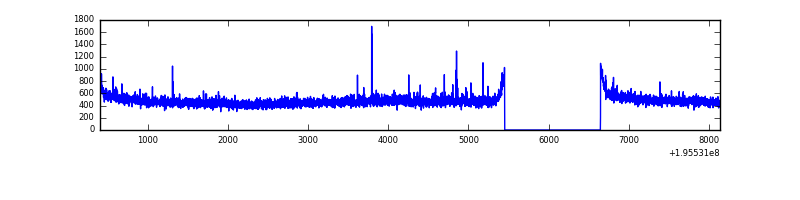 |
| C | 7730 | 6536 | 11 | 11 | 0.14% | 0.17% | 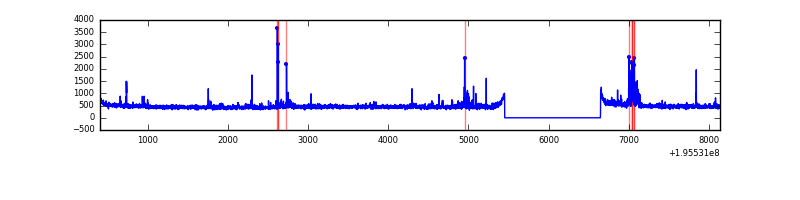 |
| D | 7730 | 6536 | 26 | 26 | 0.34% | 0.40% | 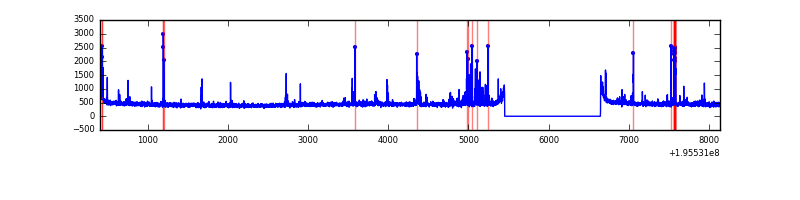 |
Top three noisy pixels from each quadrant. If the there are fewer than three noisy pixels in the level2.evt file, extra rows are filled as -1
| Pixel properties | Quadrant properties | ||||||
|---|---|---|---|---|---|---|---|
| Quadrant | DetID | PixID | Counts | Sigma | Mean | Median | Sigma |
| A | 12 | 194 | 8555 | 49.33 | 773 | 758 | 158.1 |
| A | 0 | 226 | 8180 | 46.96 | 773 | 758 | 158.1 |
| A | 14 | 63 | 5862 | 32.29 | 773 | 758 | 158.1 |
| B | 4 | 48 | 20472 | 130.58 | 793 | 775 | 150.8 |
| B | 4 | 200 | 13736 | 85.92 | 793 | 775 | 150.8 |
| B | 15 | 85 | 12418 | 77.18 | 793 | 775 | 150.8 |
| C | 14 | 223 | 156934 | 883.96 | 758 | 763 | 176.7 |
| C | 10 | 65 | 18866 | 102.47 | 758 | 763 | 176.7 |
| C | 13 | 61 | 6956 | 35.05 | 758 | 763 | 176.7 |
| D | 7 | 67 | 121881 | 683.36 | 744 | 728 | 177.3 |
| D | 10 | 102 | 49235 | 273.6 | 744 | 728 | 177.3 |
| D | 2 | 14 | 43483 | 241.16 | 744 | 728 | 177.3 |
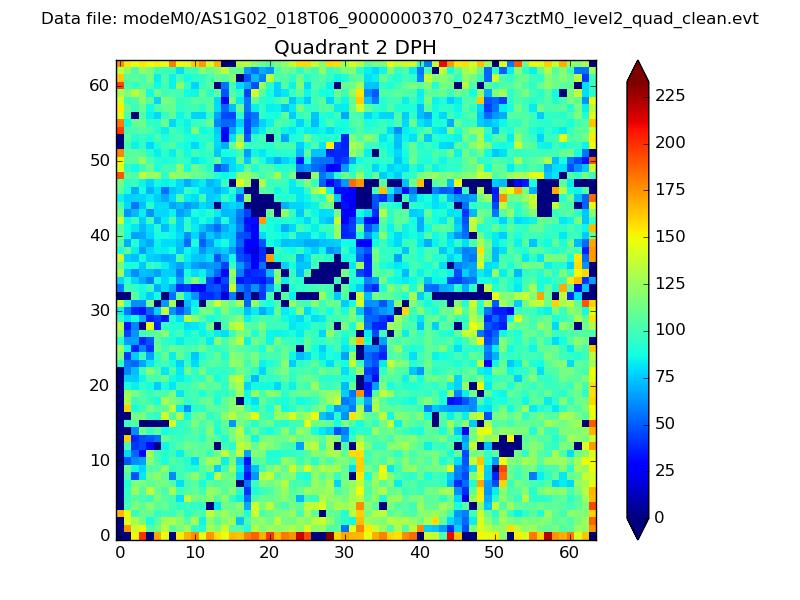
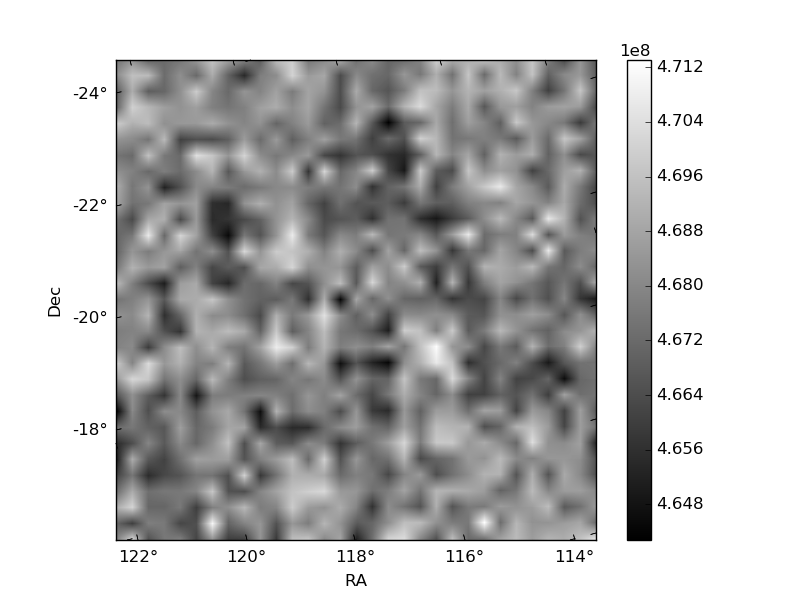
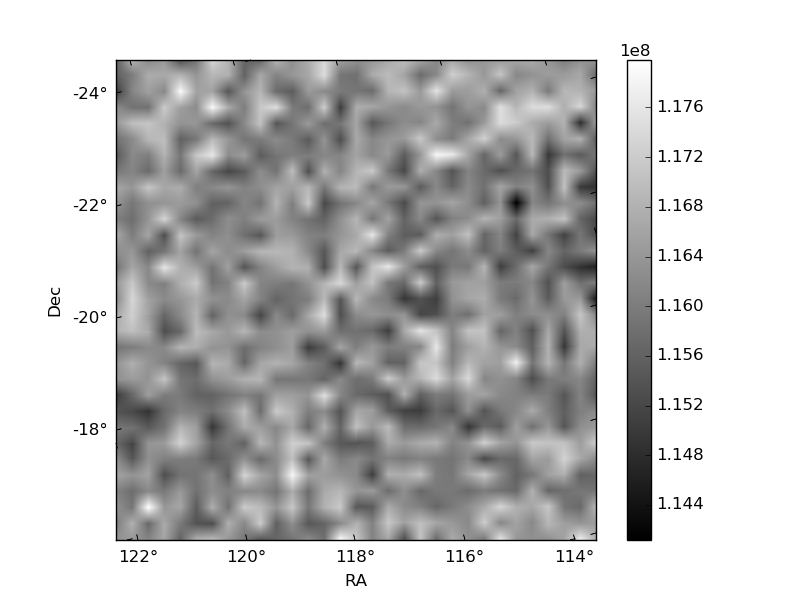
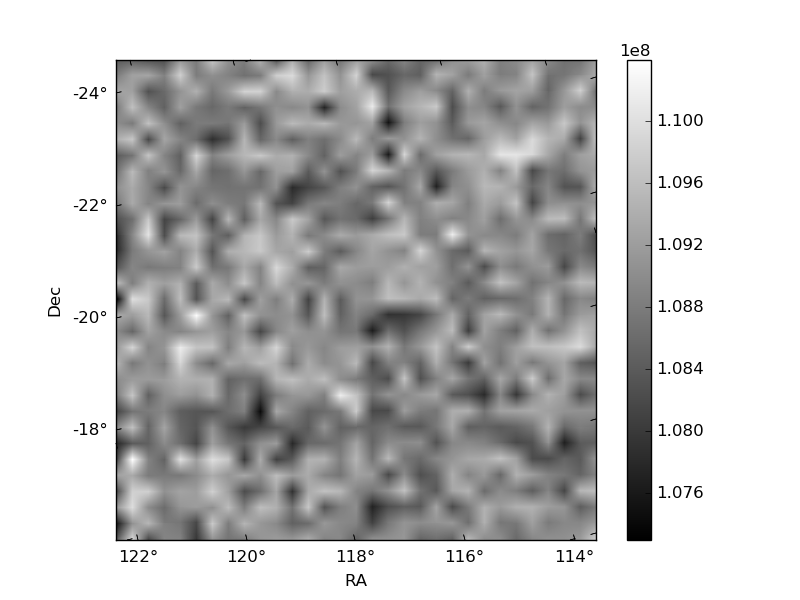
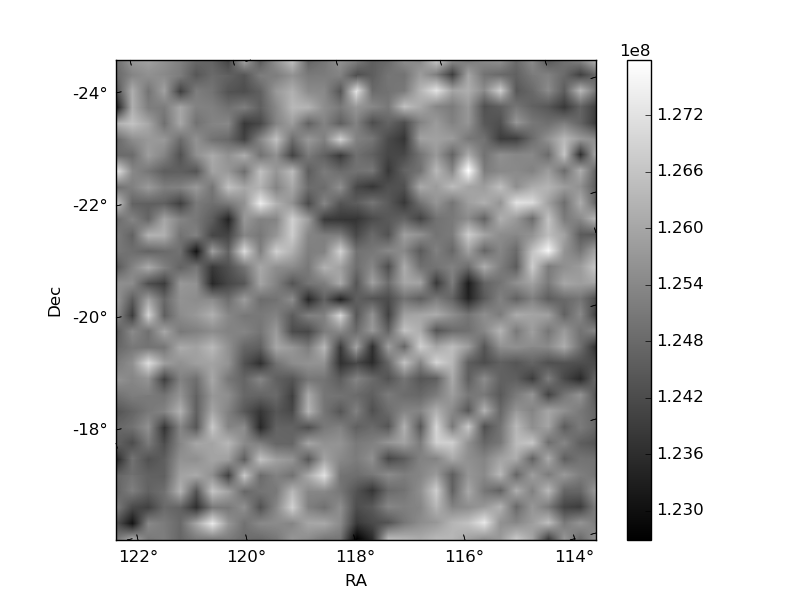
Histogram calculated using DETX and DETY for each event in the final _common_clean file
| Quadrant A | 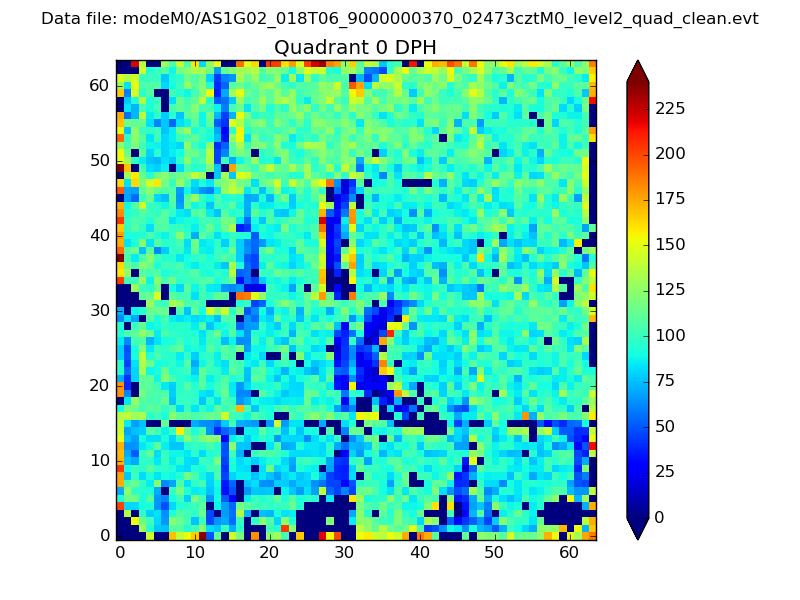 |
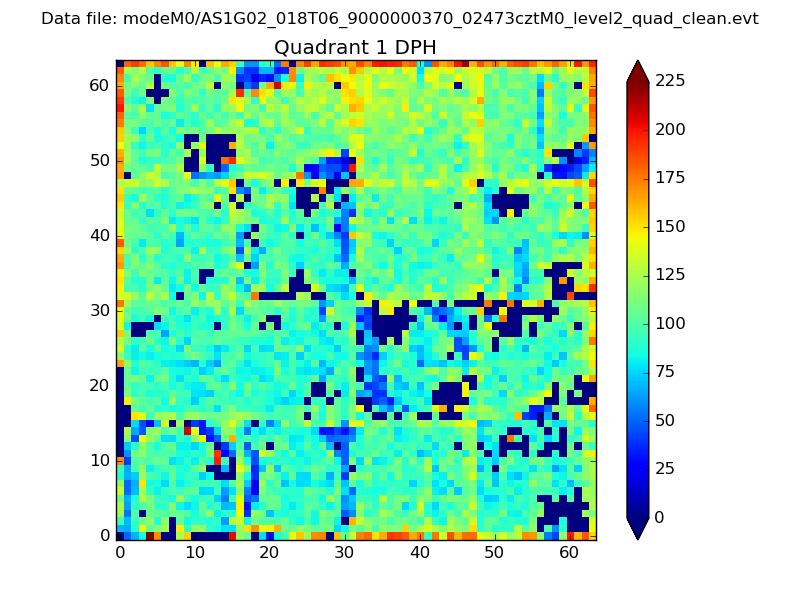 |
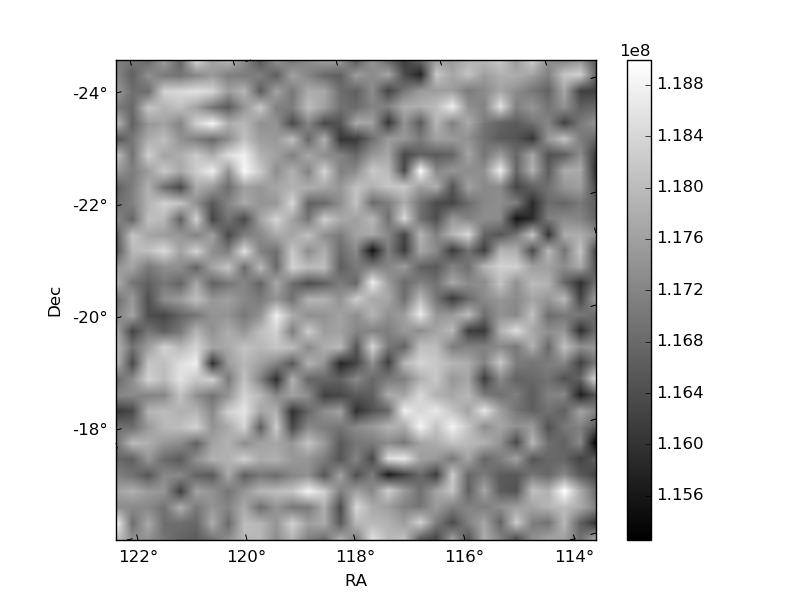
Quadrant B |
|---|---|---|---|
| Quadrant D | 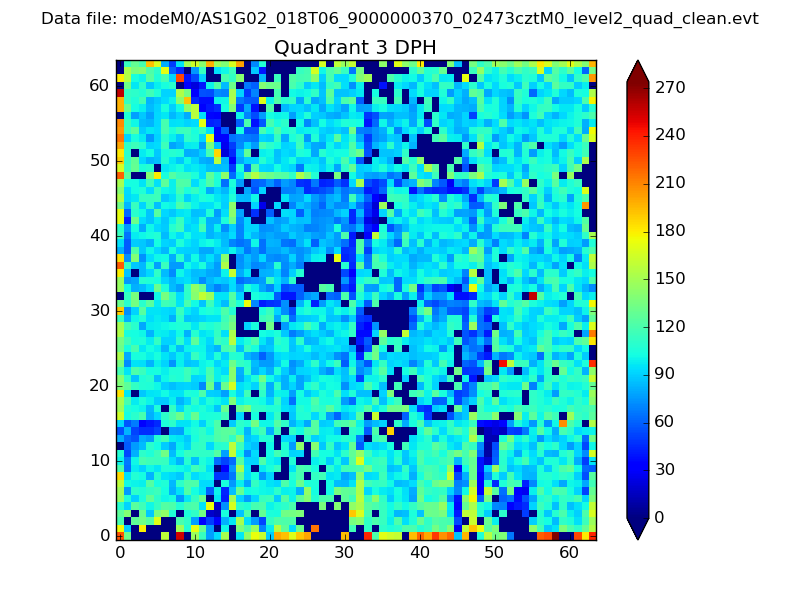 |
 |
Quadrant C |
| Plot type | Count rate plots | Images |
|---|---|---|
| Comparison with Poisson distribution Blue bars denote a histogram of data divided into 1 sec bins. Red curve is a Poisson curve with rate = median count rate of data. |
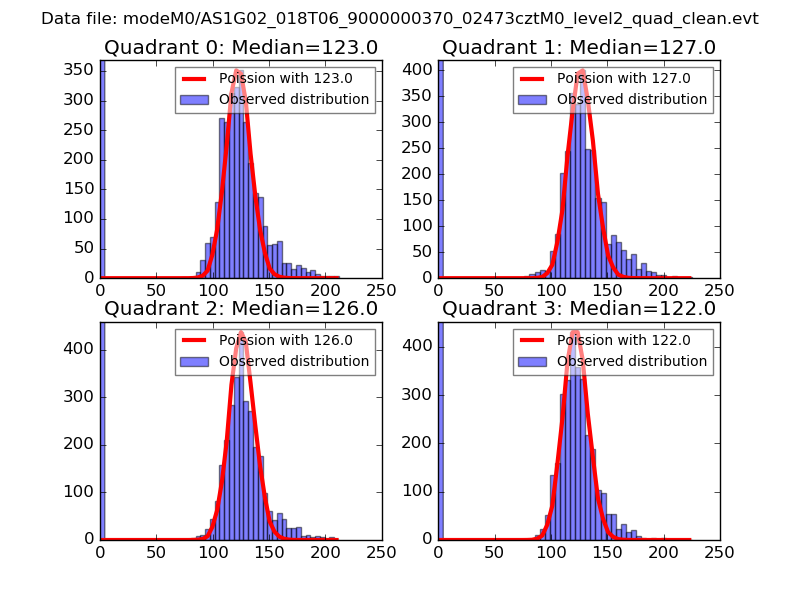 |
 |
| Quadrant-wise count rates Data is divided into 100 sec bins |
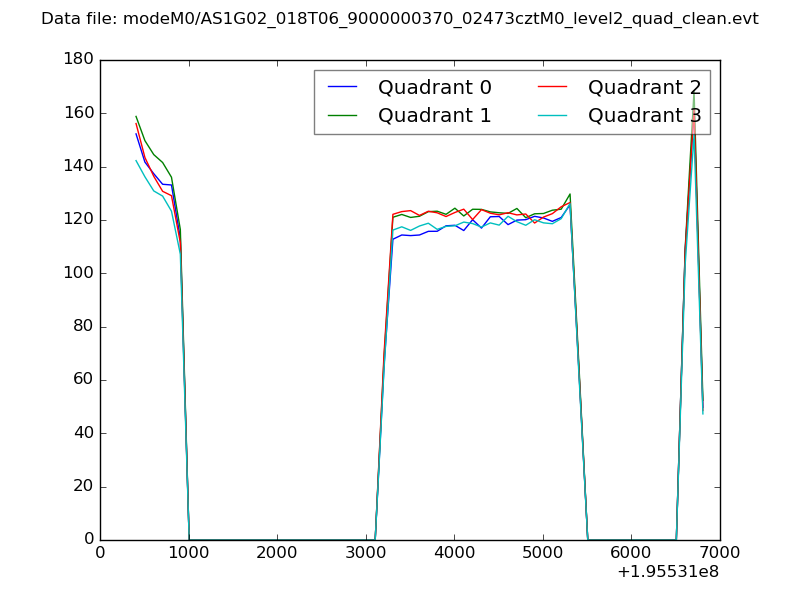 |
|
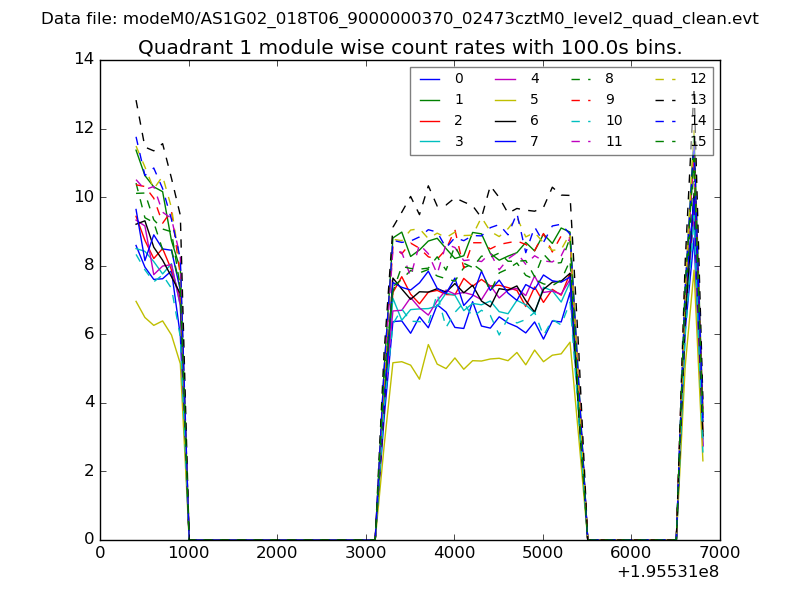
| Module-wise count rates for Quadrant A Data is divided into 100 sec bins |
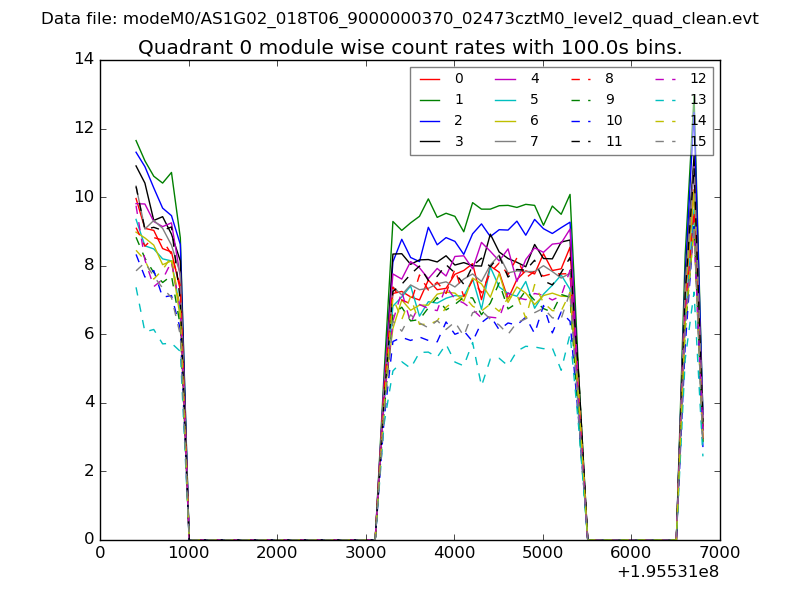 |
 |
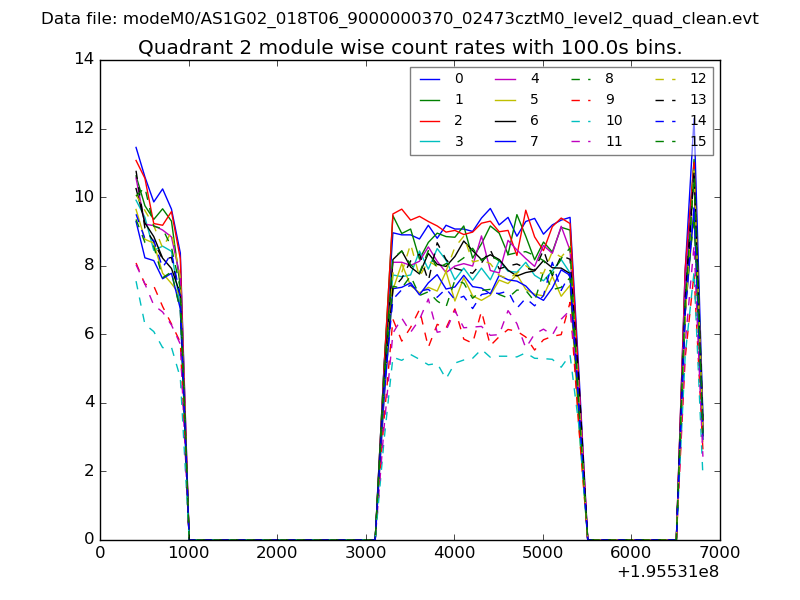
| Module-wise count rates for Quadrant B Data is divided into 100 sec bins |
 |
 |
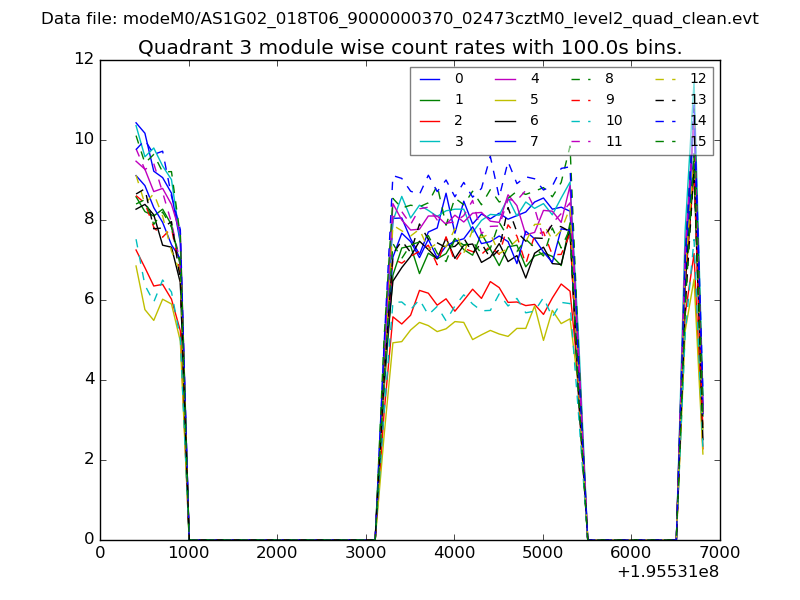
| Module-wise count rates for Quadrant C Data is divided into 100 sec bins |
 |
 |
| Module-wise count rates for Quadrant D Data is divided into 100 sec bins |
 |
 |
| Parameter | Plot |
|---|---|
| CZT HV Monitor | 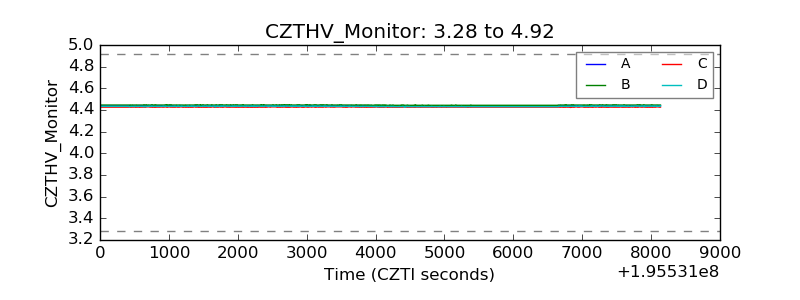 |
| D_VDD | 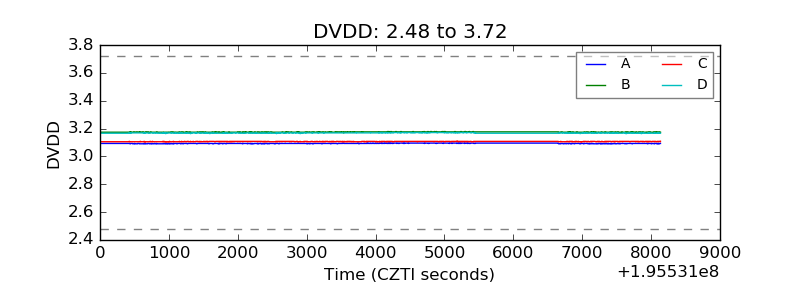 |
| Temperature 1 | 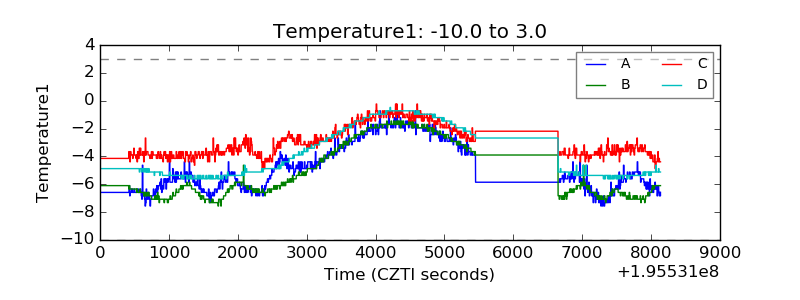 |
| Veto HV Monitor | 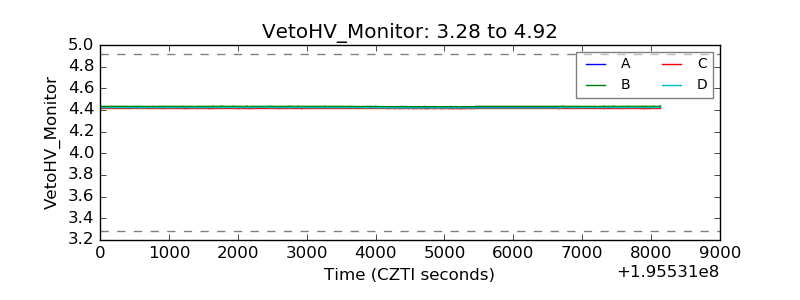 |
| Veto LLD | 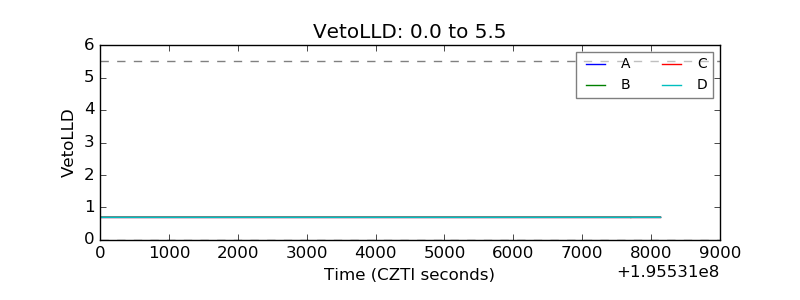 |
| Alpha Counter | 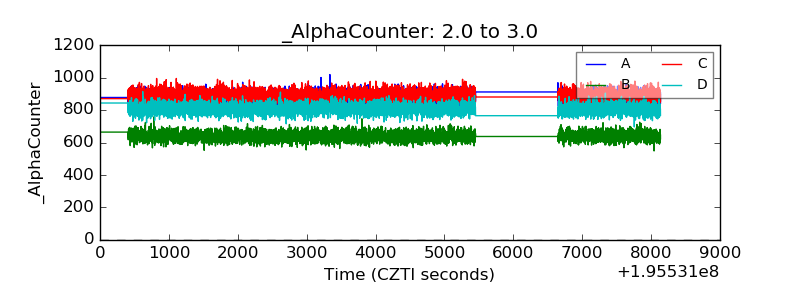 |
| _CPM_Rate | 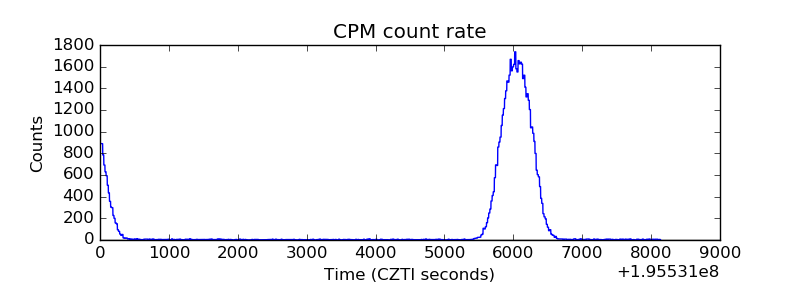 |
| CZT Counter | 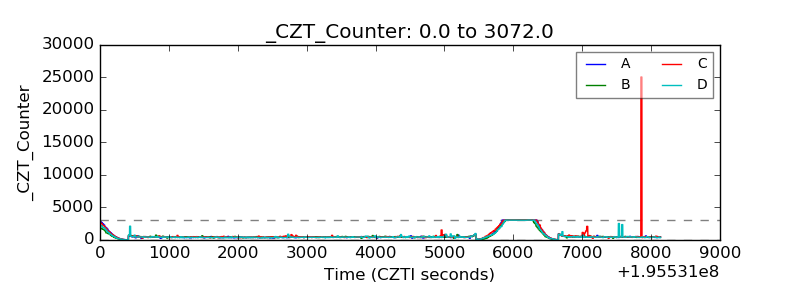 |
| +2.5 Volts monitor | 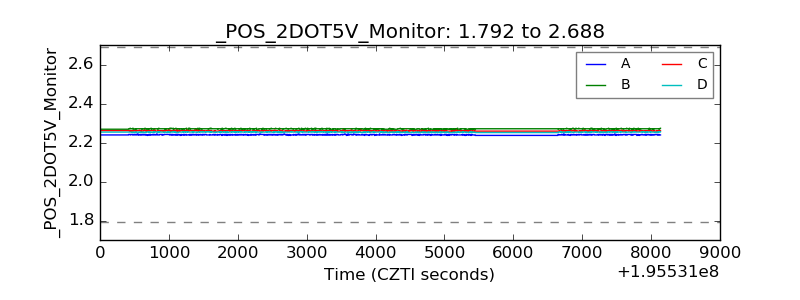 |
| +5 Volts monitor | 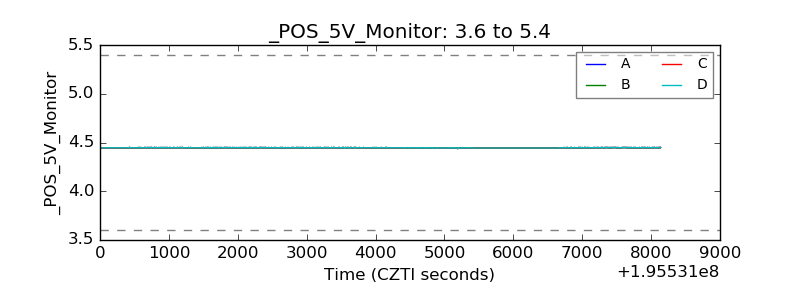 |
| _ROLL_ROT | 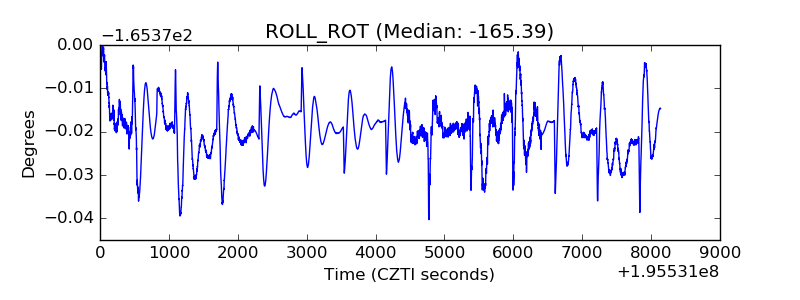 |
| _Roll_DEC | 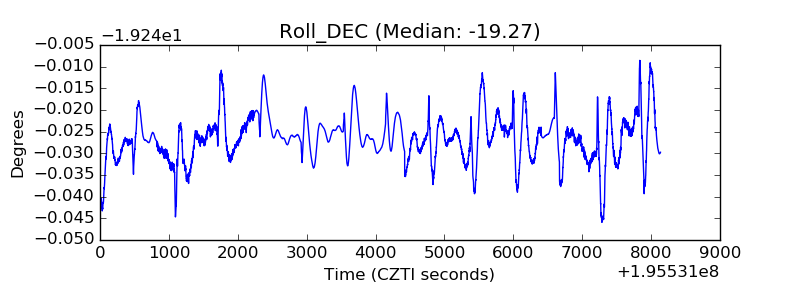 |
| _Roll_RA | 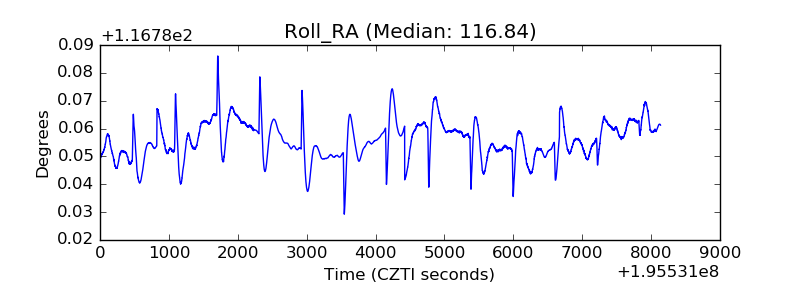 |
| Veto Counter | 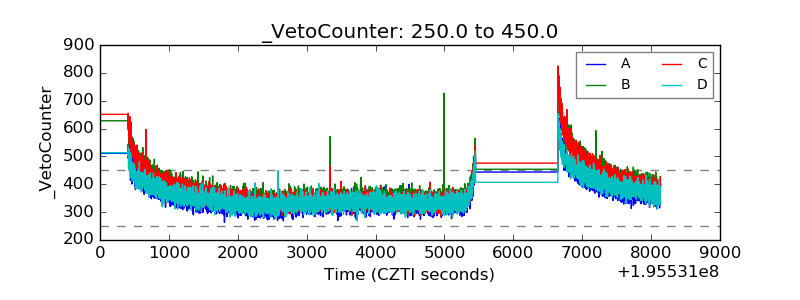 |