| Param | Original file | Final file |
|---|---|---|
| Filename | modeM0/AS1G02_018T06_9000000370_02474cztM0_level2.evt | modeM0/AS1G02_018T06_9000000370_02474cztM0_level2_quad_clean.evt |
| Size (bytes) | 429,143,040 | 60,577,920 |
| Size | 409.3 MB | 57.8 MB |
| Events in quadrant A | 3,052,923 | 342,193 |
| Events in quadrant B | 3,154,727 | 355,555 |
| Events in quadrant C | 3,295,487 | 350,096 |
| Events in quadrant D | 3,057,716 | 339,020 |
| Mode M9 | |||
|---|---|---|---|
| Quadrant | BADHDUFLAG | Total packets | Discarded packets |
| A | 0 | 21 | 0 |
| B | 0 | 21 | 0 |
| C | 0 | 21 | 0 |
| D | 0 | 22 | 0 |
| Mode SS | |||
|---|---|---|---|
| Quadrant | BADHDUFLAG | Total packets | Discarded packets |
| A | 0 | 132 | 0 |
| B | 0 | 132 | 0 |
| C | 0 | 132 | 0 |
| D | 0 | 132 | 0 |
| Mode M0 | |||
|---|---|---|---|
| Quadrant | BADHDUFLAG | Total packets | Discarded packets |
| A | 0 | 13170 | 3 |
| B | 0 | 13378 | 2 |
| C | 0 | 13918 | 2 |
| D | 0 | 13530 | 2 |
| Quadrant | Total seconds | Saturated seconds | Saturation percentage |
|---|---|---|---|
| A | 6402 | 29 | 0.452983% |
| B | 6402 | 40 | 0.624805% |
| C | 6402 | 69 | 1.077788% |
| D | 6402 | 51 | 0.796626% |
Noise dominated data is calculated using 1-second bins in cleaned event files. If a bin has >2000 counts, and if more than 50% of those come from <1% of pixels, then it is considered to be noise-dominated and hence unusable.
| Quadrant | # 1 sec bins | Bins with >0 counts | Bins with >2000 counts | High rate bins dominated by noise | Noise dominated (total time) | Noise dominated (detector-on time) | Marked lightcurve |
|---|---|---|---|---|---|---|---|
| A | 7667 | 6403 | 0 | 0 | 0.00% | 0.00% |  |
| B | 7667 | 6403 | 0 | 0 | 0.00% | 0.00% | 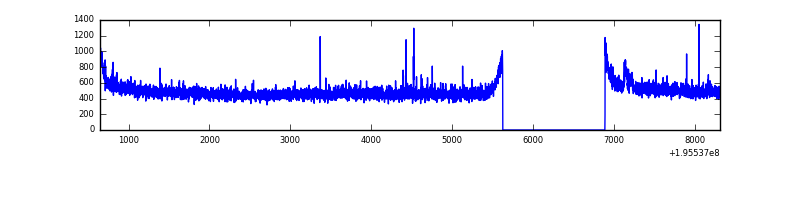 |
| C | 7667 | 6403 | 34 | 34 | 0.44% | 0.53% | 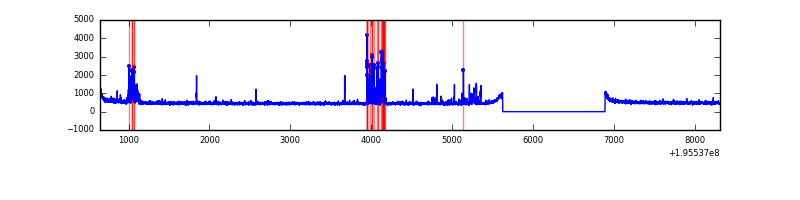 |
| D | 7667 | 6403 | 22 | 22 | 0.29% | 0.34% | 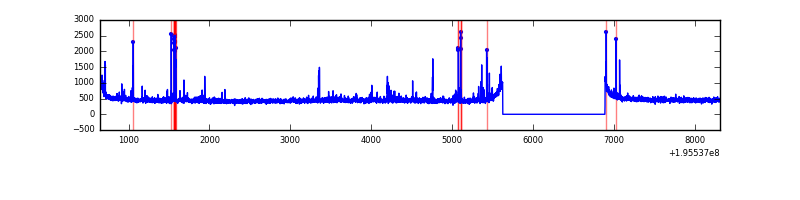 |
Top three noisy pixels from each quadrant. If the there are fewer than three noisy pixels in the level2.evt file, extra rows are filled as -1
| Pixel properties | Quadrant properties | ||||||
|---|---|---|---|---|---|---|---|
| Quadrant | DetID | PixID | Counts | Sigma | Mean | Median | Sigma |
| A | 14 | 63 | 10934 | 63.1 | 787 | 770 | 161.1 |
| A | 12 | 194 | 8852 | 50.17 | 787 | 770 | 161.1 |
| A | 8 | 15 | 8802 | 49.86 | 787 | 770 | 161.1 |
| B | 12 | 0 | 15220 | 93.84 | 807 | 790 | 153.8 |
| B | 12 | 111 | 11160 | 67.43 | 807 | 790 | 153.8 |
| B | 15 | 85 | 10906 | 65.78 | 807 | 790 | 153.8 |
| C | 14 | 223 | 242576 | 1352.36 | 773 | 779 | 178.8 |
| C | 12 | 4 | 12569 | 65.94 | 773 | 779 | 178.8 |
| C | 10 | 65 | 10608 | 54.97 | 773 | 779 | 178.8 |
| D | 10 | 102 | 56436 | 308.35 | 758 | 740 | 180.6 |
| D | 5 | 172 | 28958 | 156.22 | 758 | 740 | 180.6 |
| D | 9 | 64 | 25580 | 137.52 | 758 | 740 | 180.6 |
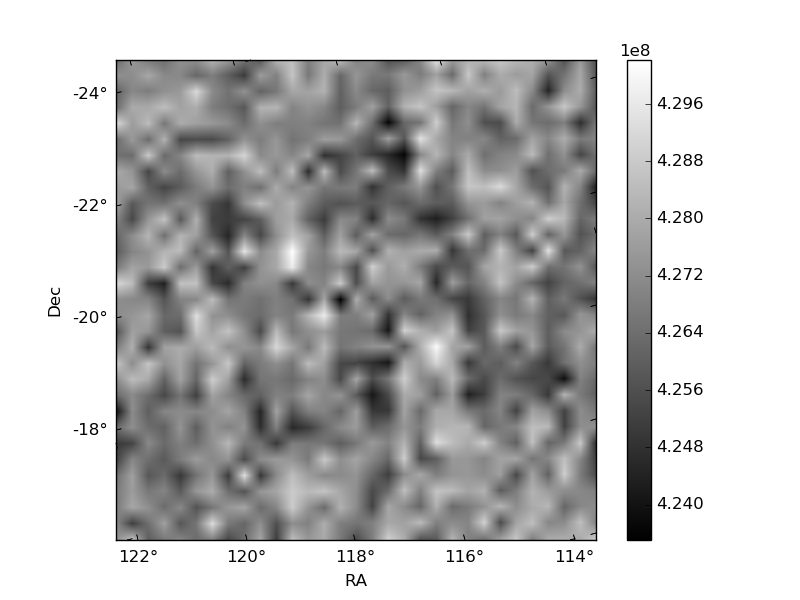
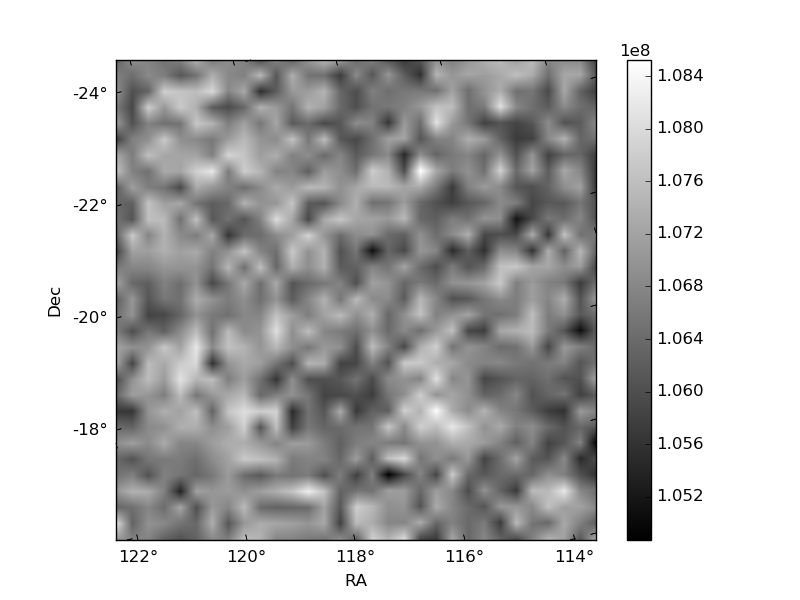
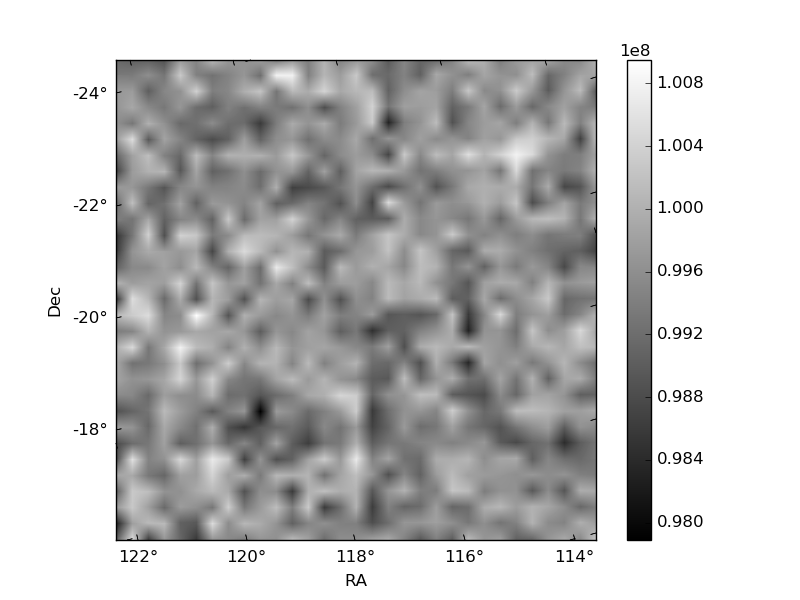
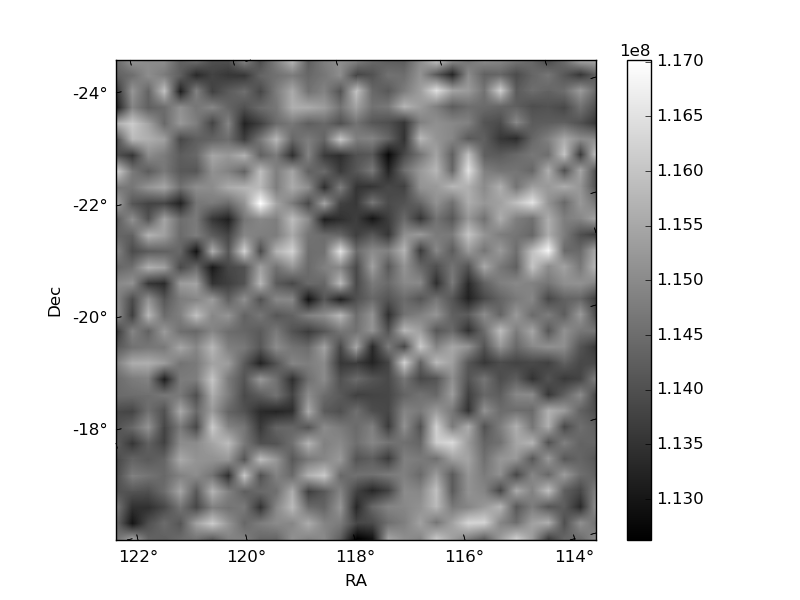
Histogram calculated using DETX and DETY for each event in the final _common_clean file
| Quadrant A | 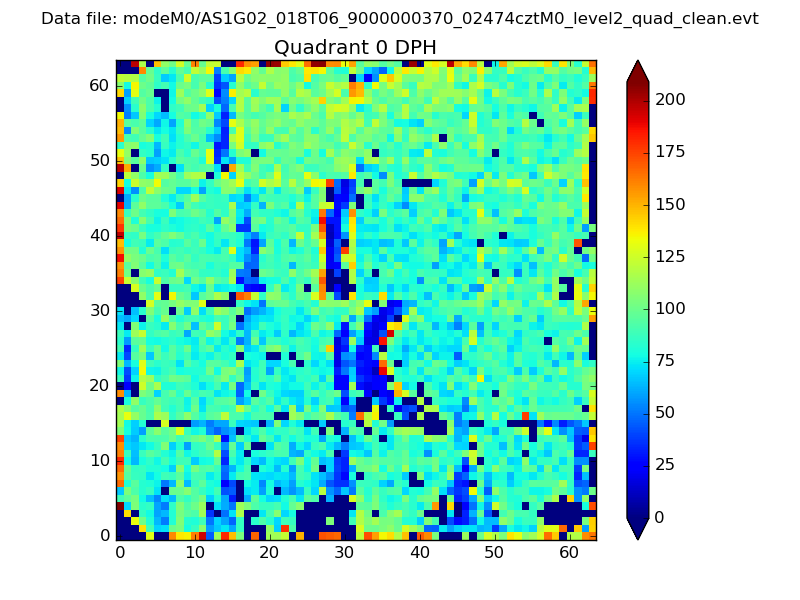 |
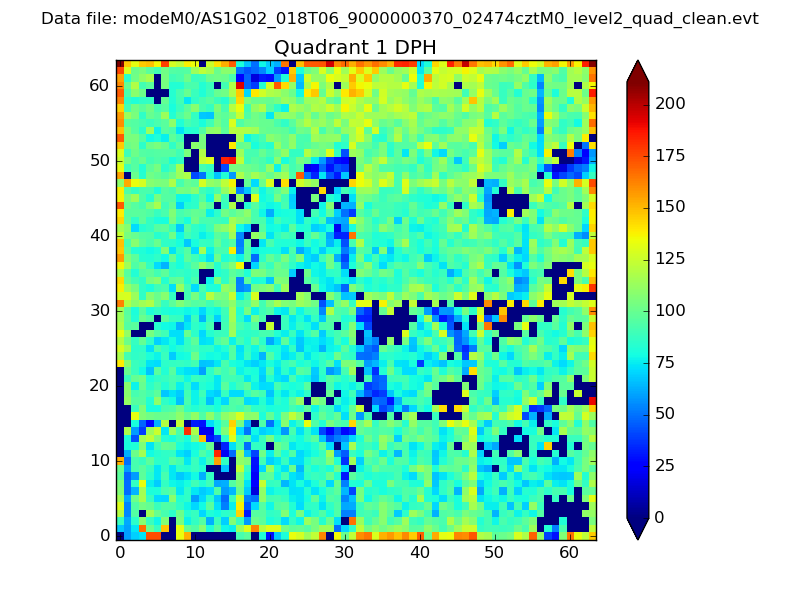 |
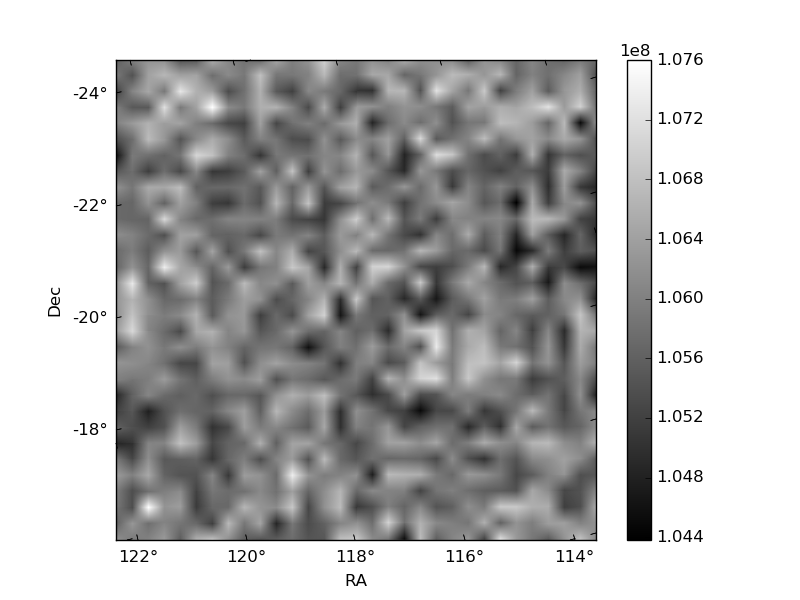
Quadrant B |
|---|---|---|---|
| Quadrant D | 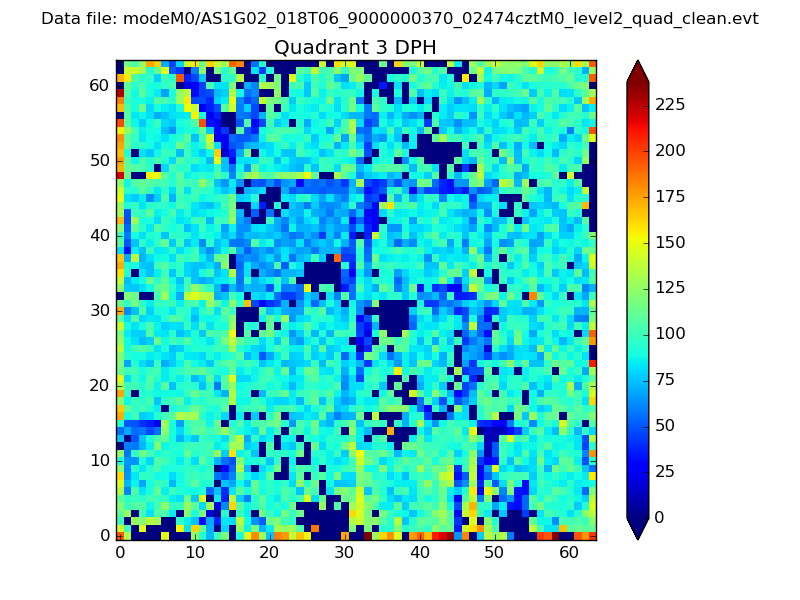 |
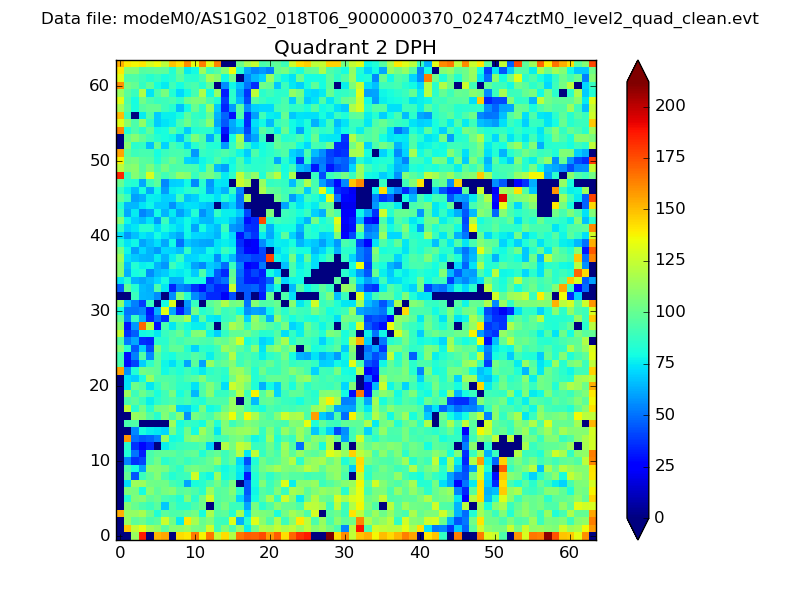 |
Quadrant C |
| Plot type | Count rate plots | Images |
|---|---|---|
| Comparison with Poisson distribution Blue bars denote a histogram of data divided into 1 sec bins. Red curve is a Poisson curve with rate = median count rate of data. |
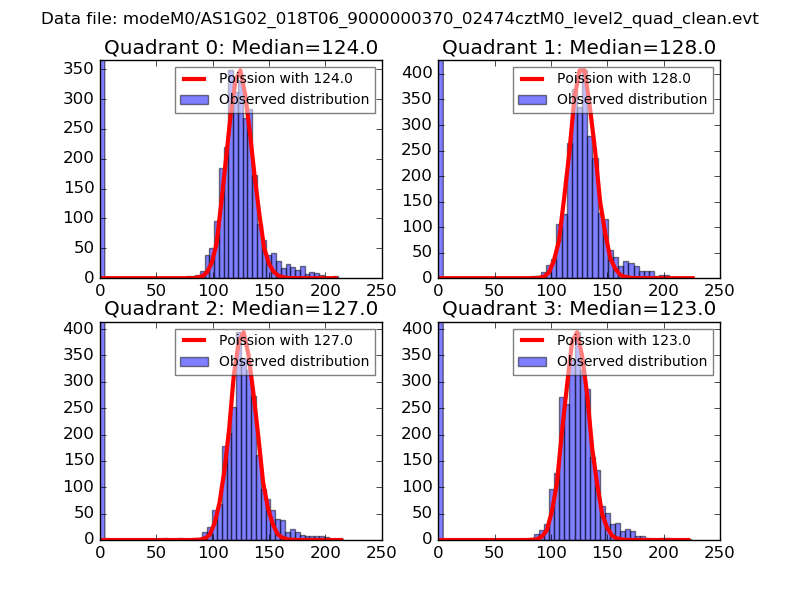 |
 |
| Quadrant-wise count rates Data is divided into 100 sec bins |
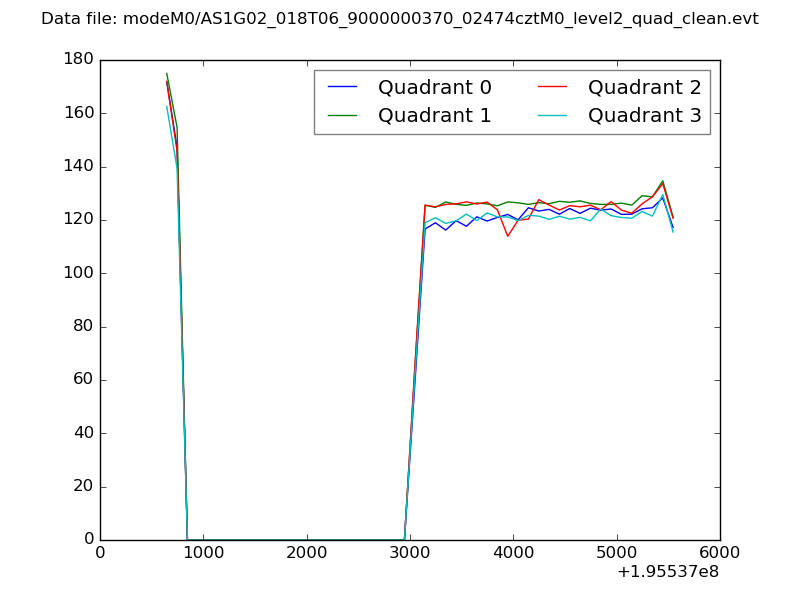 |
|
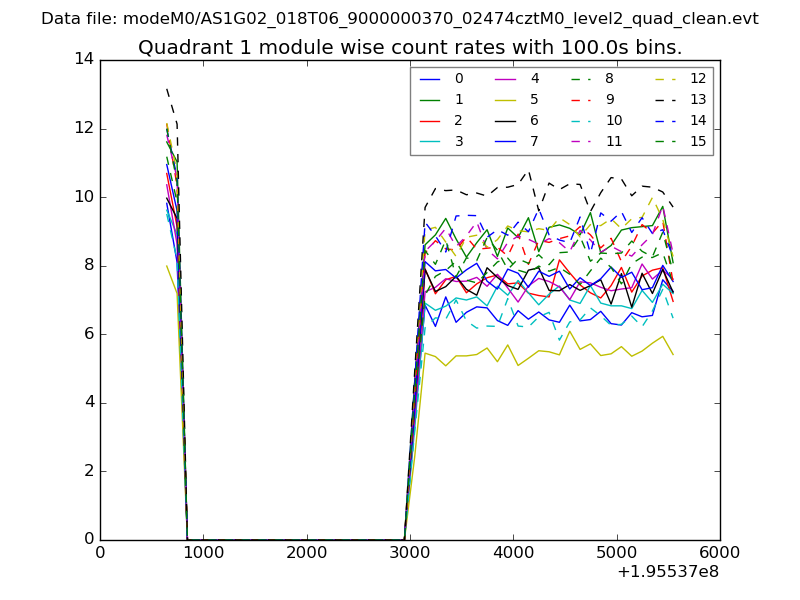
| Module-wise count rates for Quadrant A Data is divided into 100 sec bins |
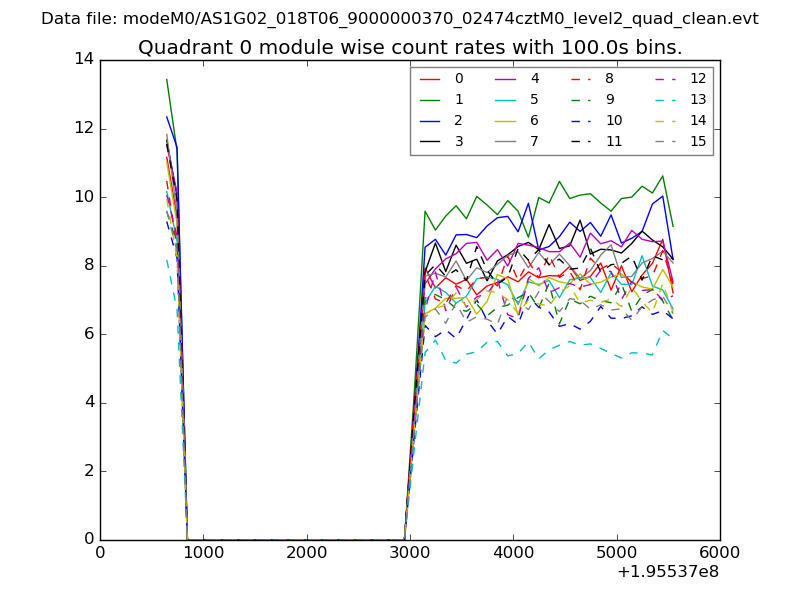 |
 |
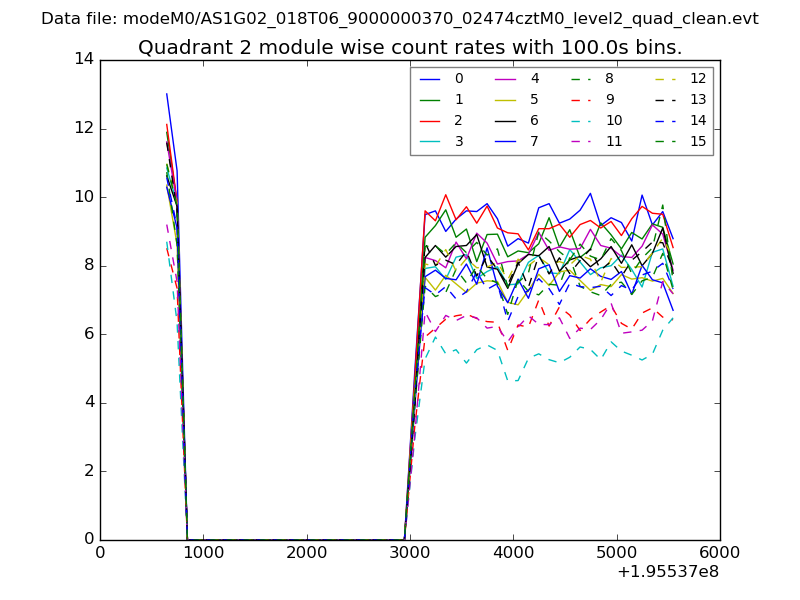
| Module-wise count rates for Quadrant B Data is divided into 100 sec bins |
 |
 |
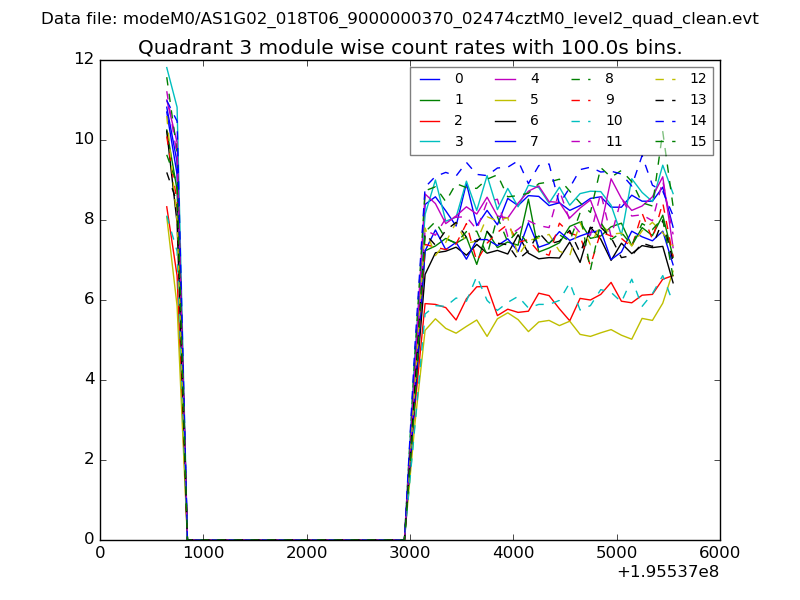
| Module-wise count rates for Quadrant C Data is divided into 100 sec bins |
 |
 |
| Module-wise count rates for Quadrant D Data is divided into 100 sec bins |
 |
 |
| Parameter | Plot |
|---|---|
| CZT HV Monitor | 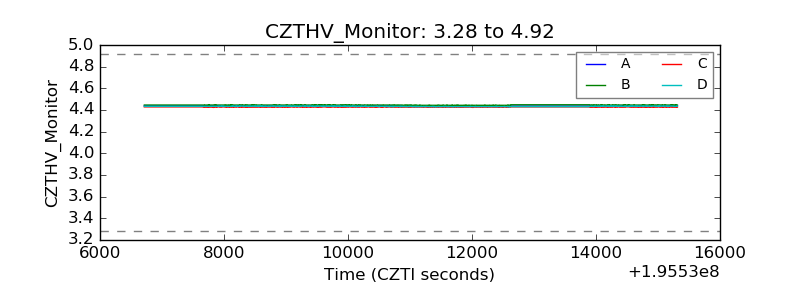 |
| D_VDD | 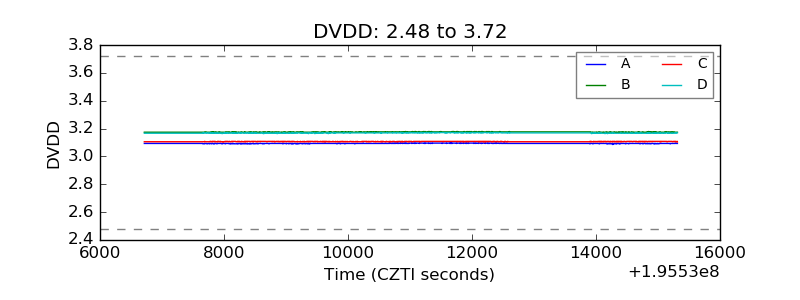 |
| Temperature 1 | 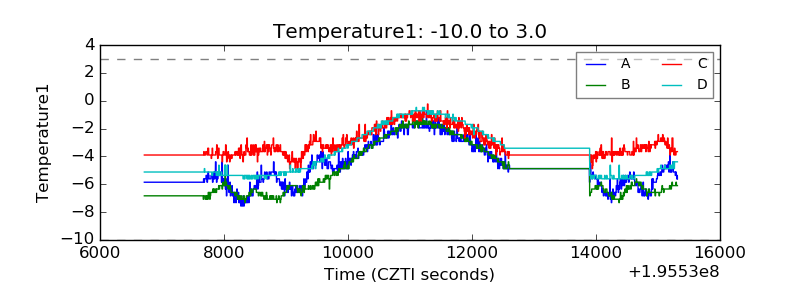 |
| Veto HV Monitor | 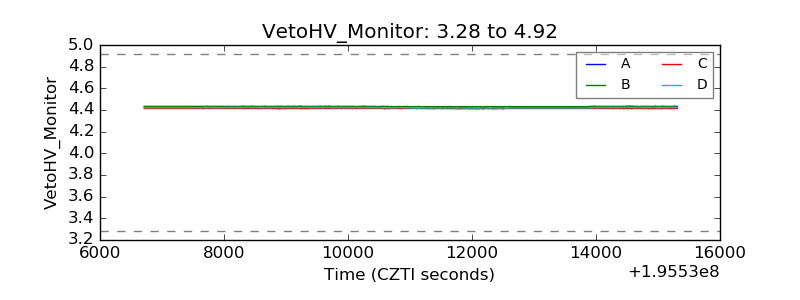 |
| Veto LLD | 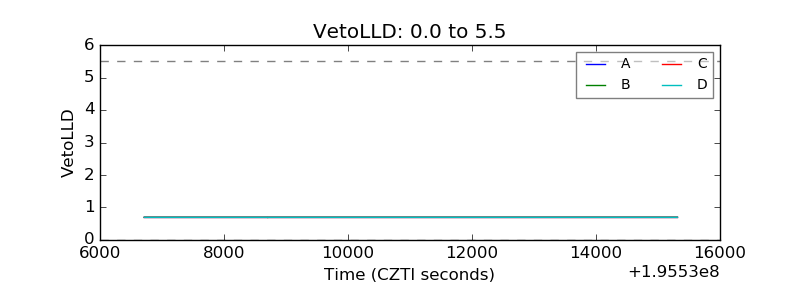 |
| Alpha Counter | 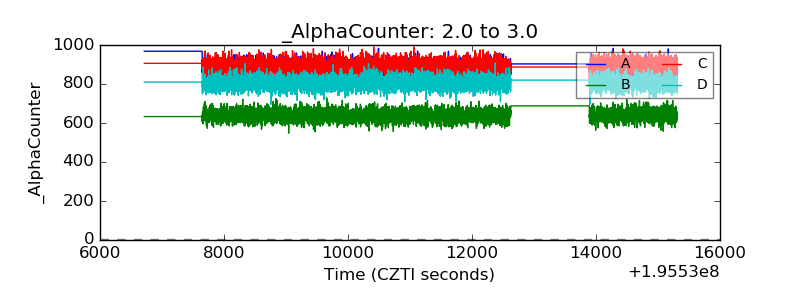 |
| _CPM_Rate | 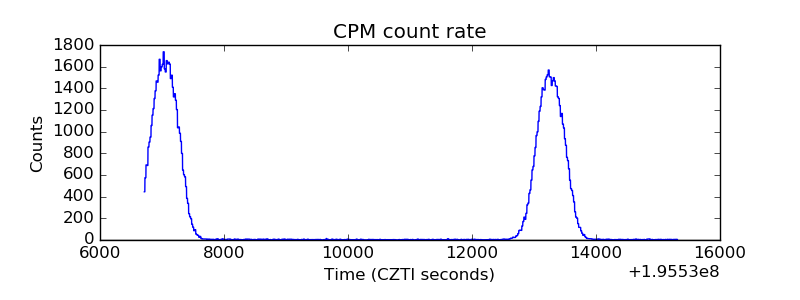 |
| CZT Counter | 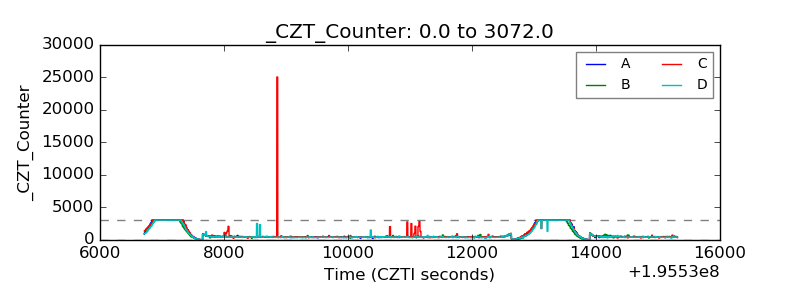 |
| +2.5 Volts monitor | 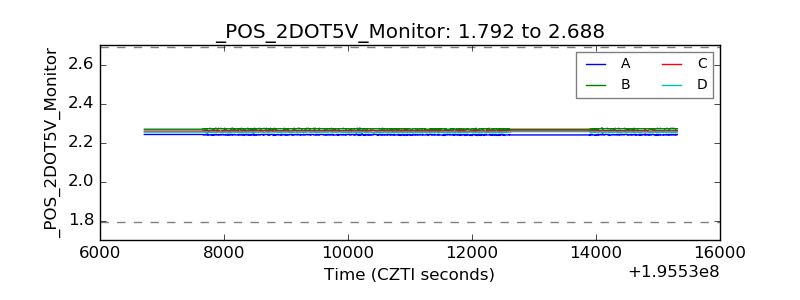 |
| +5 Volts monitor | 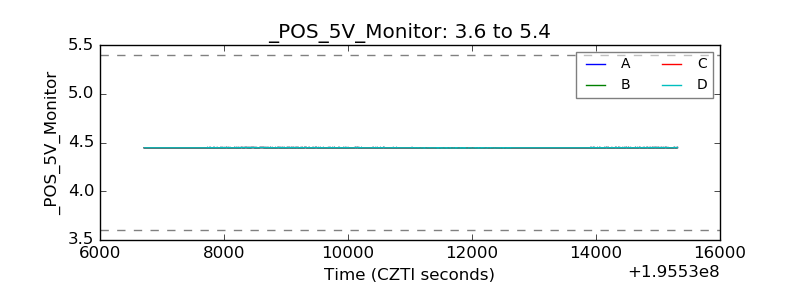 |
| _ROLL_ROT | 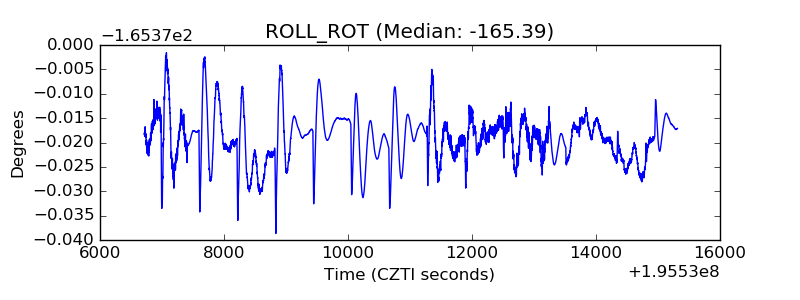 |
| _Roll_DEC | 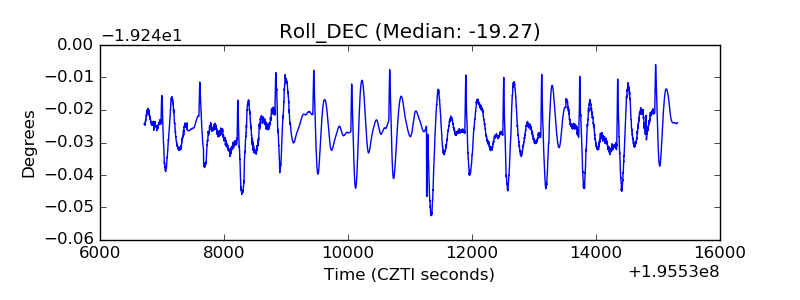 |
| _Roll_RA | 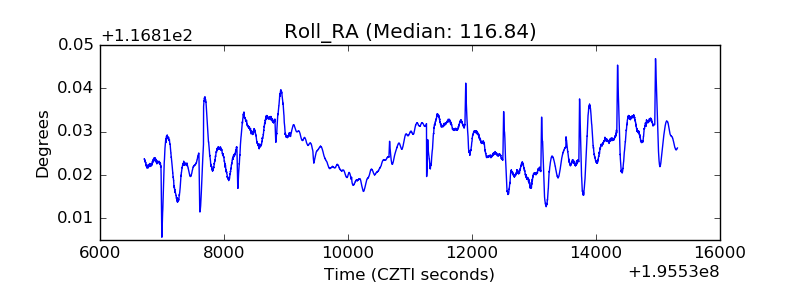 |
| Veto Counter | 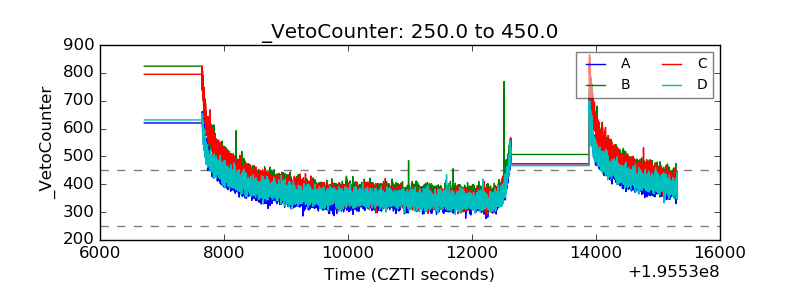 |