| Param | Original file | Final file |
|---|---|---|
| Filename | modeM0/AS1G02_018T06_9000000370_02475cztM0_level2.evt | modeM0/AS1G02_018T06_9000000370_02475cztM0_level2_quad_clean.evt |
| Size (bytes) | 413,245,440 | 63,069,120 |
| Size | 394.1 MB | 60.1 MB |
| Events in quadrant A | 3,008,728 | 364,022 |
| Events in quadrant B | 3,136,500 | 378,394 |
| Events in quadrant C | 2,971,850 | 375,324 |
| Events in quadrant D | 2,979,545 | 362,245 |
| Mode M9 | |||
|---|---|---|---|
| Quadrant | BADHDUFLAG | Total packets | Discarded packets |
| A | 0 | 17 | 0 |
| B | 0 | 17 | 0 |
| C | 0 | 17 | 0 |
| D | 0 | 18 | 0 |
| Mode SS | |||
|---|---|---|---|
| Quadrant | BADHDUFLAG | Total packets | Discarded packets |
| A | 0 | 126 | 0 |
| B | 0 | 126 | 0 |
| C | 0 | 126 | 0 |
| D | 0 | 126 | 0 |
| Mode M0 | |||
|---|---|---|---|
| Quadrant | BADHDUFLAG | Total packets | Discarded packets |
| A | 0 | 12773 | 3 |
| B | 0 | 13128 | 2 |
| C | 0 | 12765 | 2 |
| D | 0 | 13067 | 2 |
| Quadrant | Total seconds | Saturated seconds | Saturation percentage |
|---|---|---|---|
| A | 6148 | 60 | 0.975927% |
| B | 6148 | 77 | 1.252440% |
| C | 6148 | 65 | 1.057254% |
| D | 6148 | 73 | 1.187378% |
Noise dominated data is calculated using 1-second bins in cleaned event files. If a bin has >2000 counts, and if more than 50% of those come from <1% of pixels, then it is considered to be noise-dominated and hence unusable.
| Quadrant | # 1 sec bins | Bins with >0 counts | Bins with >2000 counts | High rate bins dominated by noise | Noise dominated (total time) | Noise dominated (detector-on time) | Marked lightcurve |
|---|---|---|---|---|---|---|---|
| A | 7438 | 6150 | 0 | 0 | 0.00% | 0.00% | 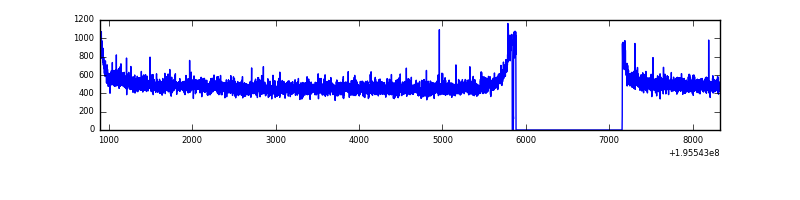 |
| B | 7438 | 6150 | 7 | 7 | 0.09% | 0.11% | 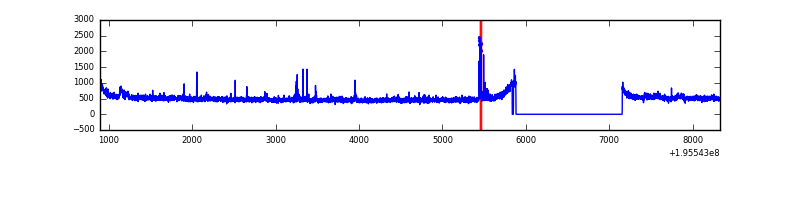 |
| C | 7438 | 6150 | 0 | 0 | 0.00% | 0.00% | 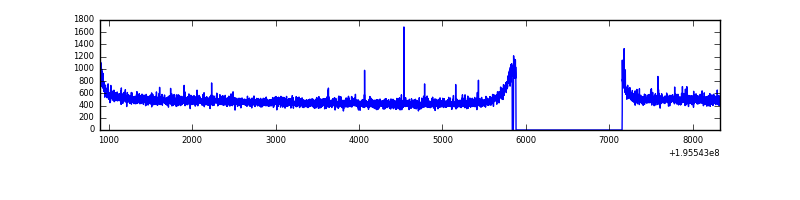 |
| D | 7438 | 6150 | 13 | 13 | 0.17% | 0.21% | 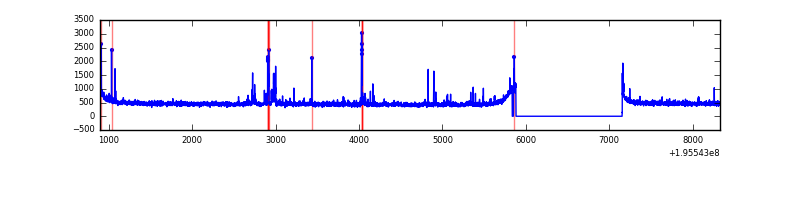 |
Top three noisy pixels from each quadrant. If the there are fewer than three noisy pixels in the level2.evt file, extra rows are filled as -1
| Pixel properties | Quadrant properties | ||||||
|---|---|---|---|---|---|---|---|
| Quadrant | DetID | PixID | Counts | Sigma | Mean | Median | Sigma |
| A | 8 | 15 | 38946 | 245.71 | 768 | 751 | 155.4 |
| A | 14 | 63 | 10695 | 63.97 | 768 | 751 | 155.4 |
| A | 12 | 194 | 8415 | 49.3 | 768 | 751 | 155.4 |
| B | 5 | 172 | 37767 | 247.5 | 785 | 766 | 149.5 |
| B | 4 | 200 | 17658 | 112.99 | 785 | 766 | 149.5 |
| B | 4 | 48 | 16831 | 107.46 | 785 | 766 | 149.5 |
| C | 13 | 61 | 6926 | 35.12 | 754 | 758 | 175.6 |
| C | 12 | 4 | 6358 | 31.89 | 754 | 758 | 175.6 |
| C | 10 | 65 | 5804 | 28.73 | 754 | 758 | 175.6 |
| D | 13 | 238 | 74637 | 421.7 | 742 | 727 | 175.3 |
| D | 5 | 172 | 31690 | 176.66 | 742 | 727 | 175.3 |
| D | 15 | 194 | 13624 | 73.58 | 742 | 727 | 175.3 |
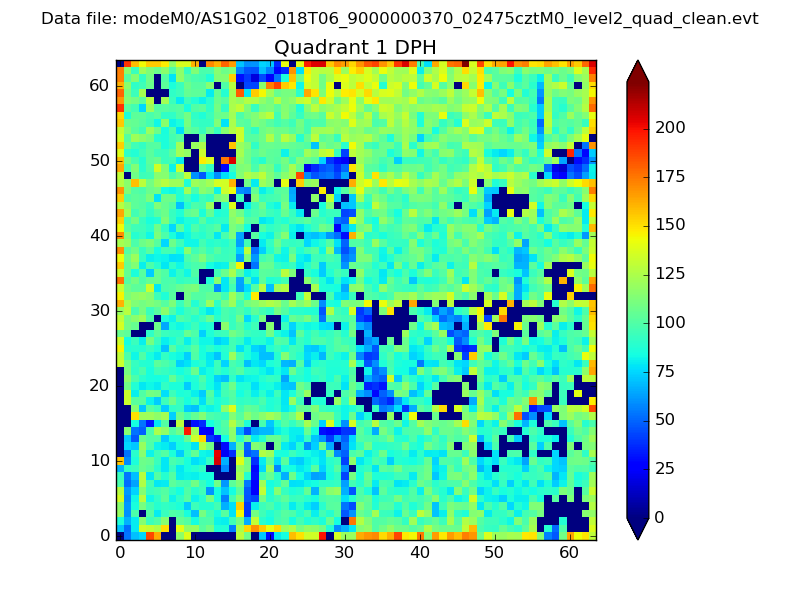
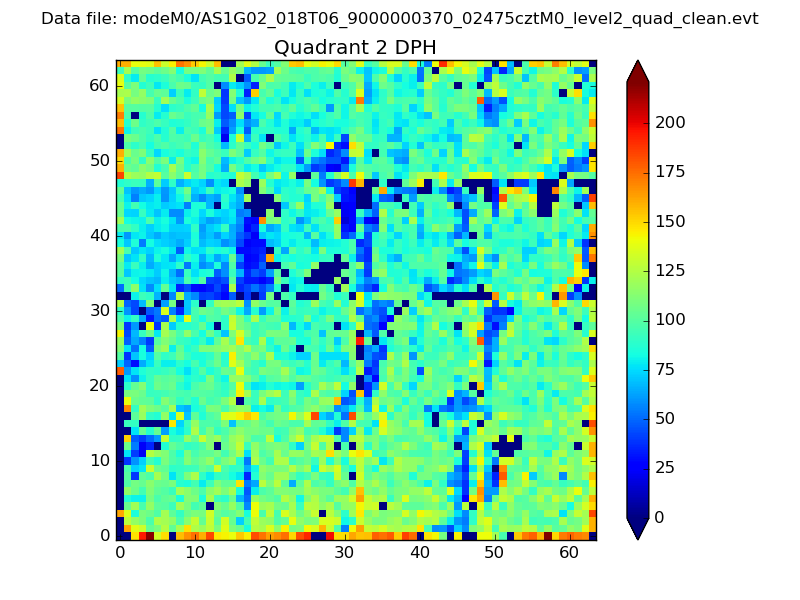
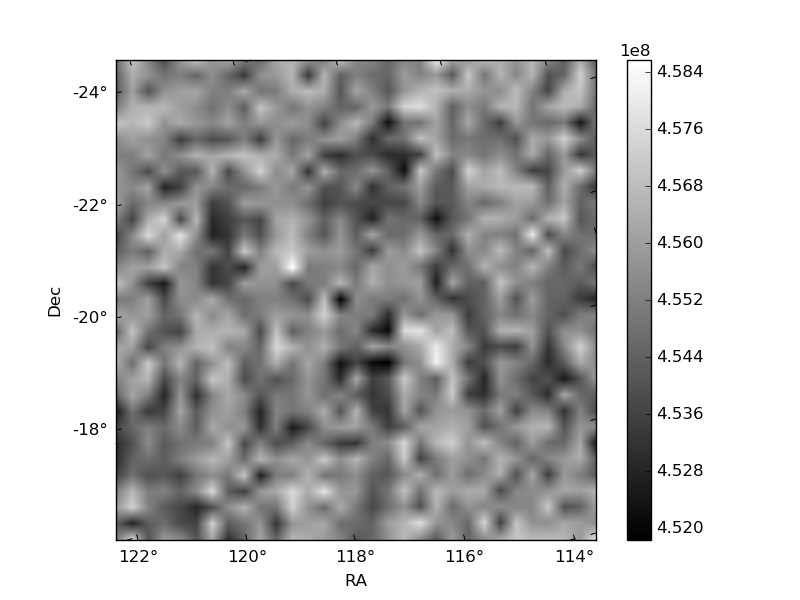
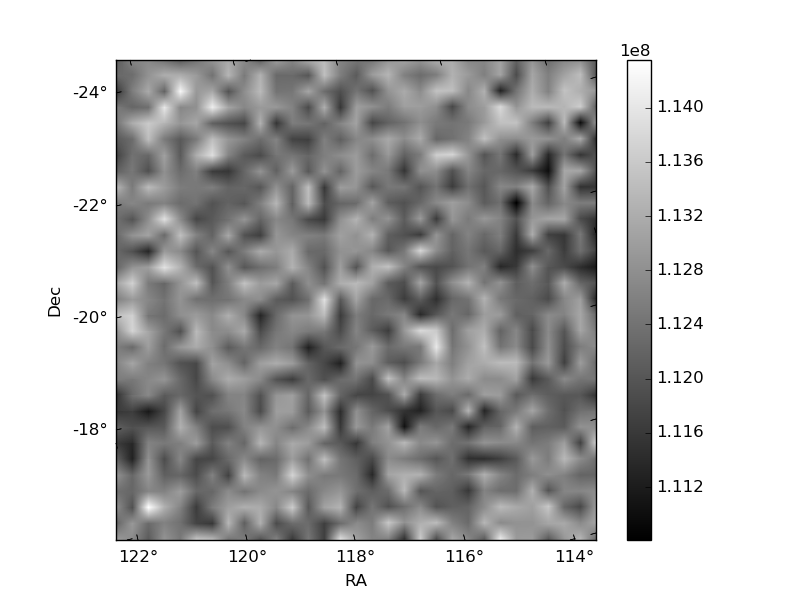
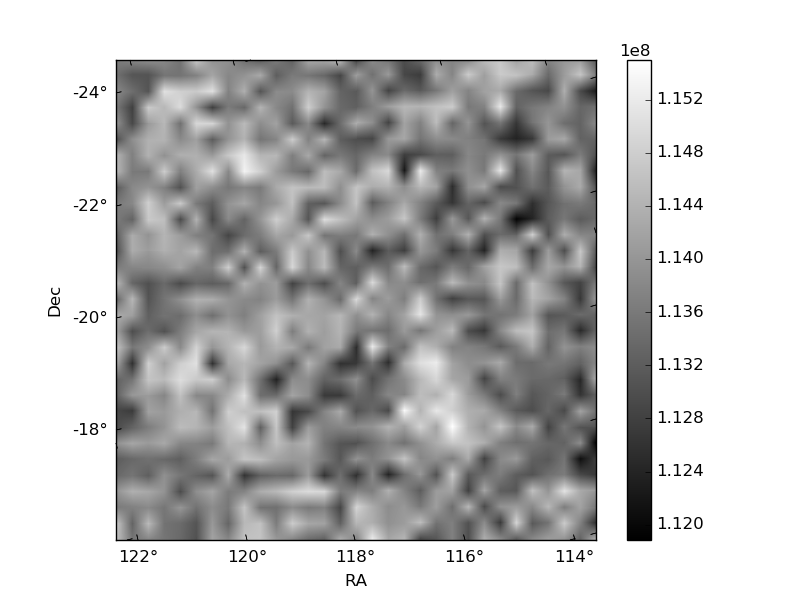
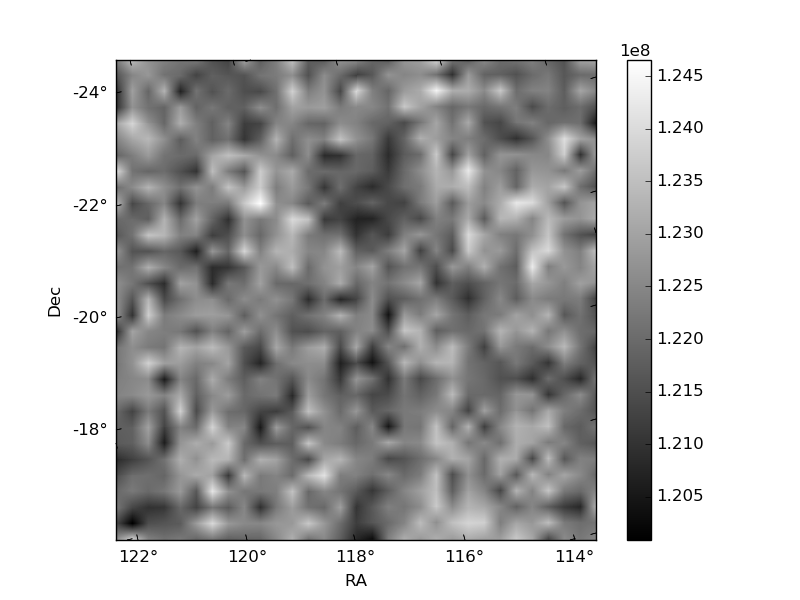
Histogram calculated using DETX and DETY for each event in the final _common_clean file
| Quadrant A |  |
 |
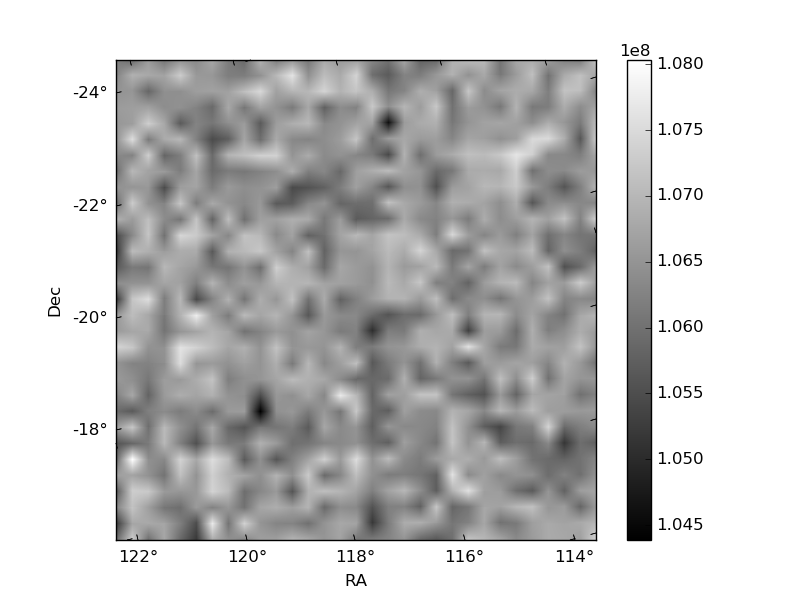
Quadrant B |
|---|---|---|---|
| Quadrant D | 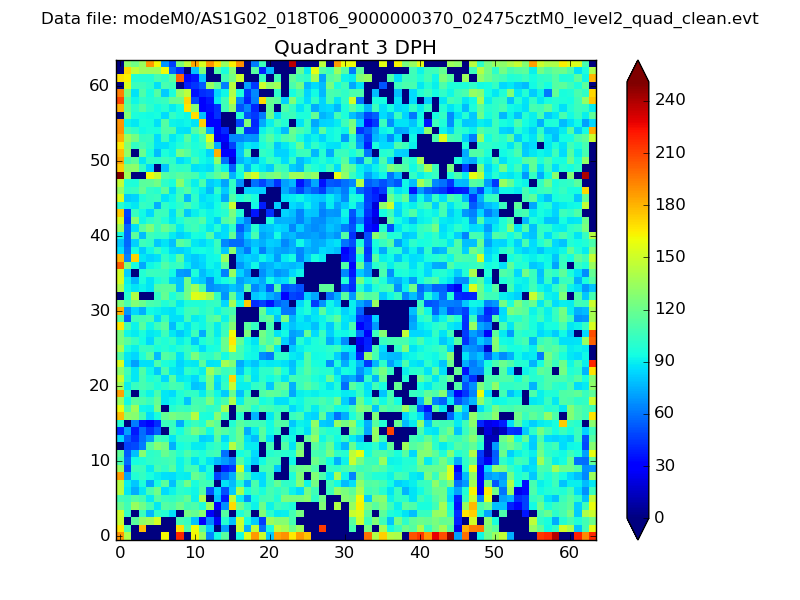 |
 |
Quadrant C |
| Plot type | Count rate plots | Images |
|---|---|---|
| Comparison with Poisson distribution Blue bars denote a histogram of data divided into 1 sec bins. Red curve is a Poisson curve with rate = median count rate of data. |
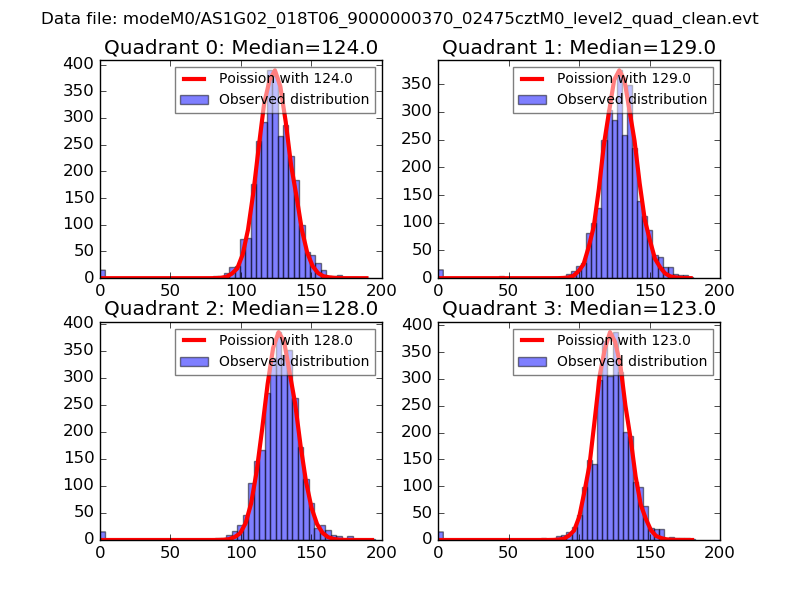 |
 |
| Quadrant-wise count rates Data is divided into 100 sec bins |
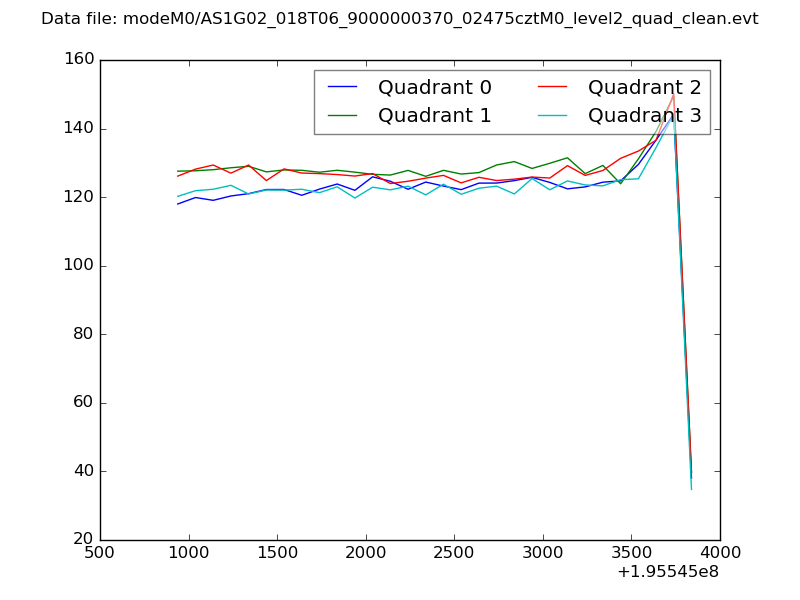 |
|
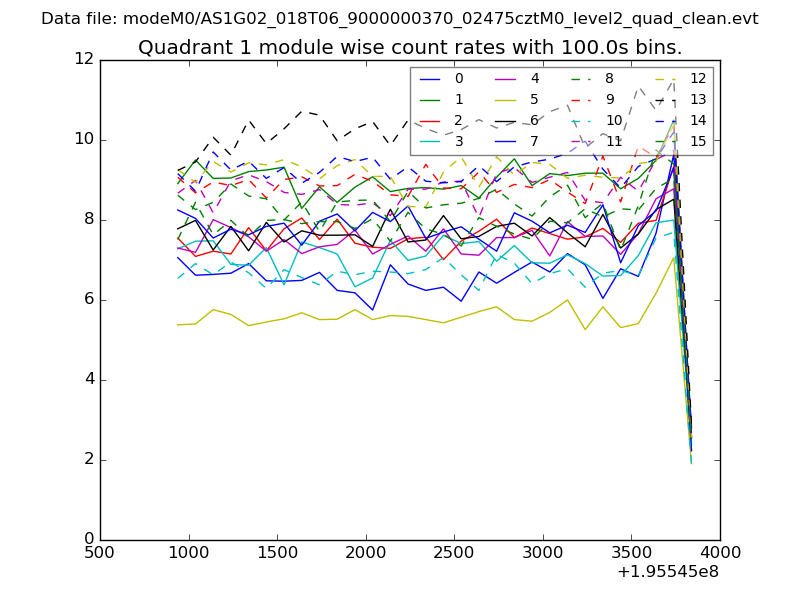
| Module-wise count rates for Quadrant A Data is divided into 100 sec bins |
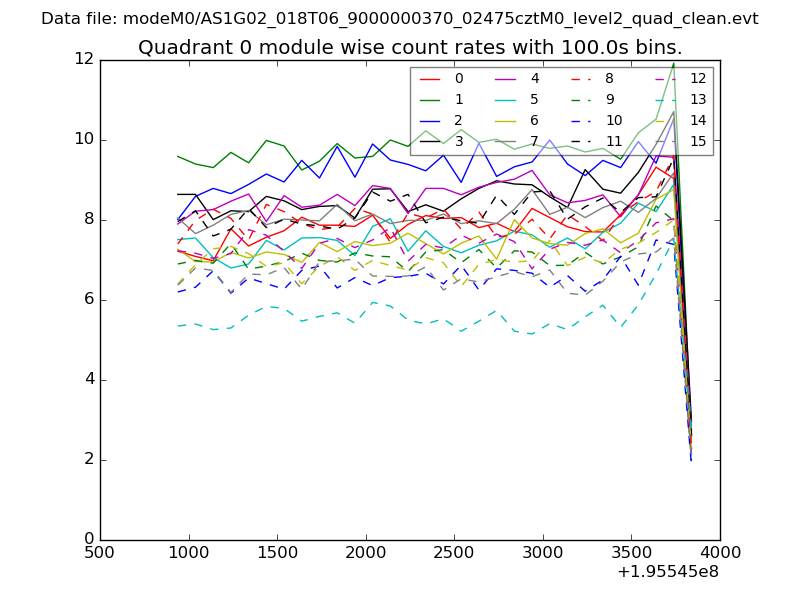 |
 |
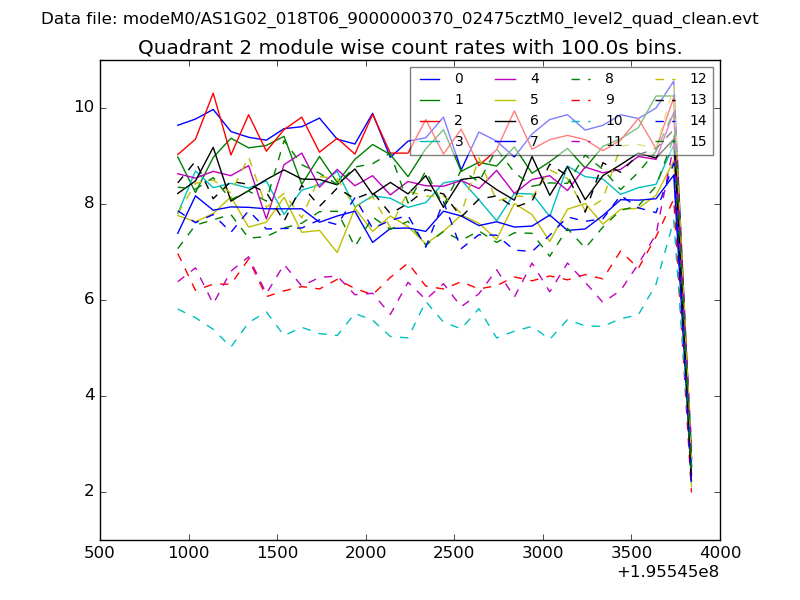
| Module-wise count rates for Quadrant B Data is divided into 100 sec bins |
 |
 |
| Module-wise count rates for Quadrant C Data is divided into 100 sec bins |
 |
 |
| Module-wise count rates for Quadrant D Data is divided into 100 sec bins |
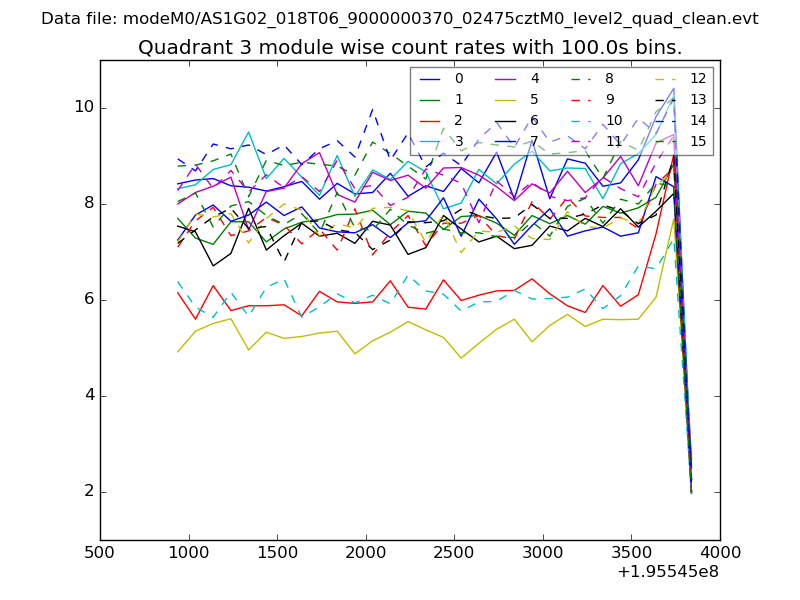 |
 |
| Parameter | Plot |
|---|---|
| CZT HV Monitor | 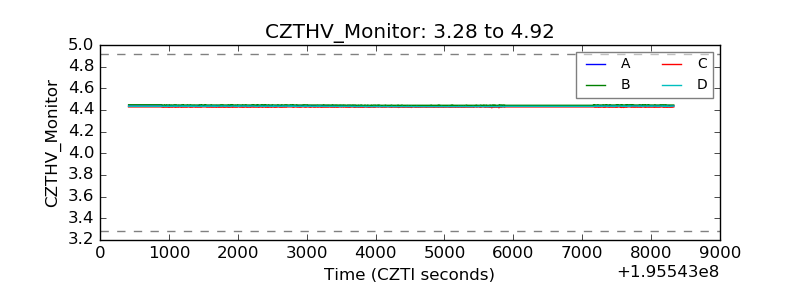 |
| D_VDD | 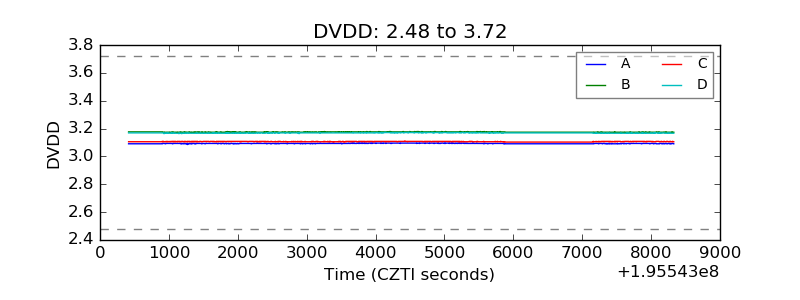 |
| Temperature 1 | 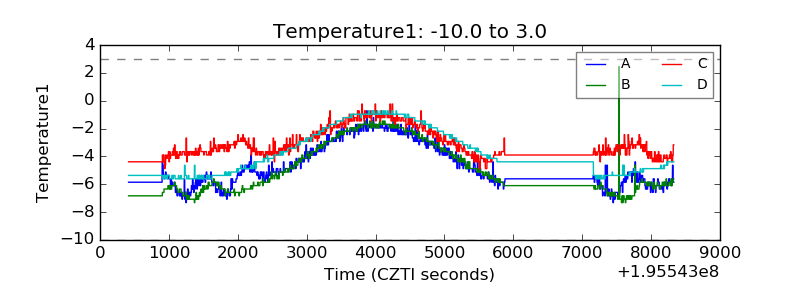 |
| Veto HV Monitor | 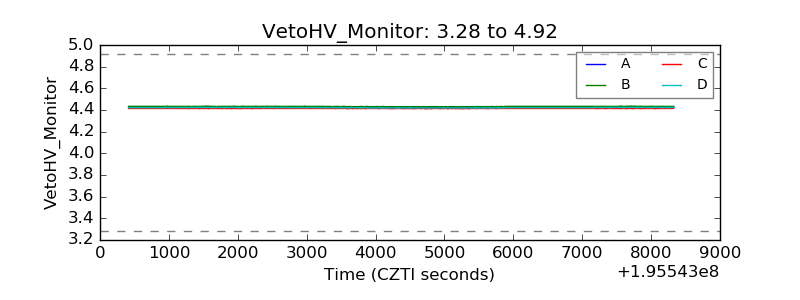 |
| Veto LLD | 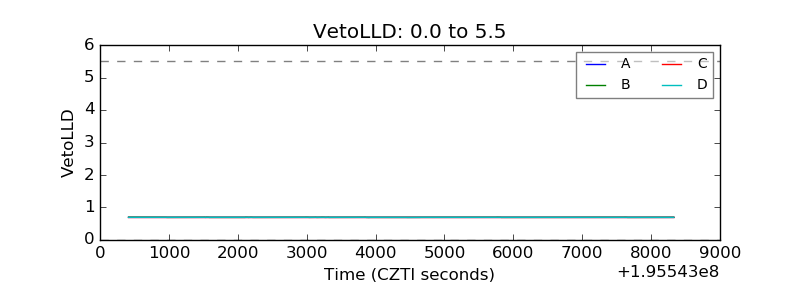 |
| Alpha Counter | 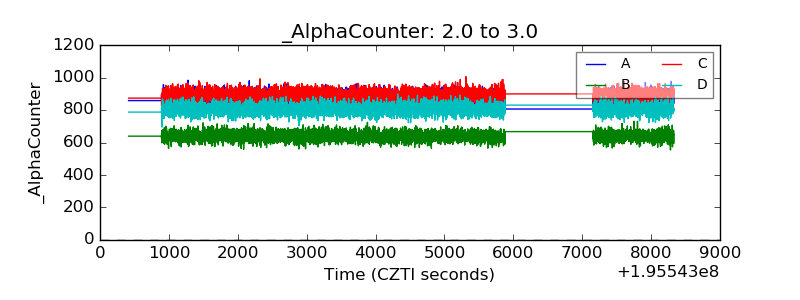 |
| _CPM_Rate | 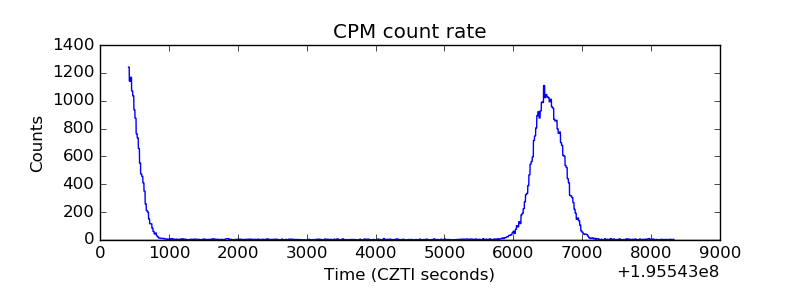 |
| CZT Counter | 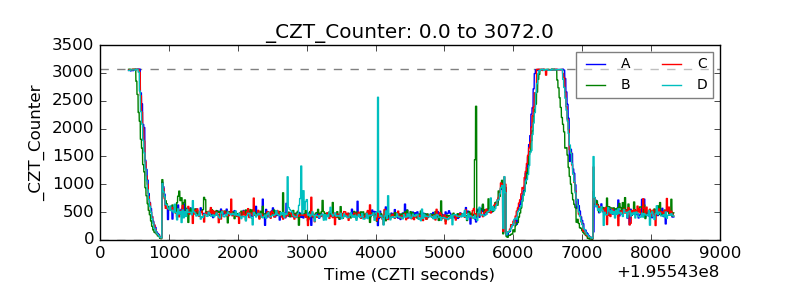 |
| +2.5 Volts monitor | 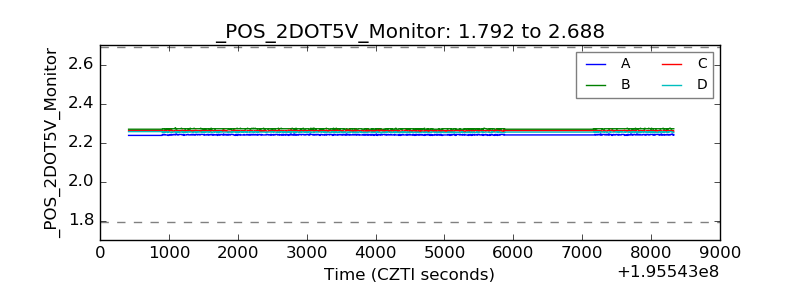 |
| +5 Volts monitor |  |
| _ROLL_ROT | 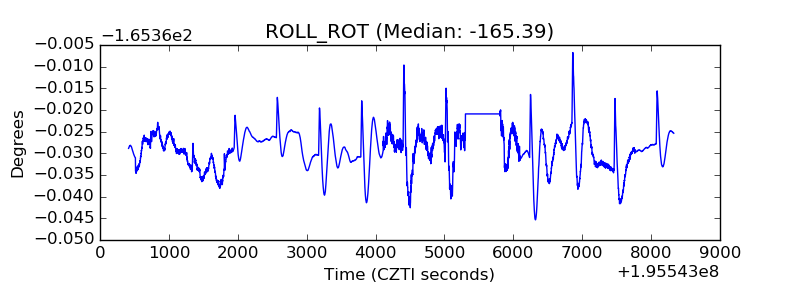 |
| _Roll_DEC |  |
| _Roll_RA | 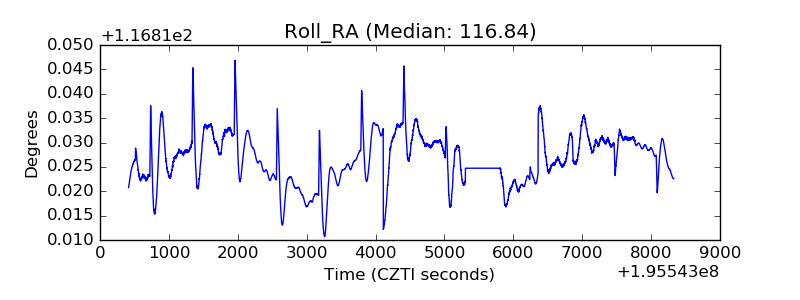 |
| Veto Counter | 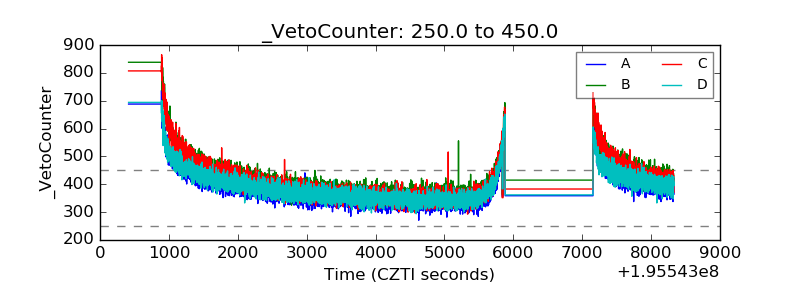 |