| Param | Original file | Final file |
|---|---|---|
| Filename | modeM0/AS1G02_018T06_9000000370_02476cztM0_level2.evt | modeM0/AS1G02_018T06_9000000370_02476cztM0_level2_quad_clean.evt |
| Size (bytes) | 460,025,280 | 72,933,120 |
| Size | 438.7 MB | 69.6 MB |
| Events in quadrant A | 3,120,421 | 438,985 |
| Events in quadrant B | 3,201,362 | 455,266 |
| Events in quadrant C | 3,105,126 | 451,134 |
| Events in quadrant D | 4,068,026 | 414,522 |
| Mode M9 | |||
|---|---|---|---|
| Quadrant | BADHDUFLAG | Total packets | Discarded packets |
| A | 0 | 25 | 0 |
| B | 0 | 25 | 0 |
| C | 0 | 25 | 0 |
| D | 0 | 25 | 0 |
| Mode SS | |||
|---|---|---|---|
| Quadrant | BADHDUFLAG | Total packets | Discarded packets |
| A | 0 | 132 | 0 |
| B | 0 | 132 | 0 |
| C | 0 | 132 | 0 |
| D | 0 | 132 | 0 |
| Mode M0 | |||
|---|---|---|---|
| Quadrant | BADHDUFLAG | Total packets | Discarded packets |
| A | 0 | 13421 | 3 |
| B | 0 | 13535 | 2 |
| C | 0 | 13469 | 2 |
| D | 0 | 16411 | 2 |
| Quadrant | Total seconds | Saturated seconds | Saturation percentage |
|---|---|---|---|
| A | 6426 | 141 | 2.194211% |
| B | 6426 | 152 | 2.365391% |
| C | 6426 | 141 | 2.194211% |
| D | 6426 | 423 | 6.582633% |
Noise dominated data is calculated using 1-second bins in cleaned event files. If a bin has >2000 counts, and if more than 50% of those come from <1% of pixels, then it is considered to be noise-dominated and hence unusable.
| Quadrant | # 1 sec bins | Bins with >0 counts | Bins with >2000 counts | High rate bins dominated by noise | Noise dominated (total time) | Noise dominated (detector-on time) | Marked lightcurve |
|---|---|---|---|---|---|---|---|
| A | 8901 | 6429 | 0 | 0 | 0.00% | 0.00% | 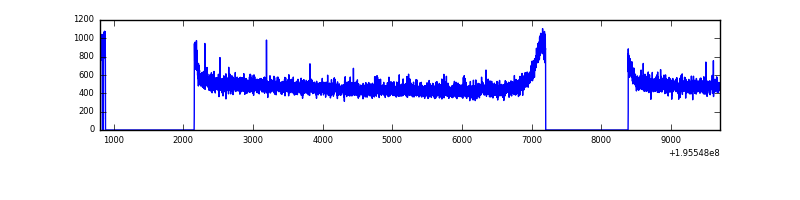 |
| B | 8901 | 6429 | 0 | 0 | 0.00% | 0.00% | 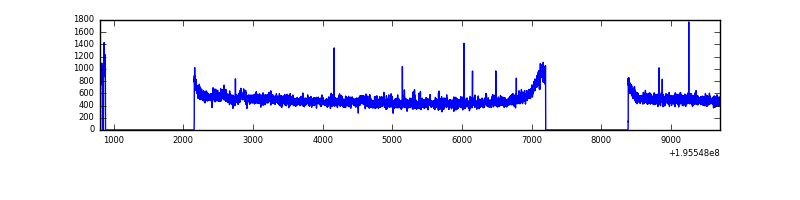 |
| C | 8901 | 6429 | 0 | 0 | 0.00% | 0.00% | 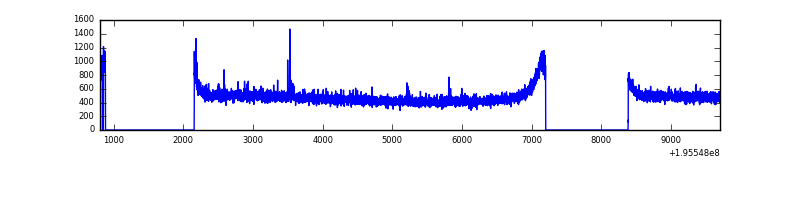 |
| D | 8901 | 6429 | 271 | 271 | 3.04% | 4.22% | 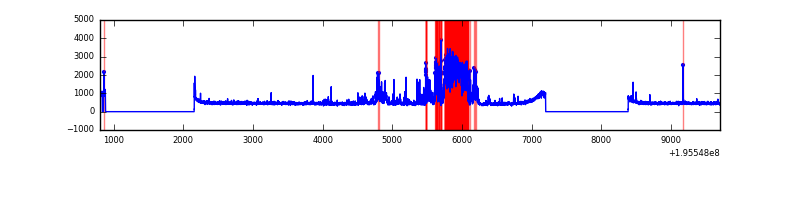 |
Top three noisy pixels from each quadrant. If the there are fewer than three noisy pixels in the level2.evt file, extra rows are filled as -1
| Pixel properties | Quadrant properties | ||||||
|---|---|---|---|---|---|---|---|
| Quadrant | DetID | PixID | Counts | Sigma | Mean | Median | Sigma |
| A | 8 | 15 | 24126 | 144.03 | 801 | 784 | 162.1 |
| A | 14 | 63 | 10464 | 59.73 | 801 | 784 | 162.1 |
| A | 12 | 194 | 9091 | 51.26 | 801 | 784 | 162.1 |
| B | 4 | 48 | 33962 | 211.09 | 816 | 796 | 157.1 |
| B | 4 | 200 | 16003 | 96.79 | 816 | 796 | 157.1 |
| B | 12 | 111 | 11471 | 67.94 | 816 | 796 | 157.1 |
| C | 10 | 65 | 14439 | 73.43 | 789 | 792 | 185.9 |
| C | 13 | 61 | 7210 | 34.53 | 789 | 792 | 185.9 |
| C | 12 | 4 | 4457 | 19.72 | 789 | 792 | 185.9 |
| D | 12 | 33 | 745106 | 4069.95 | 767 | 750 | 182.9 |
| D | 12 | 1 | 261472 | 1425.56 | 767 | 750 | 182.9 |
| D | 7 | 67 | 94084 | 510.33 | 767 | 750 | 182.9 |
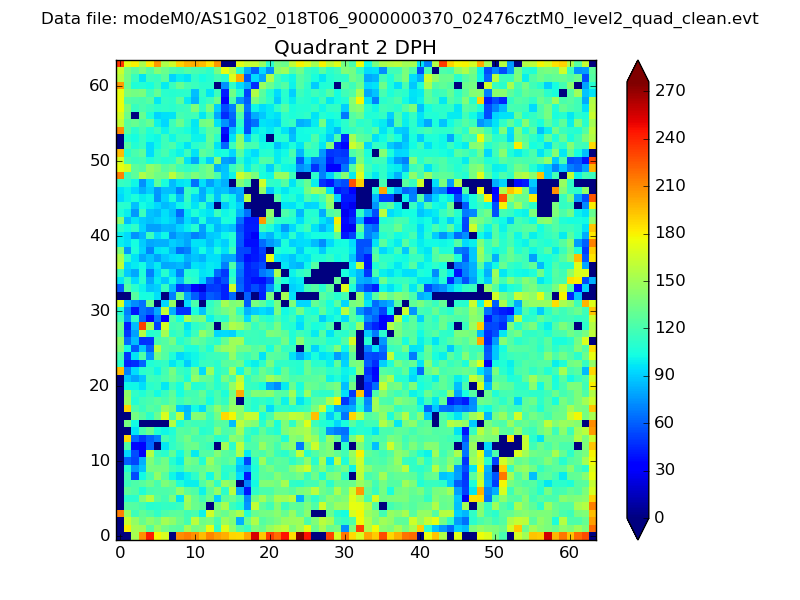
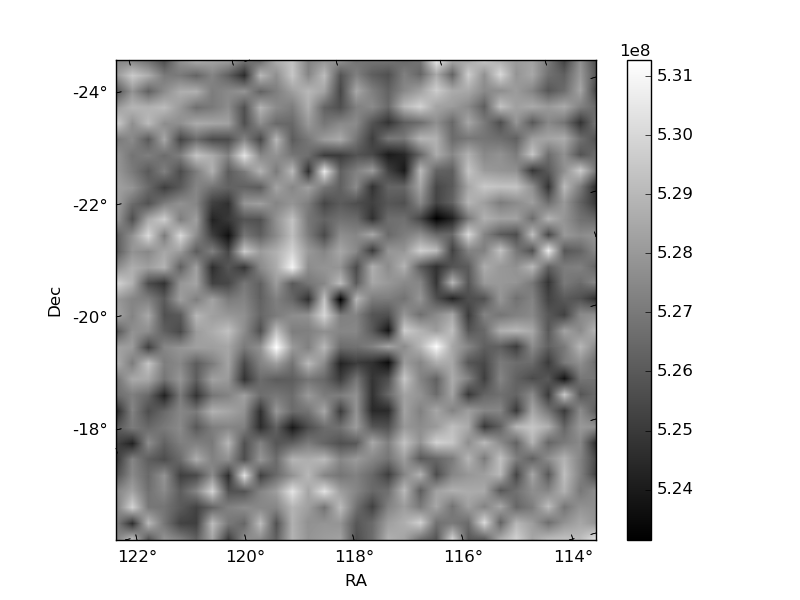
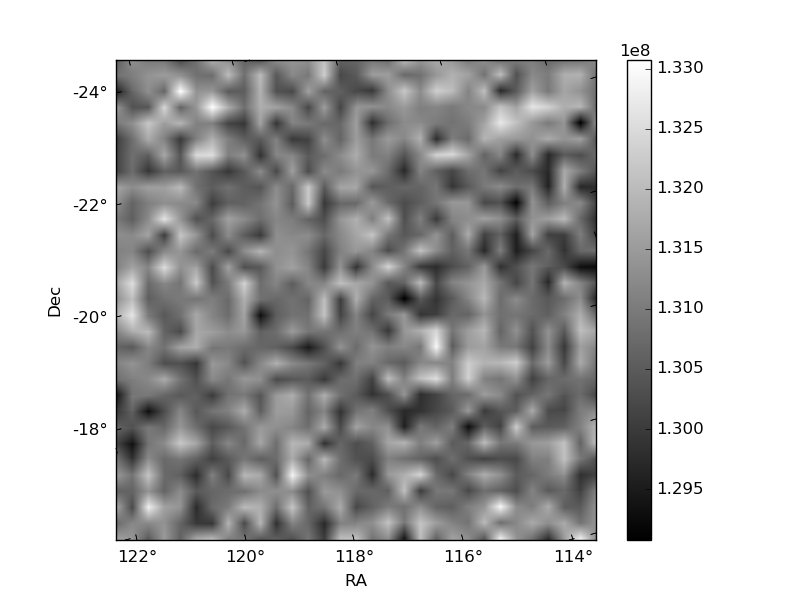
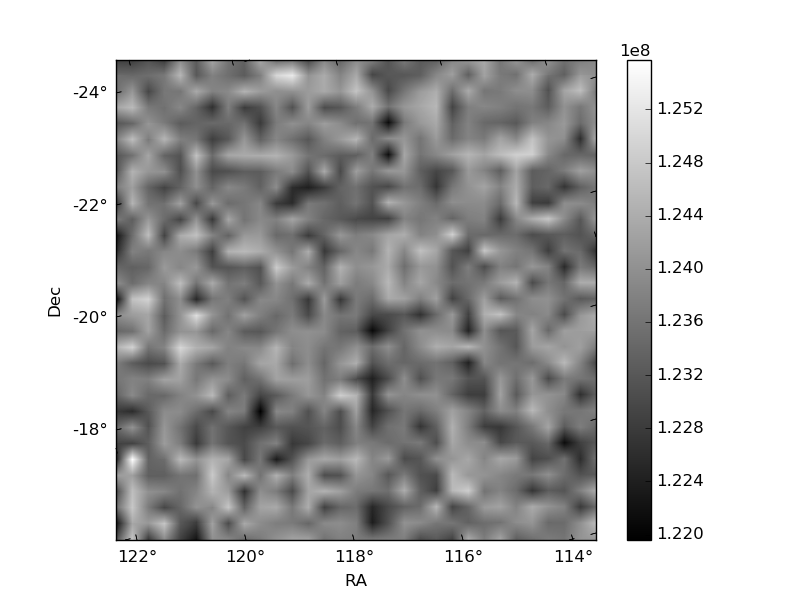
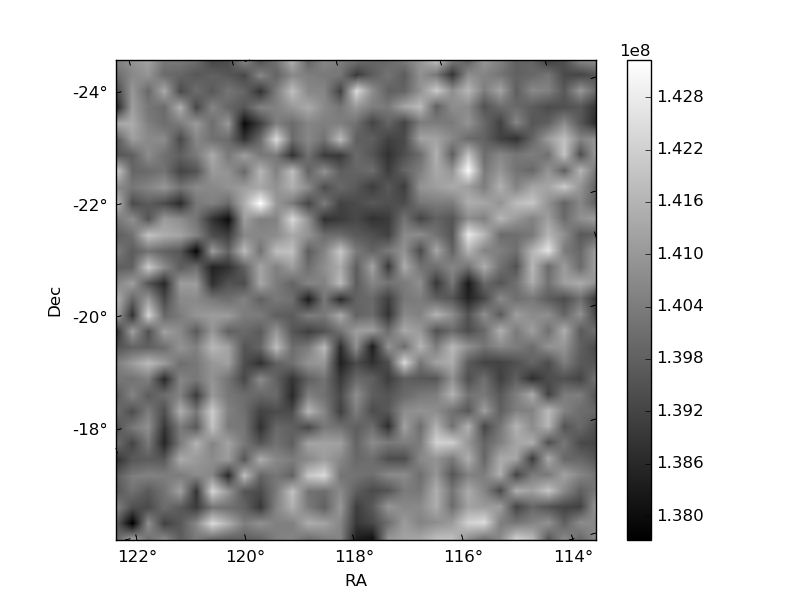
Histogram calculated using DETX and DETY for each event in the final _common_clean file
| Quadrant A | 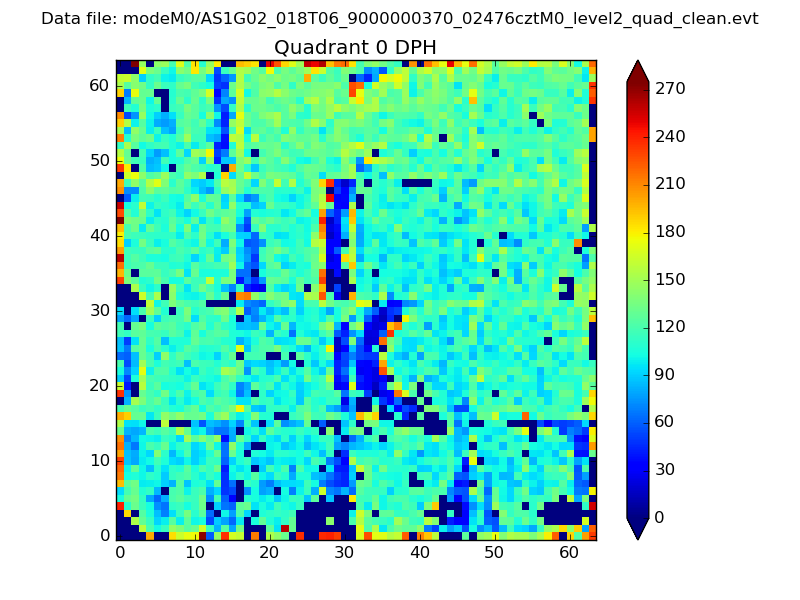 |
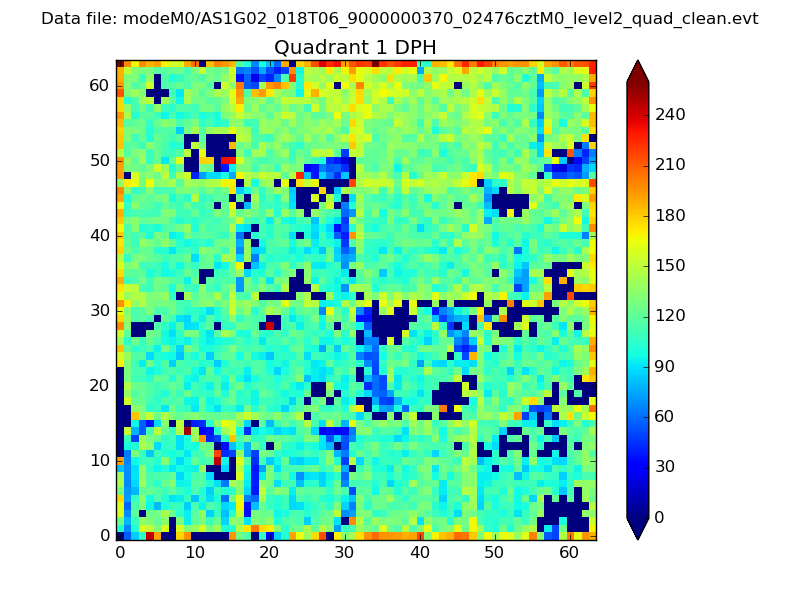 |
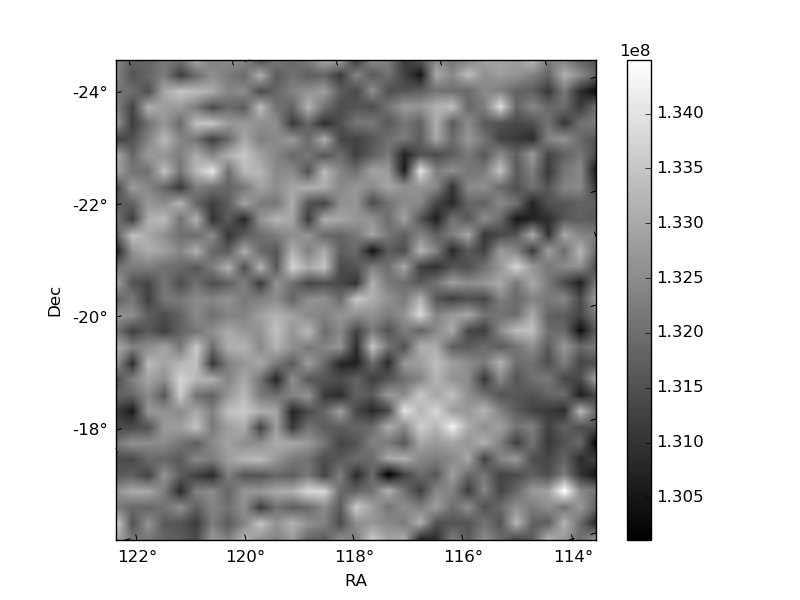
Quadrant B |
|---|---|---|---|
| Quadrant D | 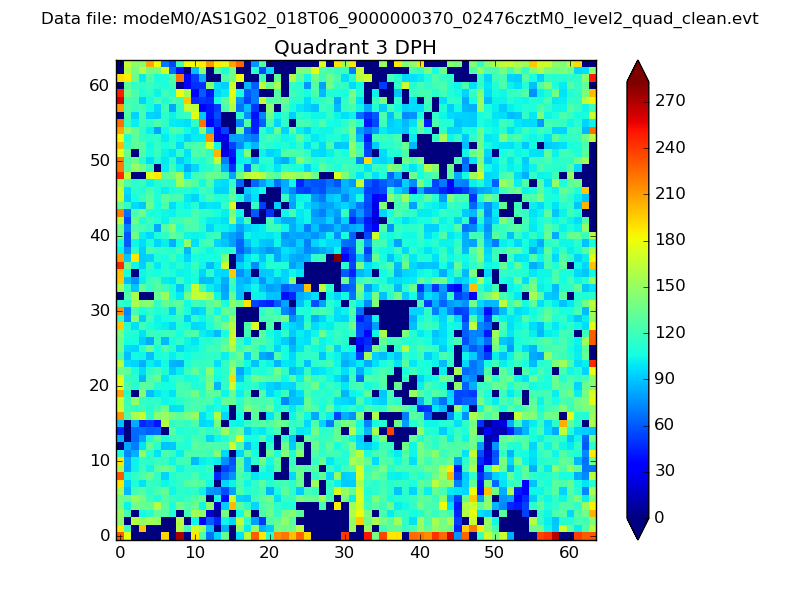 |
 |
Quadrant C |
| Plot type | Count rate plots | Images |
|---|---|---|
| Comparison with Poisson distribution Blue bars denote a histogram of data divided into 1 sec bins. Red curve is a Poisson curve with rate = median count rate of data. |
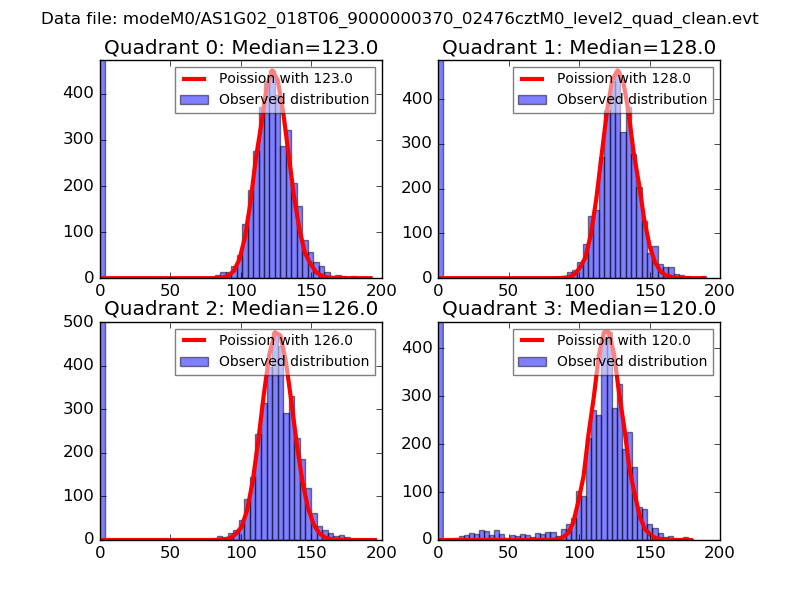 |
 |
| Quadrant-wise count rates Data is divided into 100 sec bins |
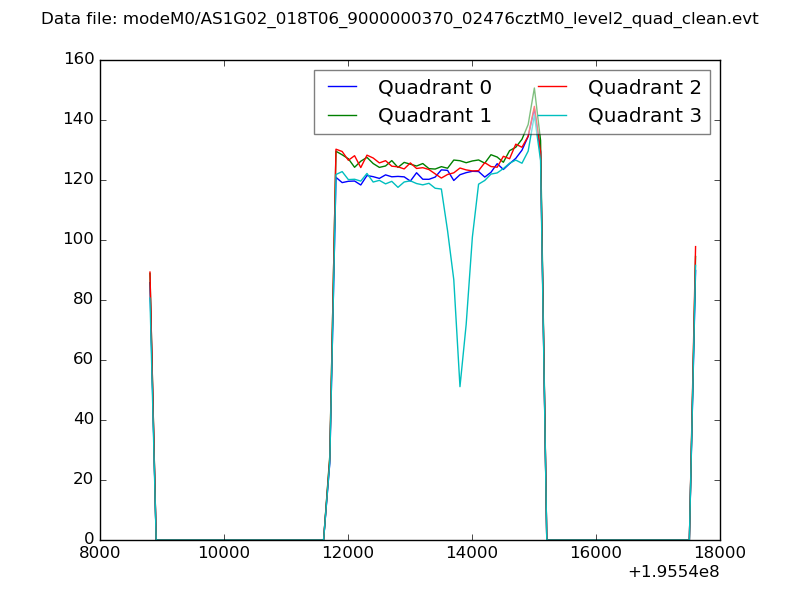 |
|
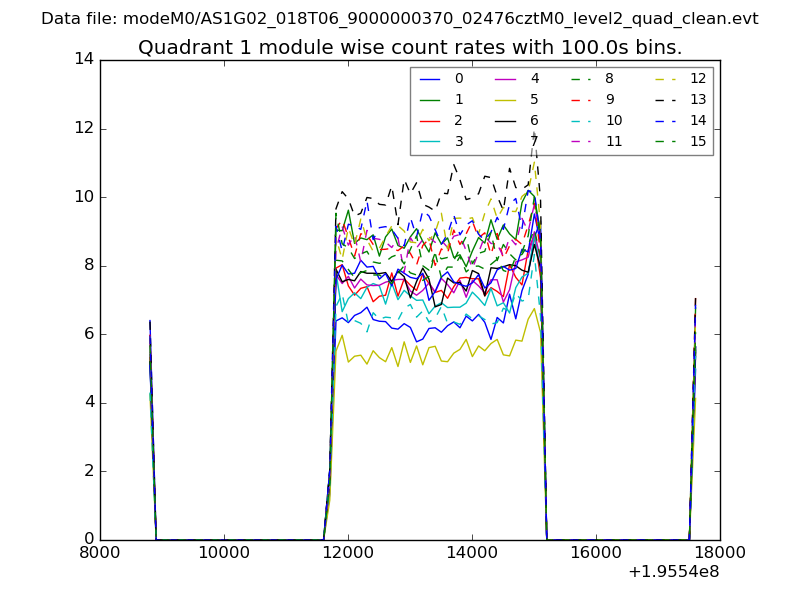
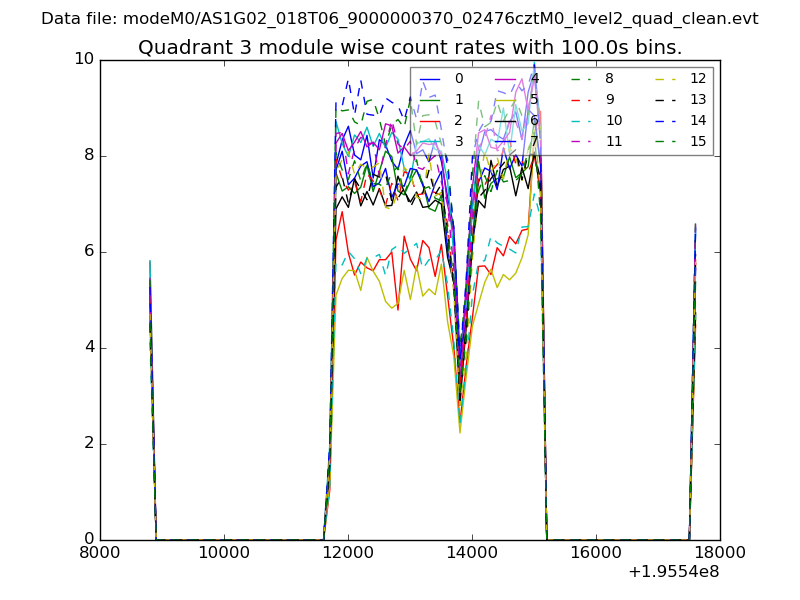
| Module-wise count rates for Quadrant A Data is divided into 100 sec bins |
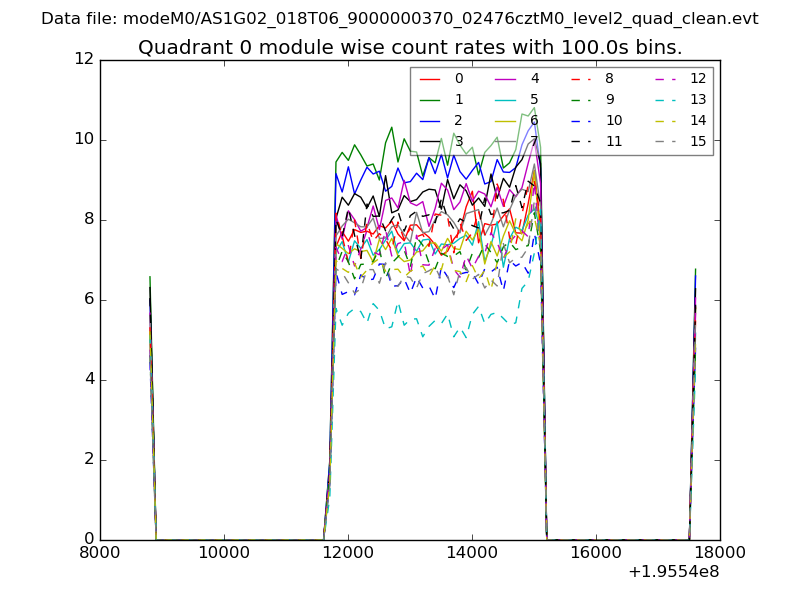 |
 |
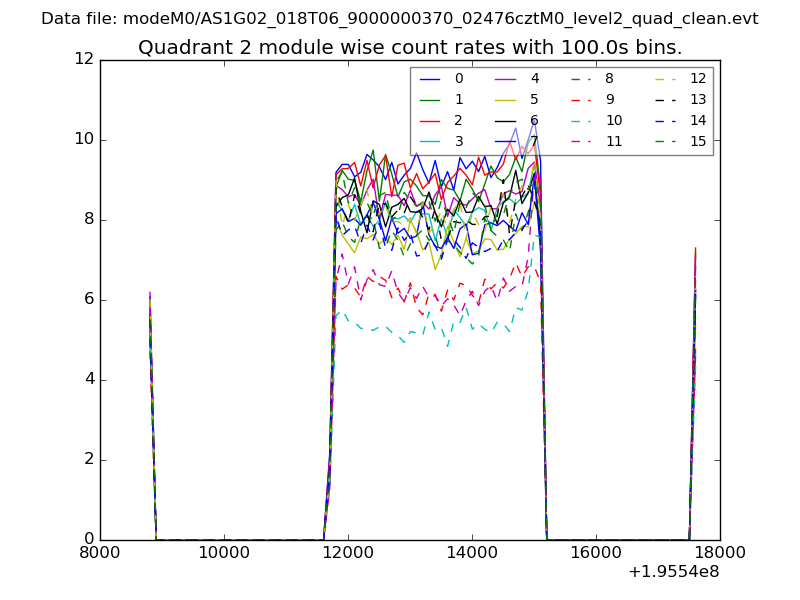
| Module-wise count rates for Quadrant B Data is divided into 100 sec bins |
 |
 |
| Module-wise count rates for Quadrant C Data is divided into 100 sec bins |
 |
 |
| Module-wise count rates for Quadrant D Data is divided into 100 sec bins |
 |
 |
| Parameter | Plot |
|---|---|
| CZT HV Monitor | 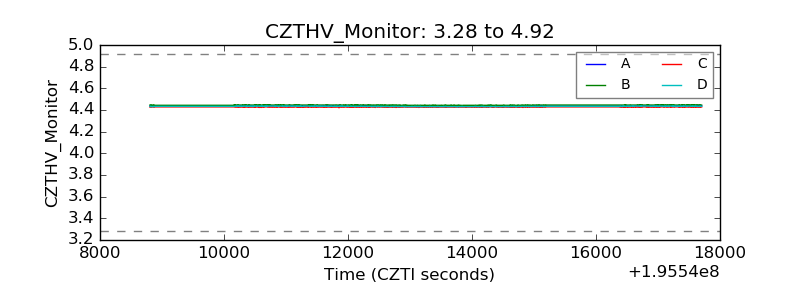 |
| D_VDD | 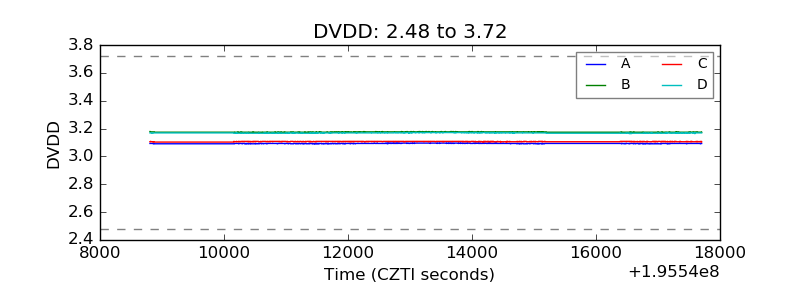 |
| Temperature 1 | 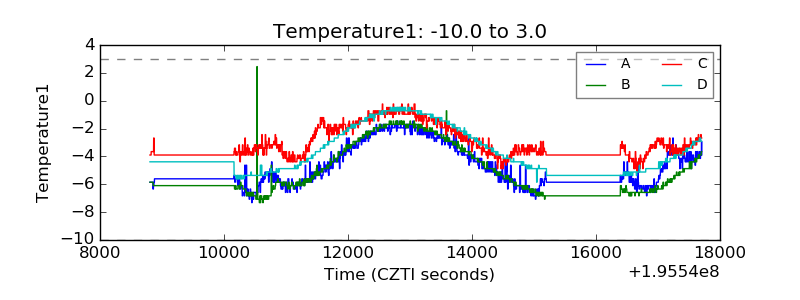 |
| Veto HV Monitor | 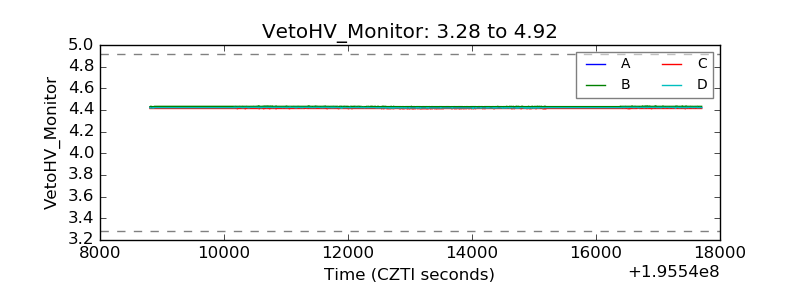 |
| Veto LLD | 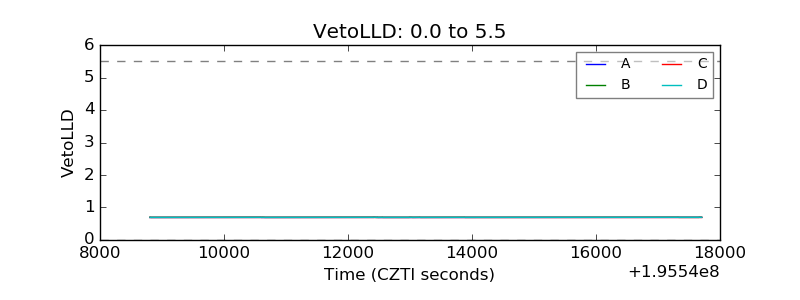 |
| Alpha Counter | 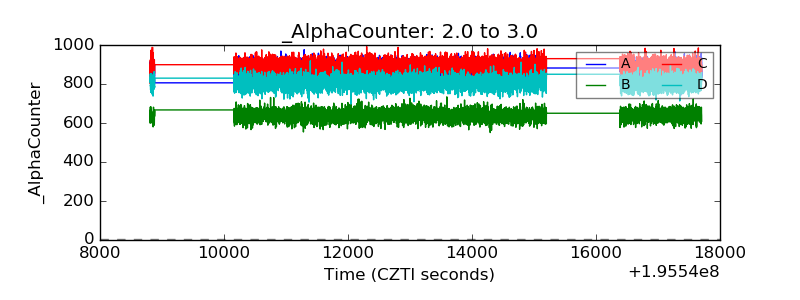 |
| _CPM_Rate | 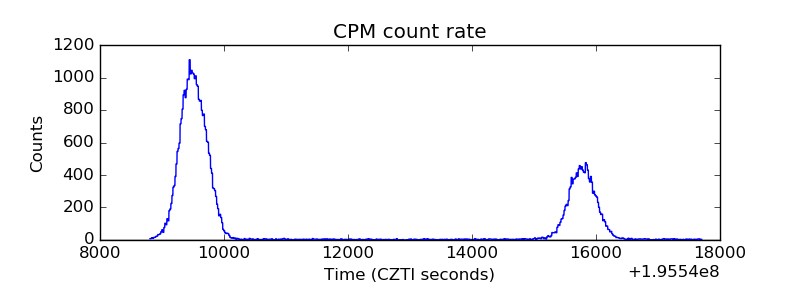 |
| CZT Counter |  |
| +2.5 Volts monitor | 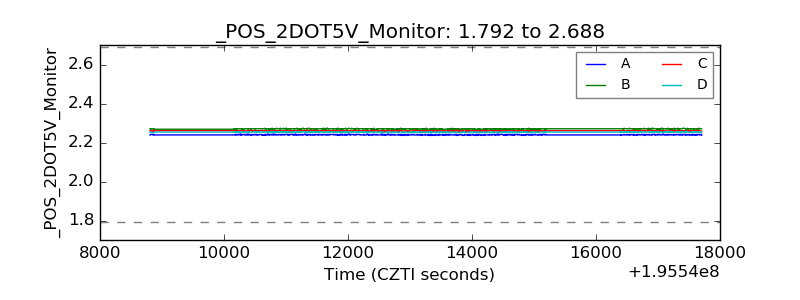 |
| +5 Volts monitor | 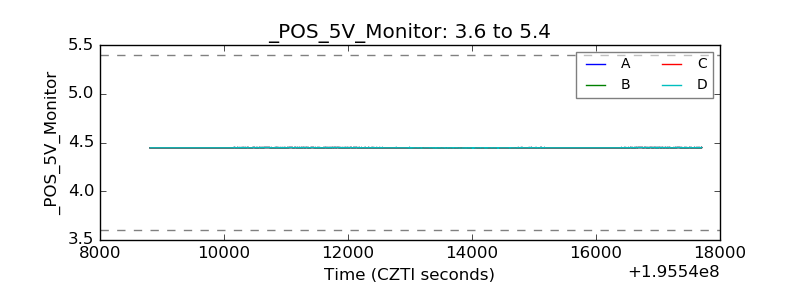 |
| _ROLL_ROT | 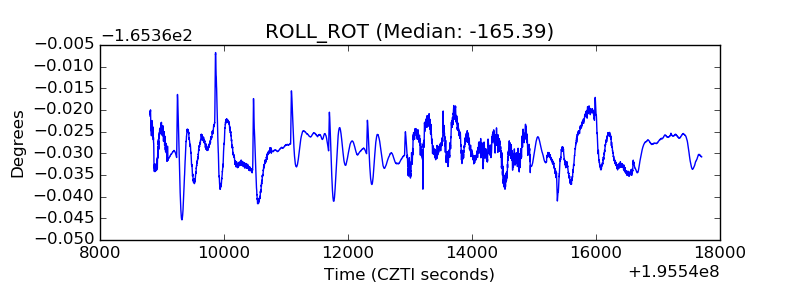 |
| _Roll_DEC | 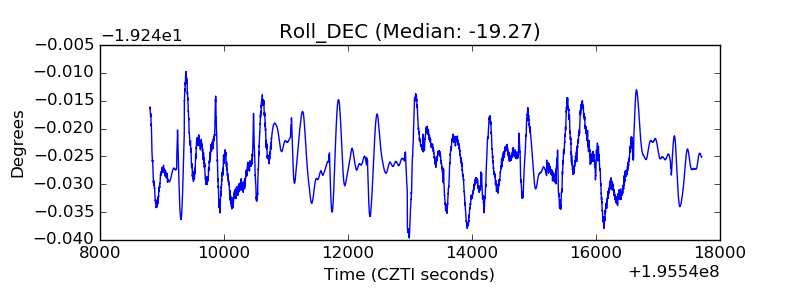 |
| _Roll_RA | 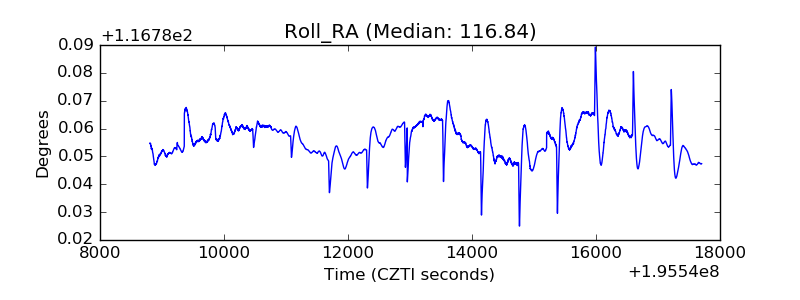 |
| Veto Counter | 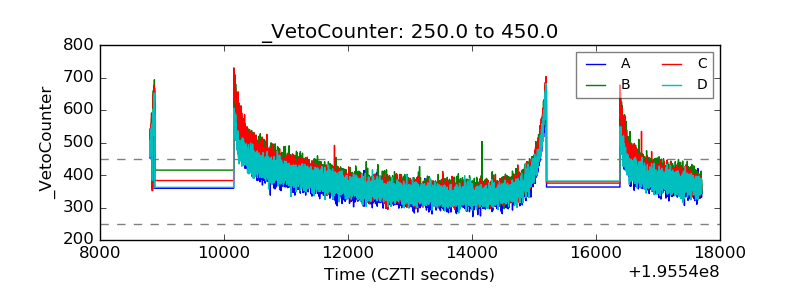 |