| Param | Original file | Final file |
|---|---|---|
| Filename | modeM0/AS1G02_018T06_9000000370_02477cztM0_level2.evt | modeM0/AS1G02_018T06_9000000370_02477cztM0_level2_quad_clean.evt |
| Size (bytes) | 423,282,240 | 80,501,760 |
| Size | 403.7 MB | 76.8 MB |
| Events in quadrant A | 3,087,638 | 486,946 |
| Events in quadrant B | 3,172,749 | 503,526 |
| Events in quadrant C | 3,051,648 | 499,244 |
| Events in quadrant D | 3,054,618 | 484,344 |
| Mode M9 | |||
|---|---|---|---|
| Quadrant | BADHDUFLAG | Total packets | Discarded packets |
| A | 0 | 13 | 0 |
| B | 0 | 13 | 0 |
| C | 0 | 13 | 0 |
| D | 0 | 14 | 0 |
| Mode SS | |||
|---|---|---|---|
| Quadrant | BADHDUFLAG | Total packets | Discarded packets |
| A | 0 | 138 | 0 |
| B | 0 | 138 | 0 |
| C | 0 | 138 | 0 |
| D | 0 | 138 | 0 |
| Mode M0 | |||
|---|---|---|---|
| Quadrant | BADHDUFLAG | Total packets | Discarded packets |
| A | 0 | 13654 | 3 |
| B | 0 | 13762 | 2 |
| C | 0 | 13639 | 2 |
| D | 0 | 13829 | 2 |
| Quadrant | Total seconds | Saturated seconds | Saturation percentage |
|---|---|---|---|
| A | 6640 | 95 | 1.430723% |
| B | 6640 | 105 | 1.581325% |
| C | 6640 | 63 | 0.948795% |
| D | 6640 | 74 | 1.114458% |
Noise dominated data is calculated using 1-second bins in cleaned event files. If a bin has >2000 counts, and if more than 50% of those come from <1% of pixels, then it is considered to be noise-dominated and hence unusable.
| Quadrant | # 1 sec bins | Bins with >0 counts | Bins with >2000 counts | High rate bins dominated by noise | Noise dominated (total time) | Noise dominated (detector-on time) | Marked lightcurve |
|---|---|---|---|---|---|---|---|
| A | 7630 | 6641 | 0 | 0 | 0.00% | 0.00% | 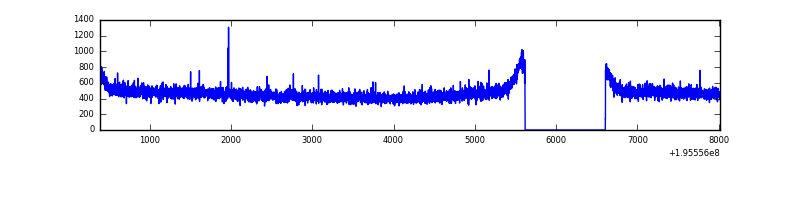 |
| B | 7630 | 6641 | 0 | 0 | 0.00% | 0.00% | 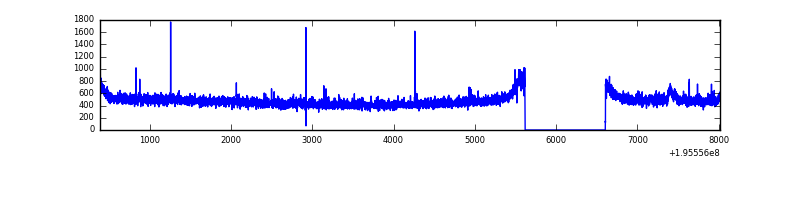 |
| C | 7630 | 6641 | 0 | 0 | 0.00% | 0.00% | 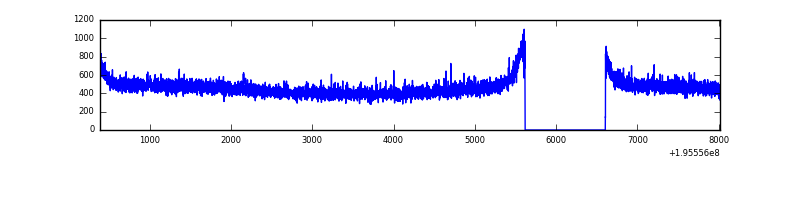 |
| D | 7630 | 6641 | 4 | 4 | 0.05% | 0.06% | 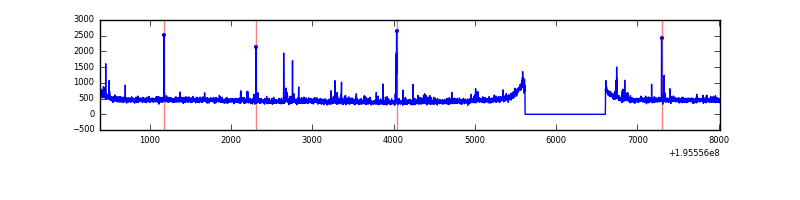 |
Top three noisy pixels from each quadrant. If the there are fewer than three noisy pixels in the level2.evt file, extra rows are filled as -1
| Pixel properties | Quadrant properties | ||||||
|---|---|---|---|---|---|---|---|
| Quadrant | DetID | PixID | Counts | Sigma | Mean | Median | Sigma |
| A | 14 | 63 | 10963 | 62.67 | 797 | 777 | 162.5 |
| A | 12 | 194 | 9090 | 51.15 | 797 | 777 | 162.5 |
| A | 0 | 226 | 8474 | 47.36 | 797 | 777 | 162.5 |
| B | 4 | 48 | 25018 | 154.81 | 810 | 790 | 156.5 |
| B | 4 | 200 | 15547 | 94.29 | 810 | 790 | 156.5 |
| B | 12 | 111 | 11357 | 67.52 | 810 | 790 | 156.5 |
| C | 13 | 61 | 6986 | 34.16 | 778 | 783 | 181.6 |
| C | 10 | 65 | 4575 | 20.88 | 778 | 783 | 181.6 |
| C | 12 | 4 | 3127 | 12.91 | 778 | 783 | 181.6 |
| D | 7 | 67 | 55054 | 296.64 | 771 | 753 | 183.1 |
| D | 12 | 1 | 17109 | 89.35 | 771 | 753 | 183.1 |
| D | 5 | 172 | 15981 | 83.19 | 771 | 753 | 183.1 |
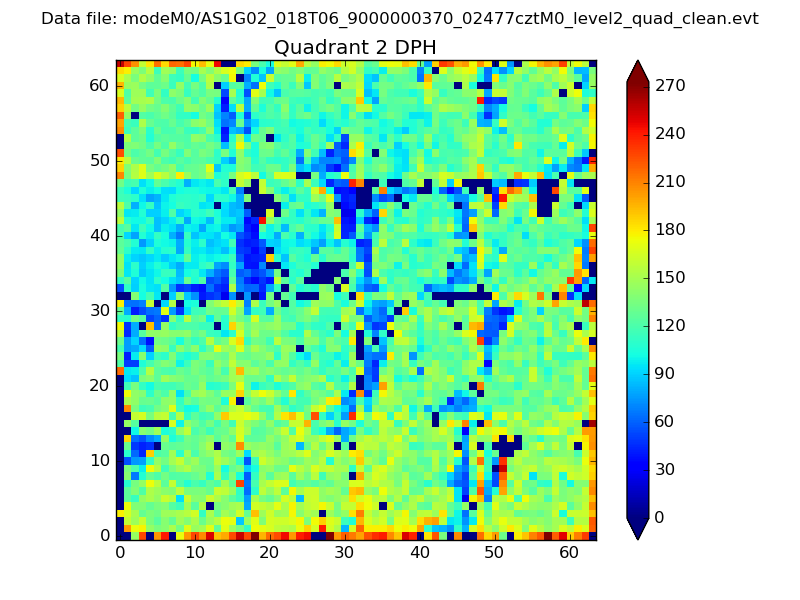
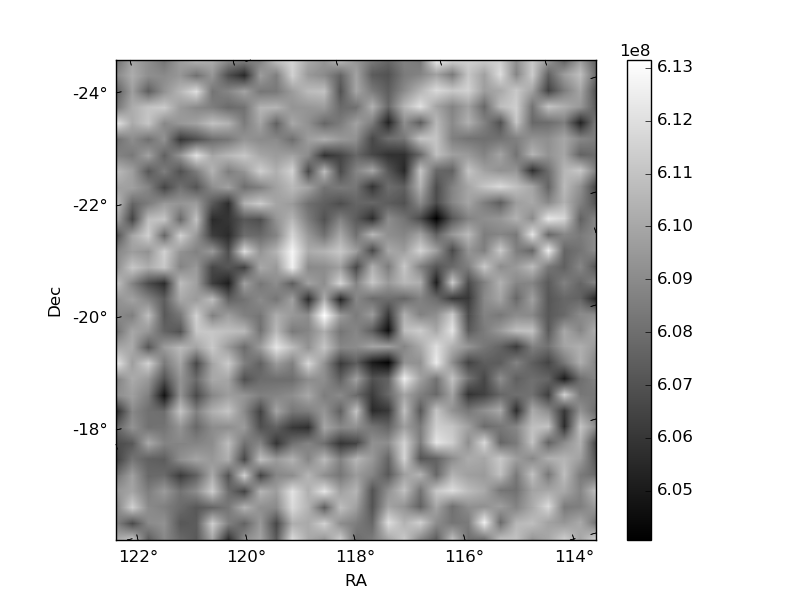
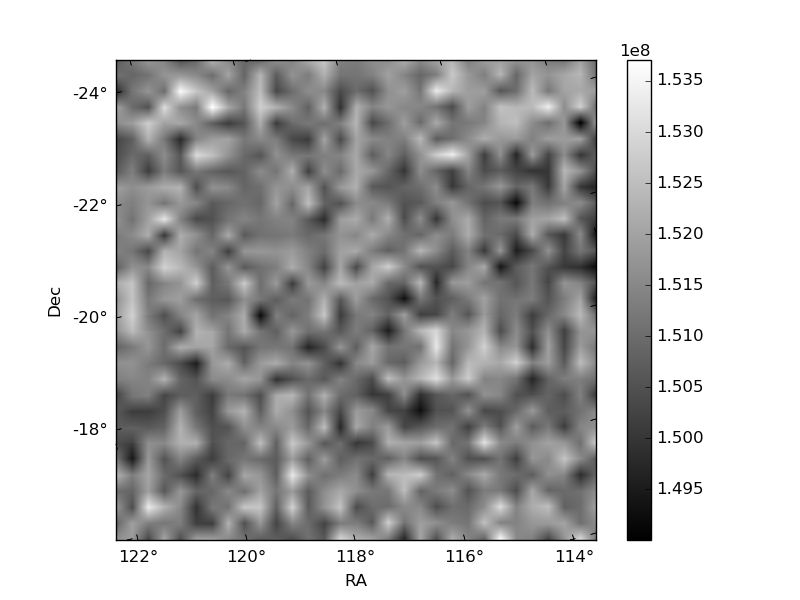
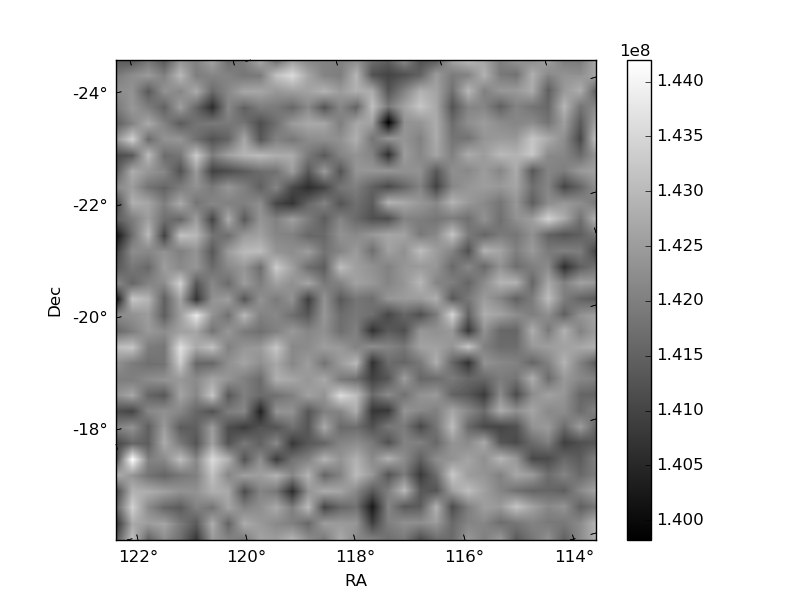
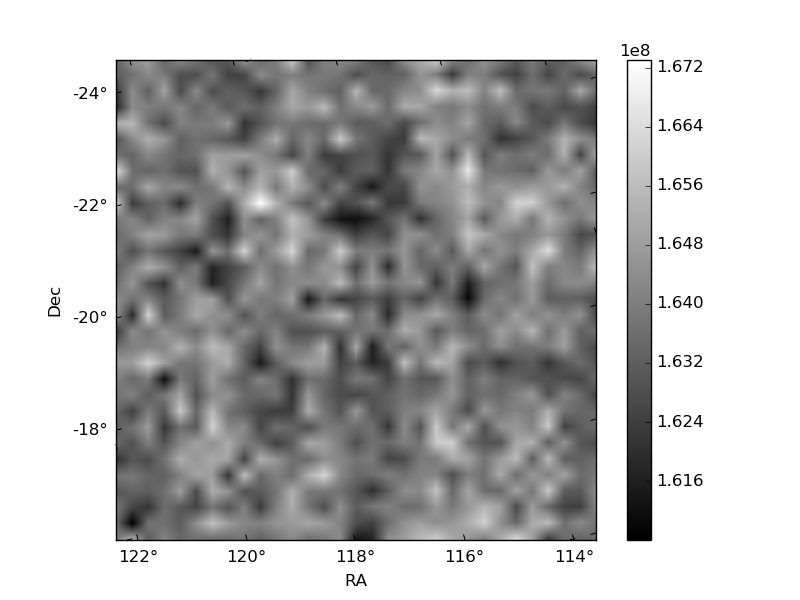
Histogram calculated using DETX and DETY for each event in the final _common_clean file
| Quadrant A | 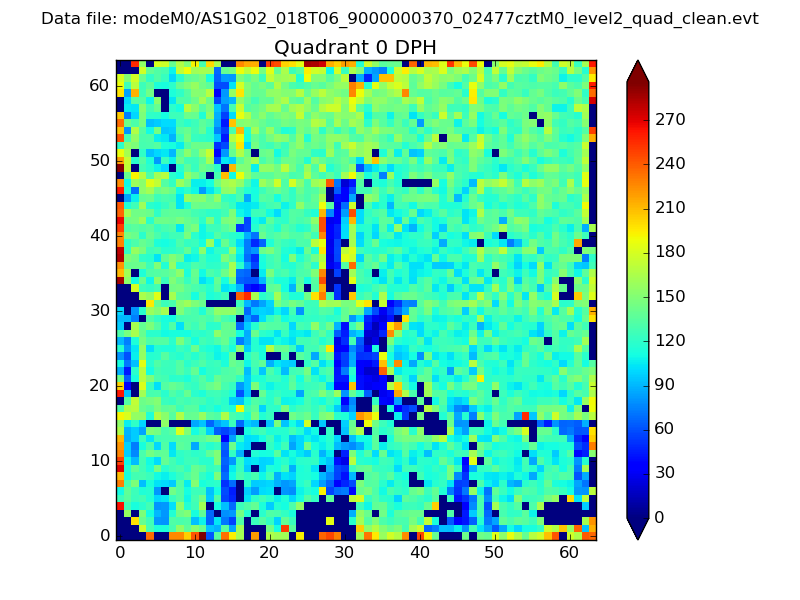 |
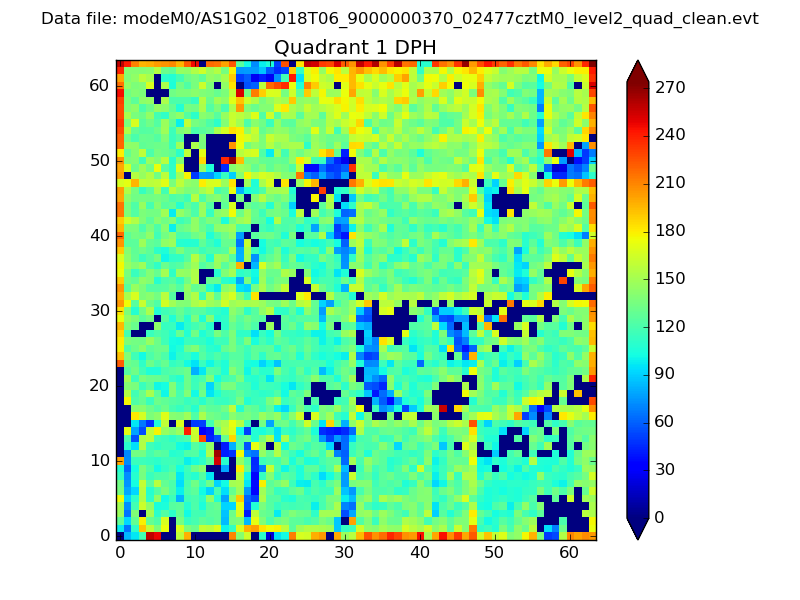 |
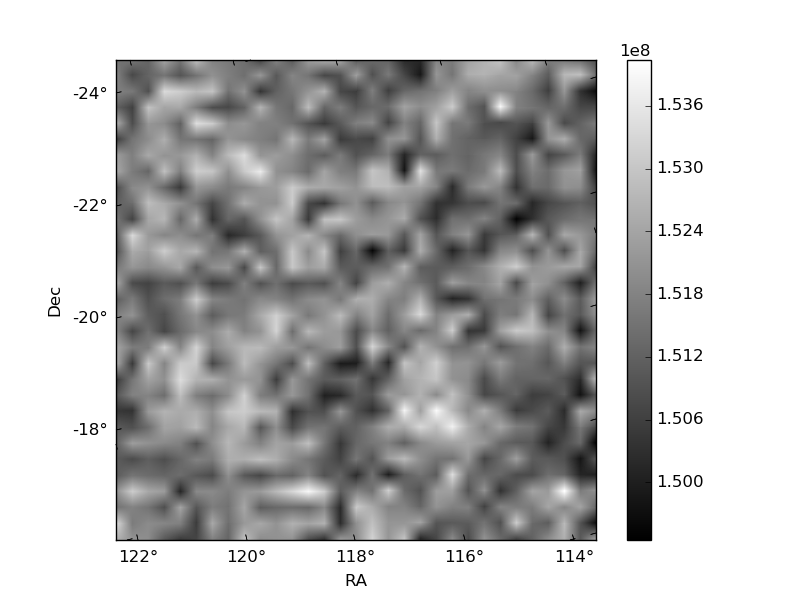
Quadrant B |
|---|---|---|---|
| Quadrant D | 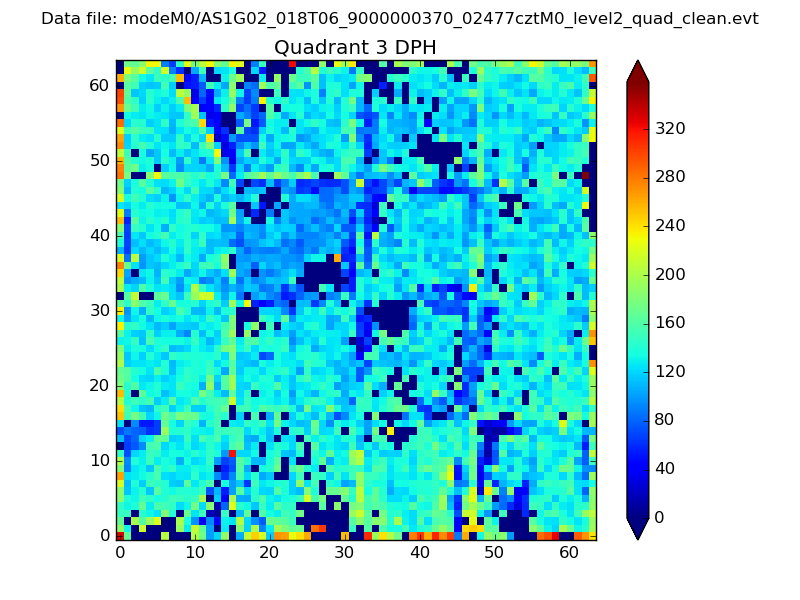 |
 |
Quadrant C |
| Plot type | Count rate plots | Images |
|---|---|---|
| Comparison with Poisson distribution Blue bars denote a histogram of data divided into 1 sec bins. Red curve is a Poisson curve with rate = median count rate of data. |
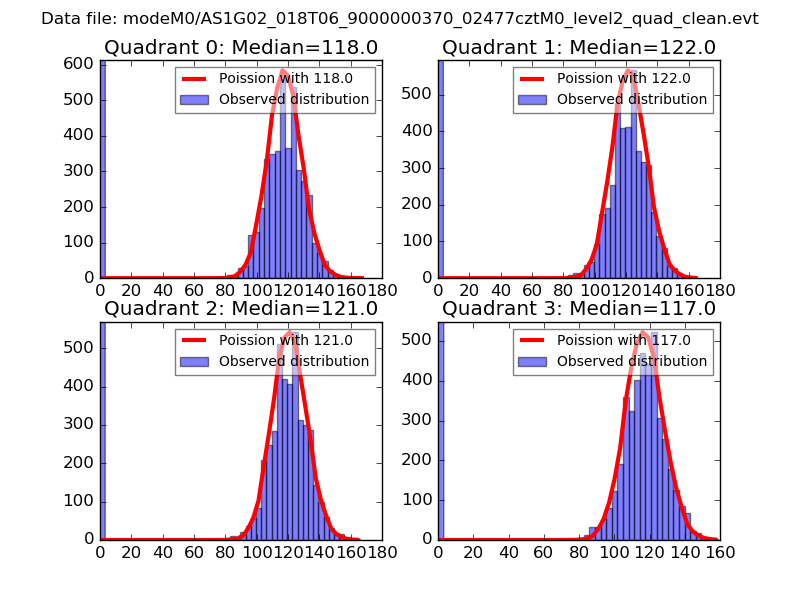 |
 |
| Quadrant-wise count rates Data is divided into 100 sec bins |
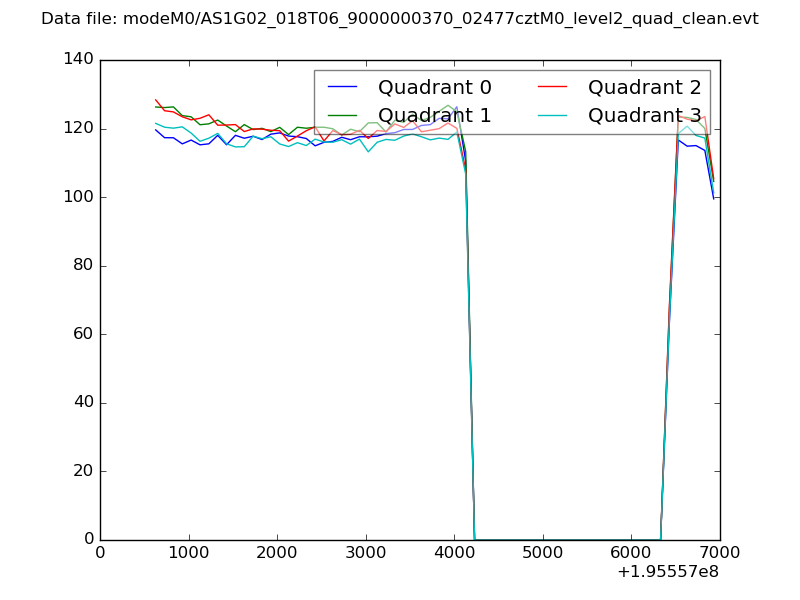 |
|
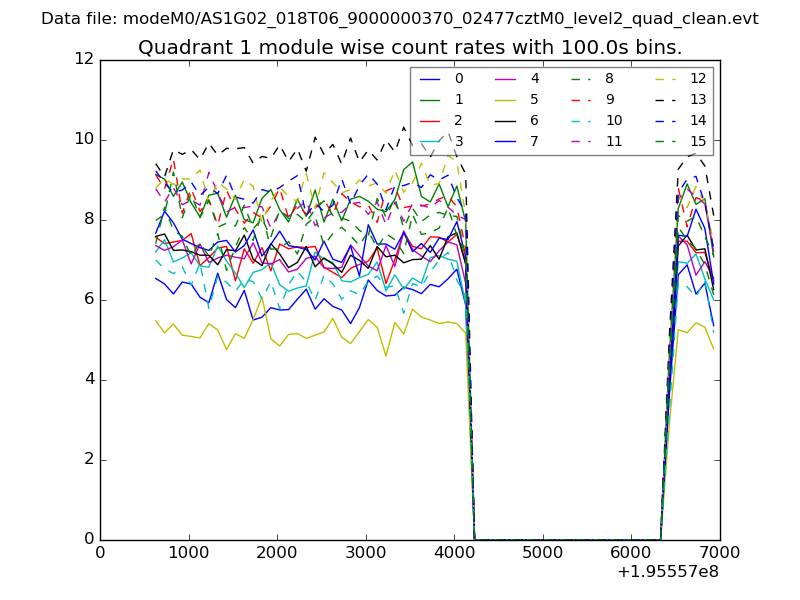
| Module-wise count rates for Quadrant A Data is divided into 100 sec bins |
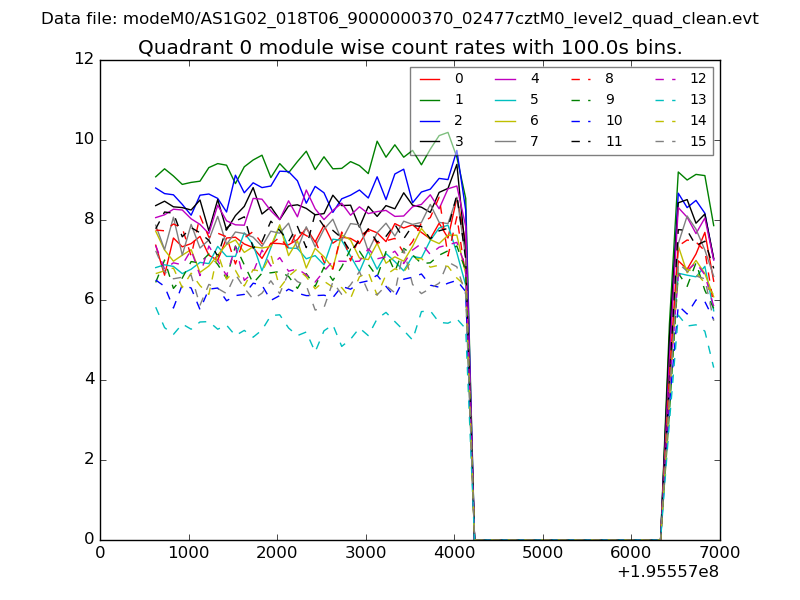 |
 |
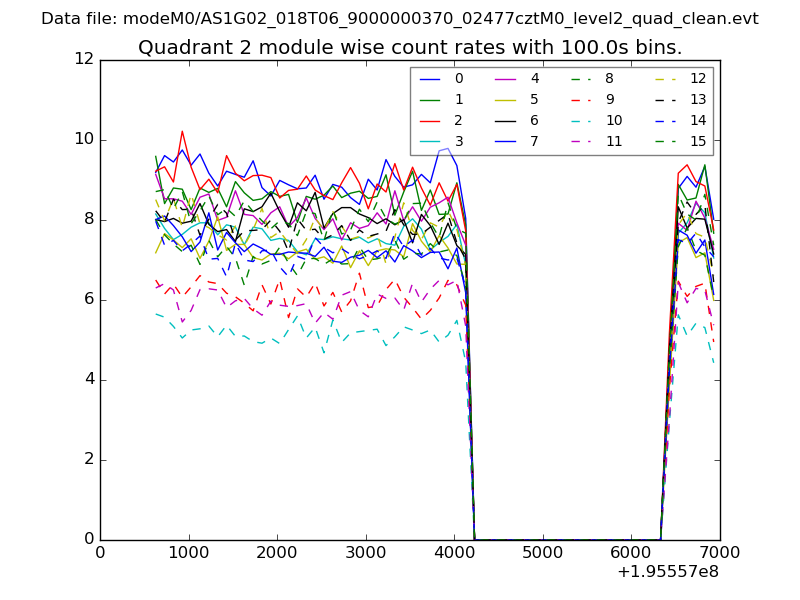
| Module-wise count rates for Quadrant B Data is divided into 100 sec bins |
 |
 |
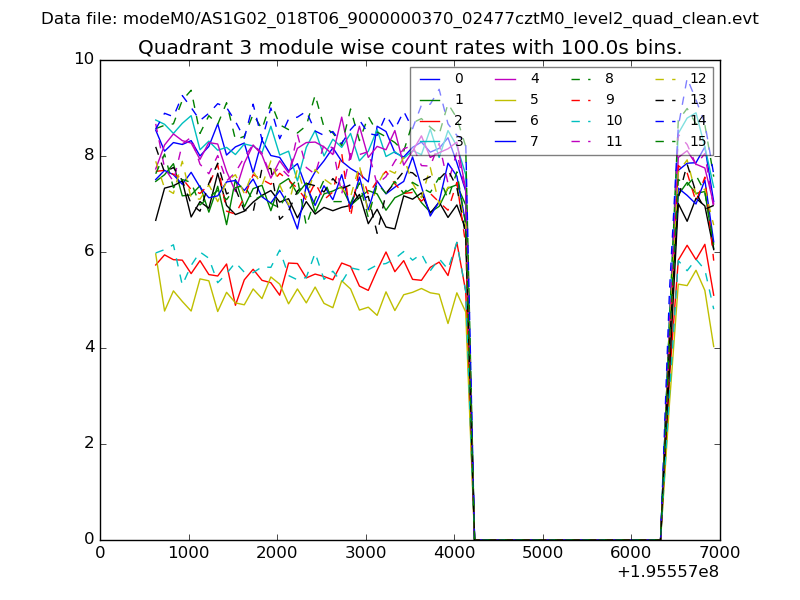
| Module-wise count rates for Quadrant C Data is divided into 100 sec bins |
 |
 |
| Module-wise count rates for Quadrant D Data is divided into 100 sec bins |
 |
 |
| Parameter | Plot |
|---|---|
| CZT HV Monitor | 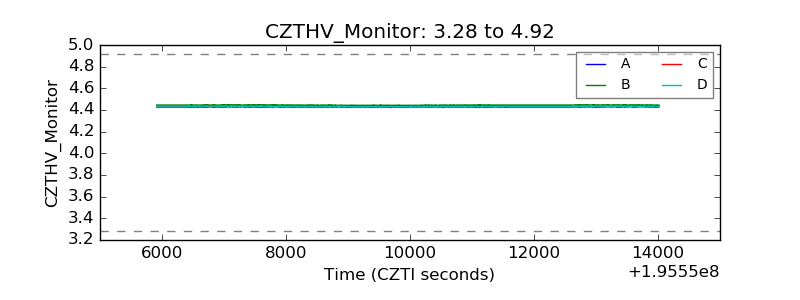 |
| D_VDD | 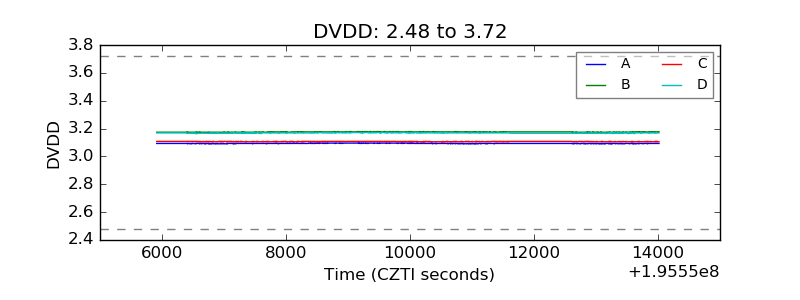 |
| Temperature 1 | 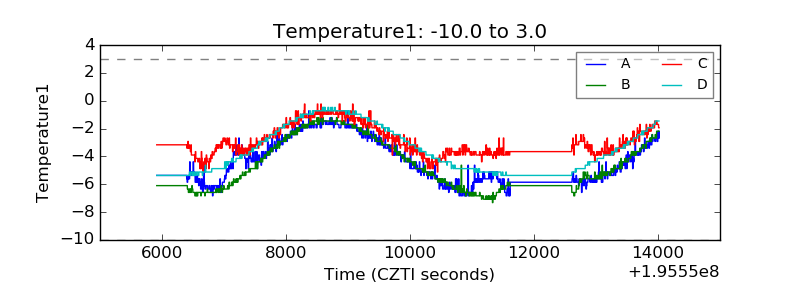 |
| Veto HV Monitor | 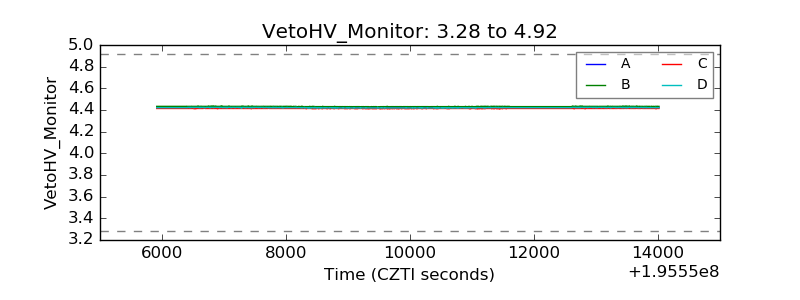 |
| Veto LLD | 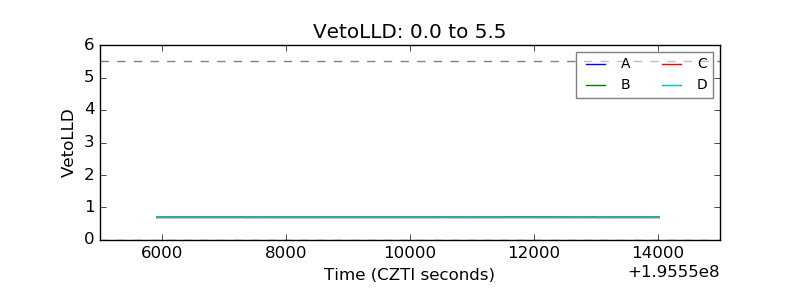 |
| Alpha Counter | 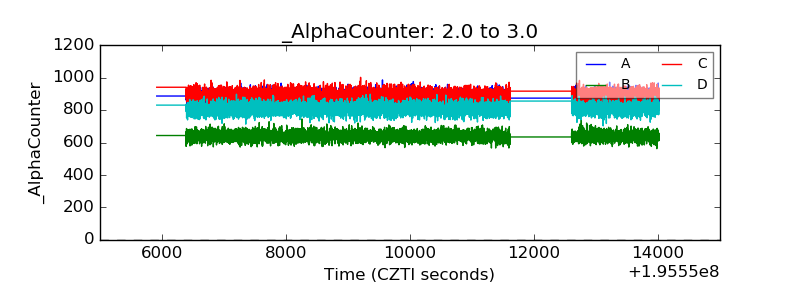 |
| _CPM_Rate | 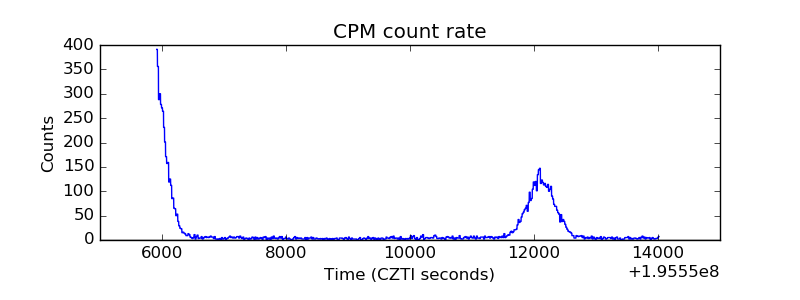 |
| CZT Counter | 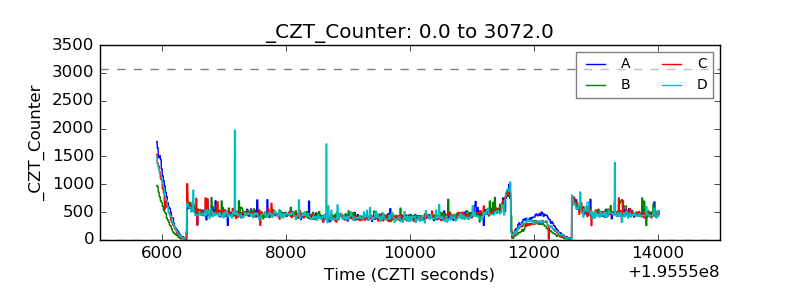 |
| +2.5 Volts monitor |  |
| +5 Volts monitor |  |
| _ROLL_ROT | 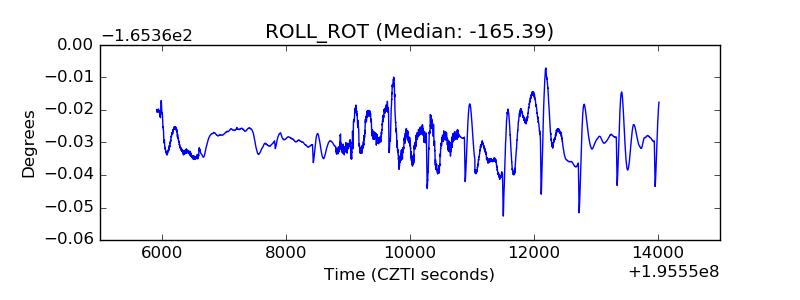 |
| _Roll_DEC | 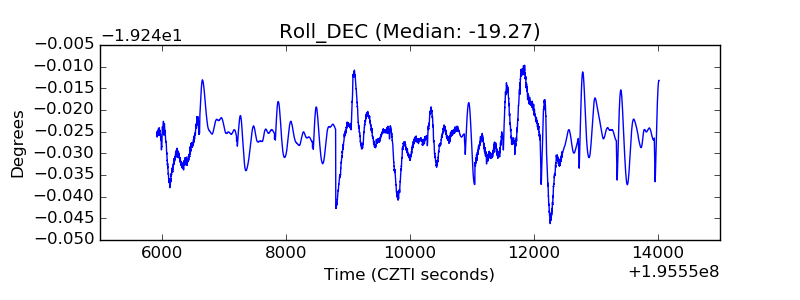 |
| _Roll_RA | 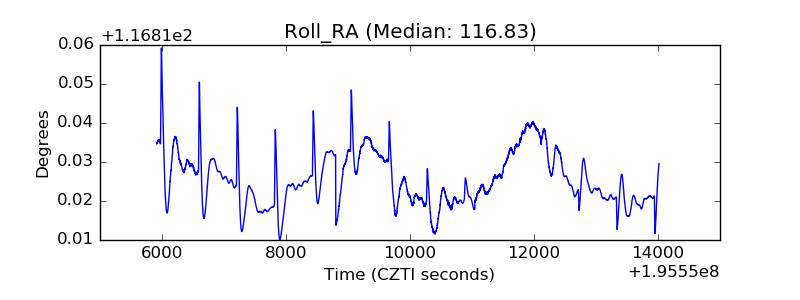 |
| Veto Counter | 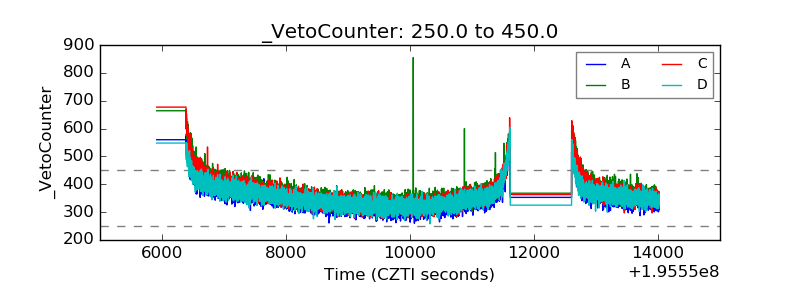 |