| Param | Original file | Final file |
|---|---|---|
| Filename | modeM0/AS1G02_018T06_9000000370_02478cztM0_level2.evt | modeM0/AS1G02_018T06_9000000370_02478cztM0_level2_quad_clean.evt |
| Size (bytes) | 460,854,720 | 86,497,920 |
| Size | 439.5 MB | 82.5 MB |
| Events in quadrant A | 3,290,924 | 522,663 |
| Events in quadrant B | 3,434,432 | 540,192 |
| Events in quadrant C | 3,338,484 | 536,518 |
| Events in quadrant D | 3,404,736 | 520,119 |
| Mode M9 | |||
|---|---|---|---|
| Quadrant | BADHDUFLAG | Total packets | Discarded packets |
| A | 0 | 14 | 0 |
| B | 0 | 14 | 0 |
| C | 0 | 14 | 0 |
| D | 0 | 14 | 0 |
| Mode SS | |||
|---|---|---|---|
| Quadrant | BADHDUFLAG | Total packets | Discarded packets |
| A | 0 | 150 | 0 |
| B | 0 | 150 | 0 |
| C | 0 | 150 | 0 |
| D | 0 | 150 | 0 |
| Mode M0 | |||
|---|---|---|---|
| Quadrant | BADHDUFLAG | Total packets | Discarded packets |
| A | 0 | 14815 | 3 |
| B | 0 | 15035 | 2 |
| C | 0 | 15016 | 2 |
| D | 0 | 15348 | 2 |
| Quadrant | Total seconds | Saturated seconds | Saturation percentage |
|---|---|---|---|
| A | 7171 | 190 | 2.649561% |
| B | 7171 | 186 | 2.593781% |
| C | 7171 | 123 | 1.715242% |
| D | 7171 | 157 | 2.189374% |
Noise dominated data is calculated using 1-second bins in cleaned event files. If a bin has >2000 counts, and if more than 50% of those come from <1% of pixels, then it is considered to be noise-dominated and hence unusable.
| Quadrant | # 1 sec bins | Bins with >0 counts | Bins with >2000 counts | High rate bins dominated by noise | Noise dominated (total time) | Noise dominated (detector-on time) | Marked lightcurve |
|---|---|---|---|---|---|---|---|
| A | 8726 | 7173 | 0 | 0 | 0.00% | 0.00% | 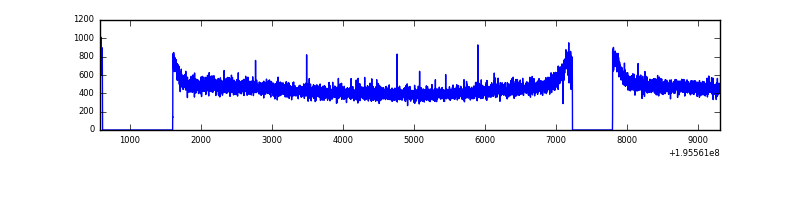 |
| B | 8726 | 7173 | 1 | 1 | 0.01% | 0.01% | 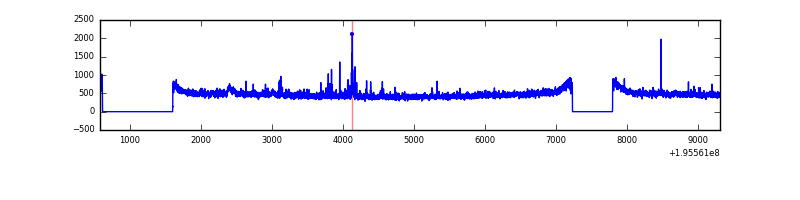 |
| C | 8726 | 7173 | 4 | 4 | 0.05% | 0.06% | 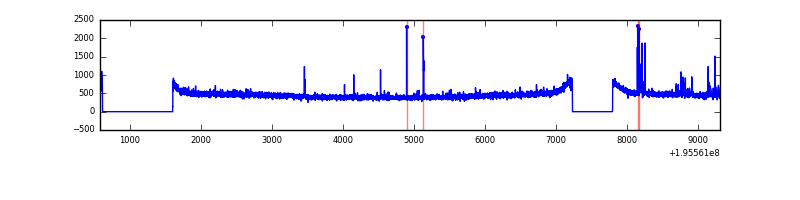 |
| D | 8726 | 7173 | 14 | 14 | 0.16% | 0.20% | 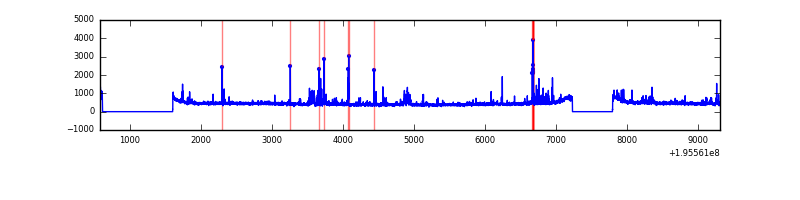 |
Top three noisy pixels from each quadrant. If the there are fewer than three noisy pixels in the level2.evt file, extra rows are filled as -1
| Pixel properties | Quadrant properties | ||||||
|---|---|---|---|---|---|---|---|
| Quadrant | DetID | PixID | Counts | Sigma | Mean | Median | Sigma |
| A | 14 | 63 | 13357 | 71.64 | 851 | 829 | 174.9 |
| A | 12 | 194 | 9586 | 50.08 | 851 | 829 | 174.9 |
| A | 0 | 226 | 9094 | 47.26 | 851 | 829 | 174.9 |
| B | 10 | 244 | 27837 | 160.84 | 866 | 844 | 167.8 |
| B | 15 | 85 | 26787 | 154.59 | 866 | 844 | 167.8 |
| B | 4 | 48 | 23861 | 137.15 | 866 | 844 | 167.8 |
| C | 14 | 223 | 50528 | 254.17 | 833 | 836 | 195.5 |
| C | 10 | 65 | 22551 | 111.07 | 833 | 836 | 195.5 |
| C | 13 | 61 | 7536 | 34.27 | 833 | 836 | 195.5 |
| D | 2 | 184 | 87528 | 440.86 | 825 | 803 | 196.7 |
| D | 5 | 172 | 76543 | 385.02 | 825 | 803 | 196.7 |
| D | 6 | 112 | 31880 | 157.98 | 825 | 803 | 196.7 |
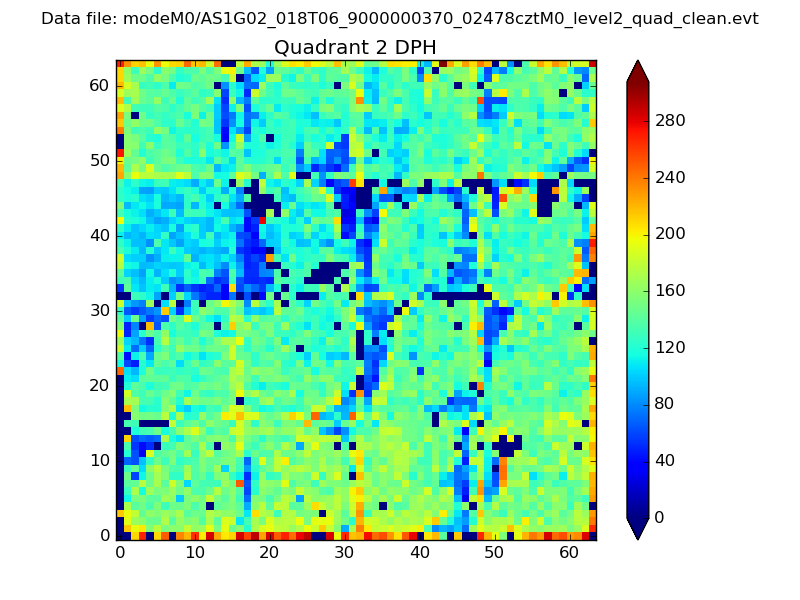
Histogram calculated using DETX and DETY for each event in the final _common_clean file
| Quadrant A | 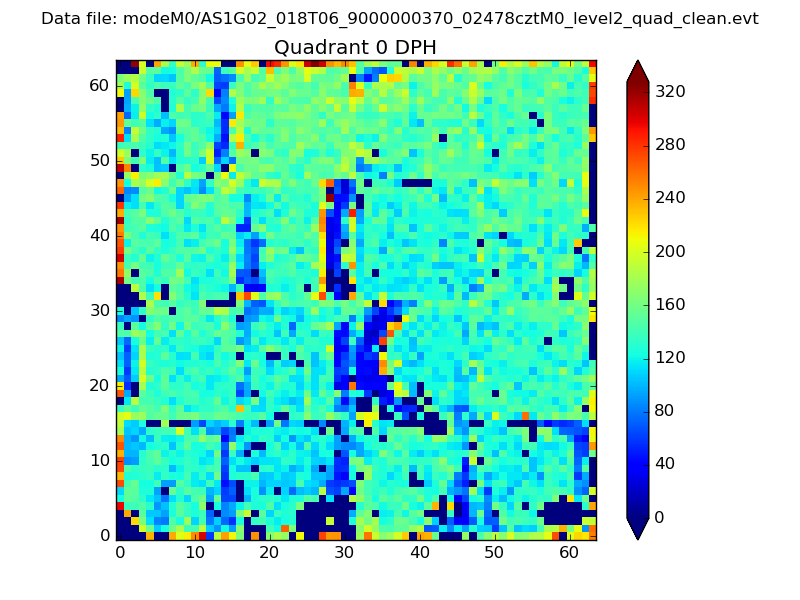 |
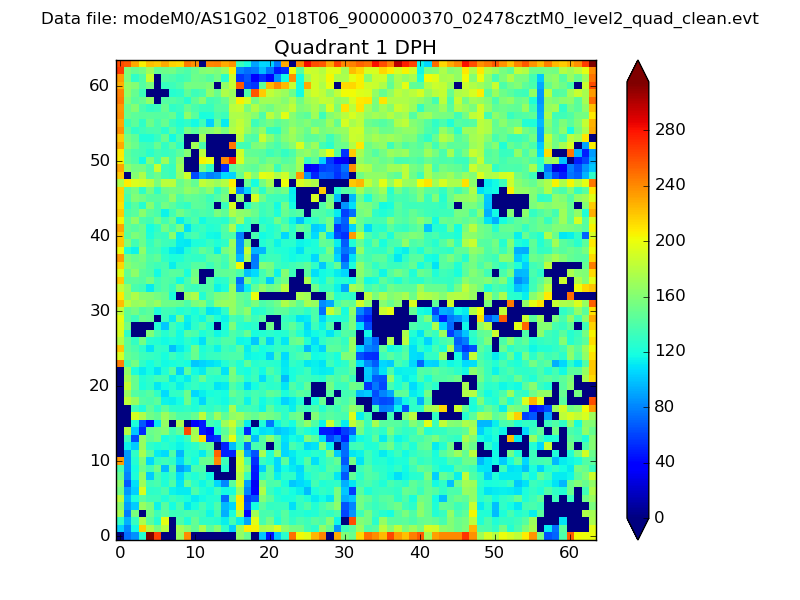 |
Quadrant B |
|---|---|---|---|
| Quadrant D | 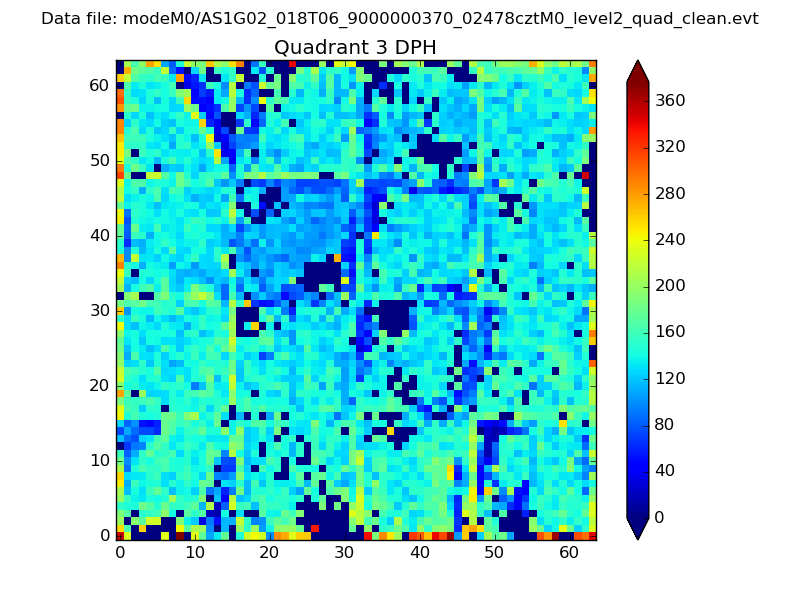 |
 |
Quadrant C |
| Plot type | Count rate plots | Images |
|---|---|---|
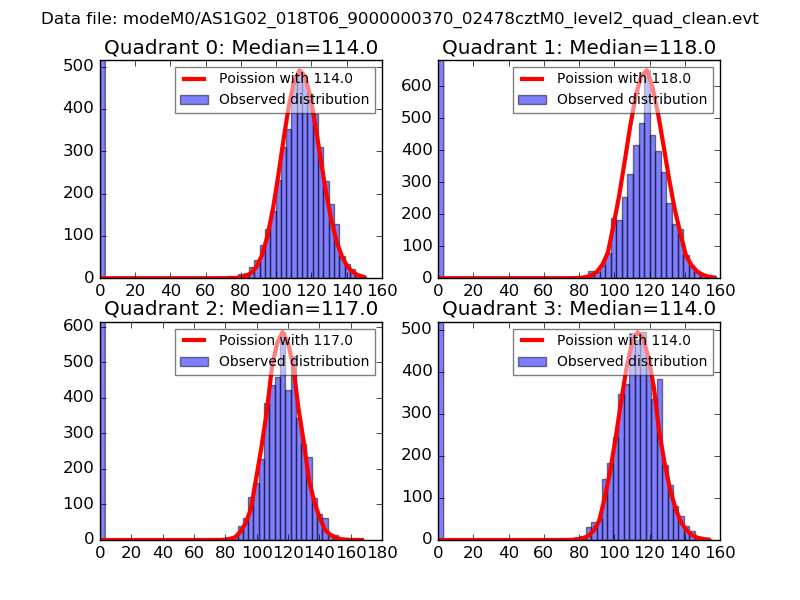
| Comparison with Poisson distribution Blue bars denote a histogram of data divided into 1 sec bins. Red curve is a Poisson curve with rate = median count rate of data. |
 |
 |
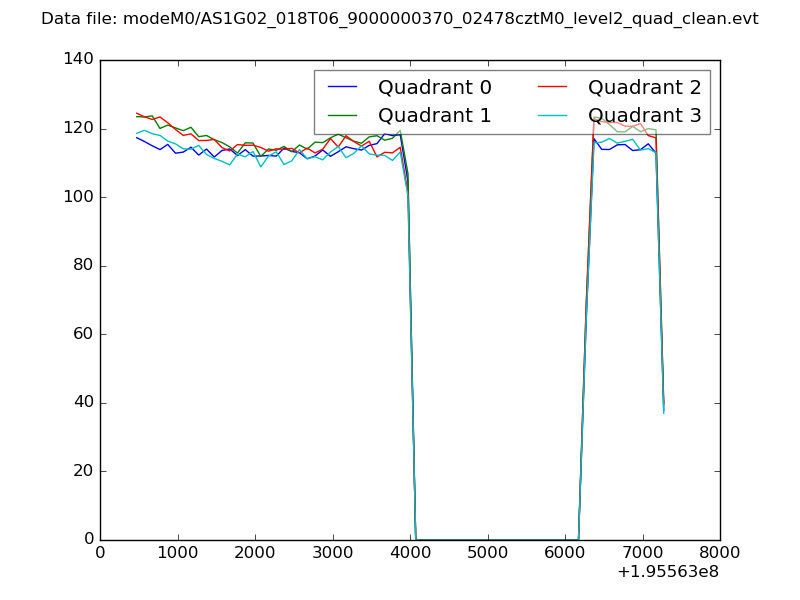
| Quadrant-wise count rates Data is divided into 100 sec bins |
 |
|
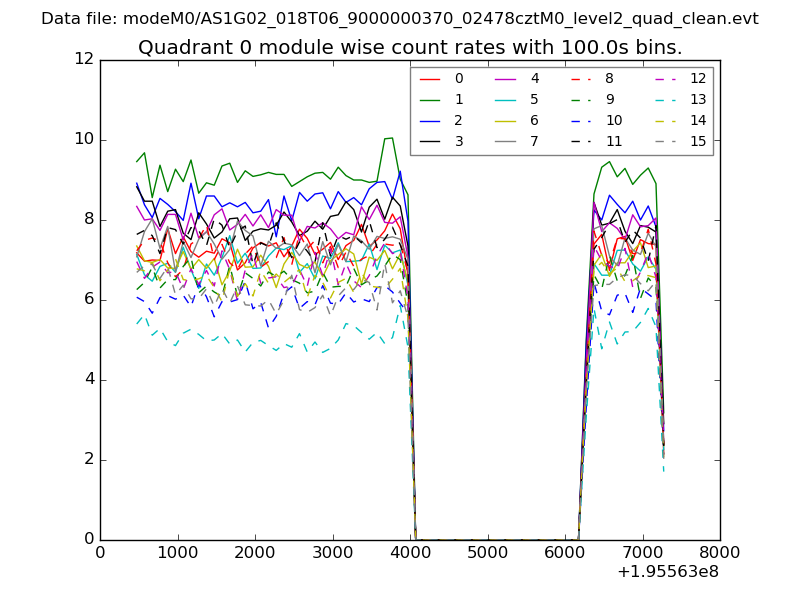
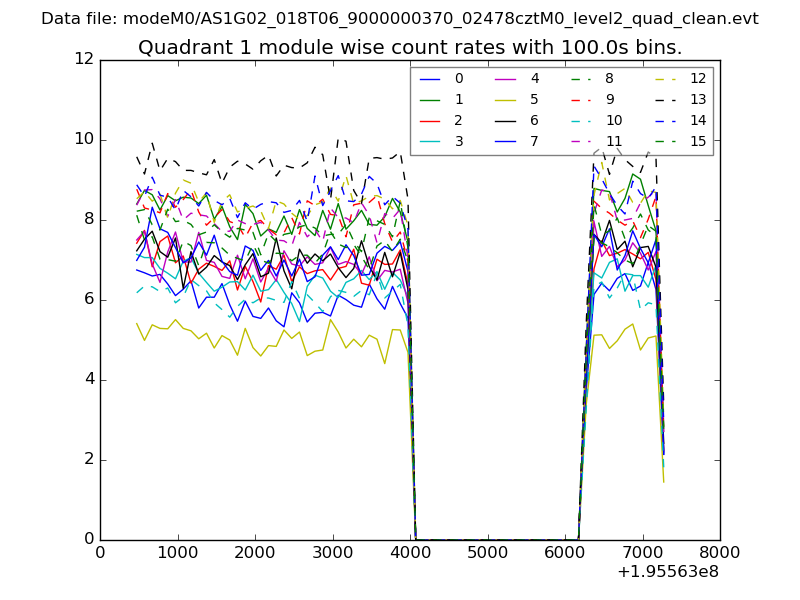
| Module-wise count rates for Quadrant A Data is divided into 100 sec bins |
 |
 |
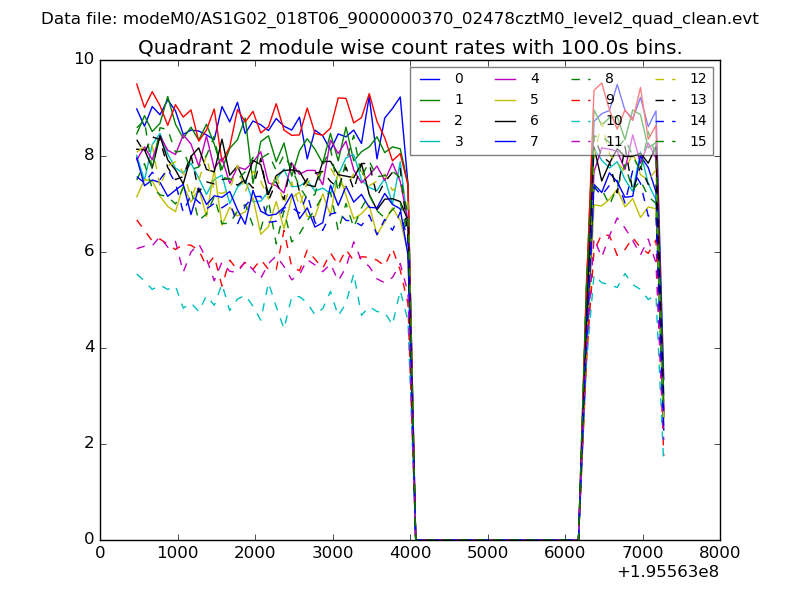
| Module-wise count rates for Quadrant B Data is divided into 100 sec bins |
 |
 |
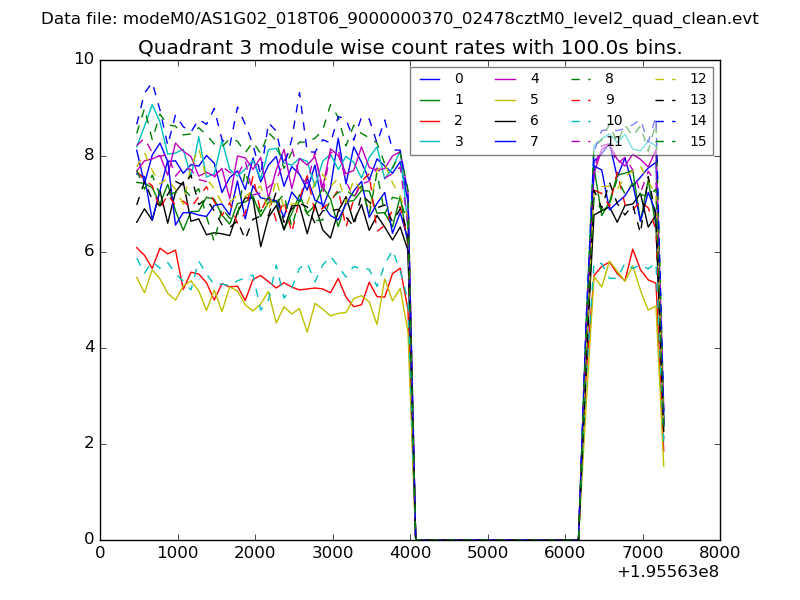
| Module-wise count rates for Quadrant C Data is divided into 100 sec bins |
 |
 |
| Module-wise count rates for Quadrant D Data is divided into 100 sec bins |
 |
 |
| Parameter | Plot |
|---|---|
| CZT HV Monitor | 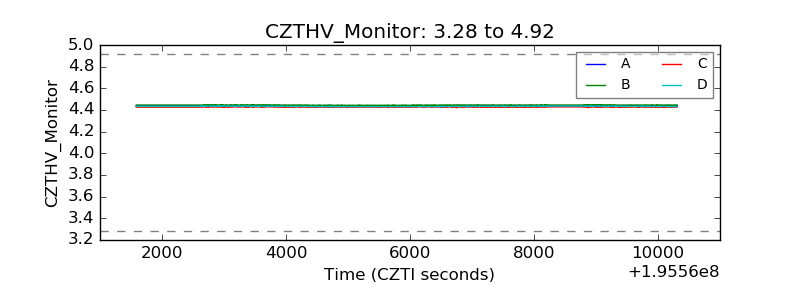 |
| D_VDD | 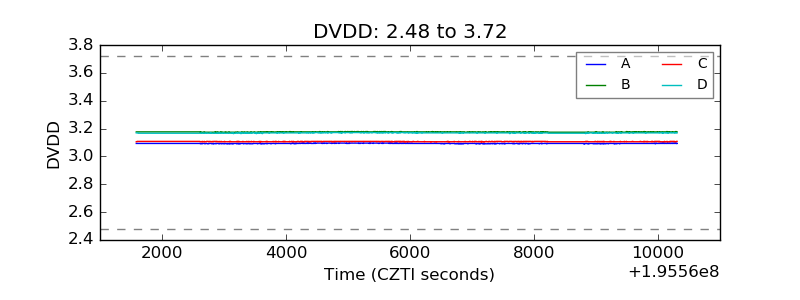 |
| Temperature 1 | 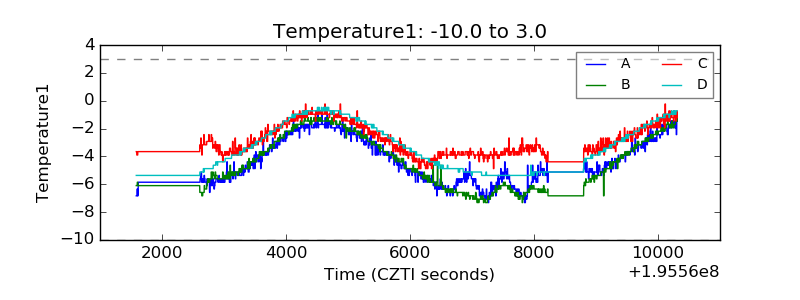 |
| Veto HV Monitor | 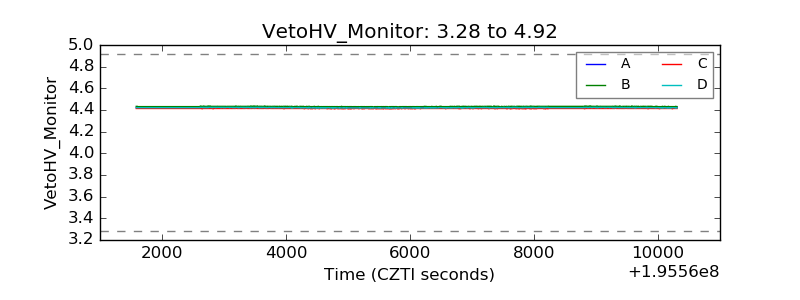 |
| Veto LLD | 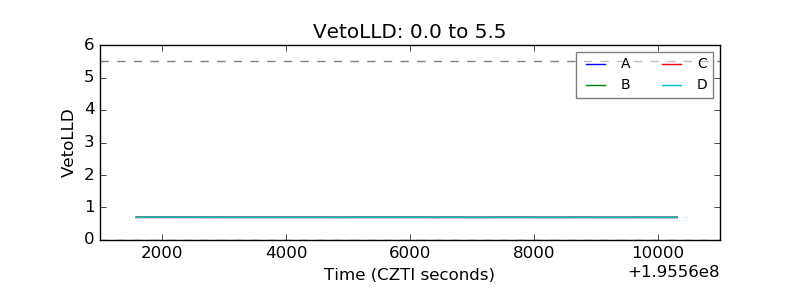 |
| Alpha Counter | 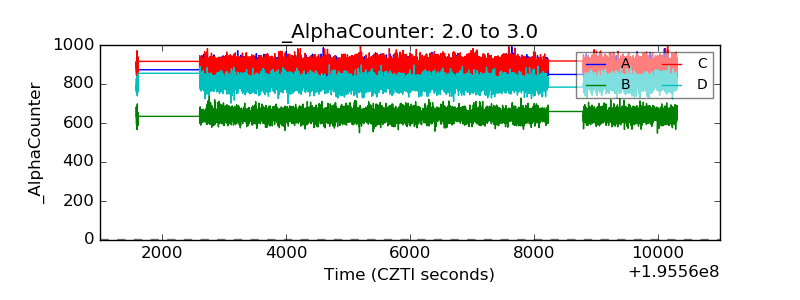 |
| _CPM_Rate | 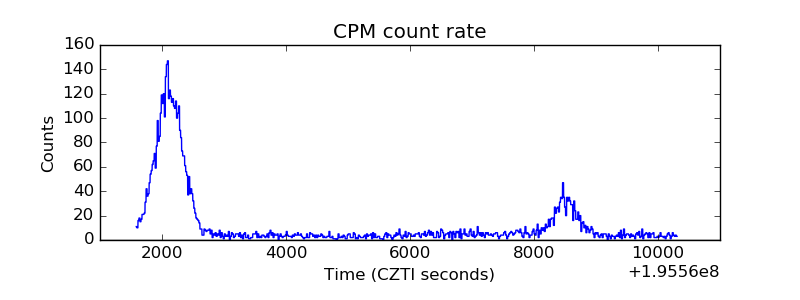 |
| CZT Counter | 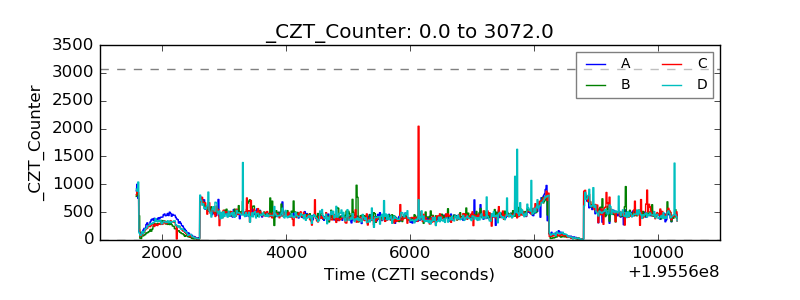 |
| +2.5 Volts monitor |  |
| +5 Volts monitor |  |
| _ROLL_ROT | 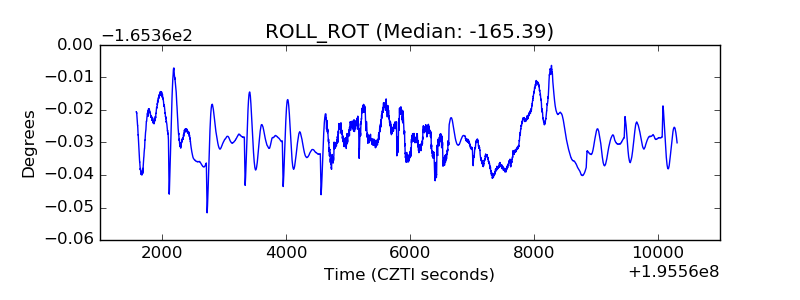 |
| _Roll_DEC | 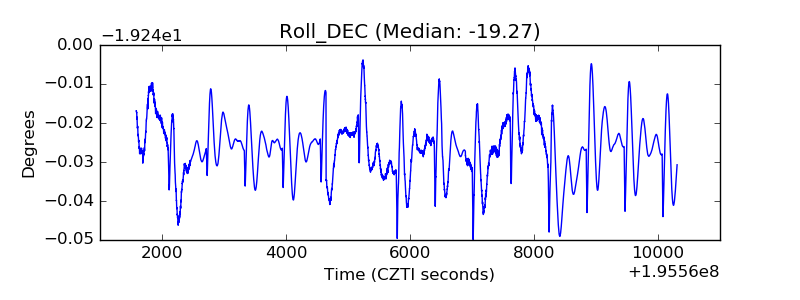 |
| _Roll_RA | 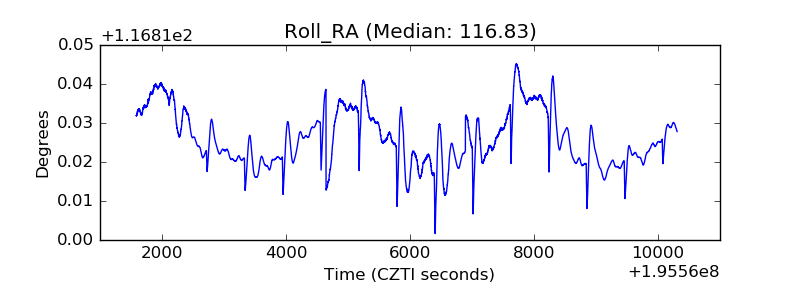 |
| Veto Counter | 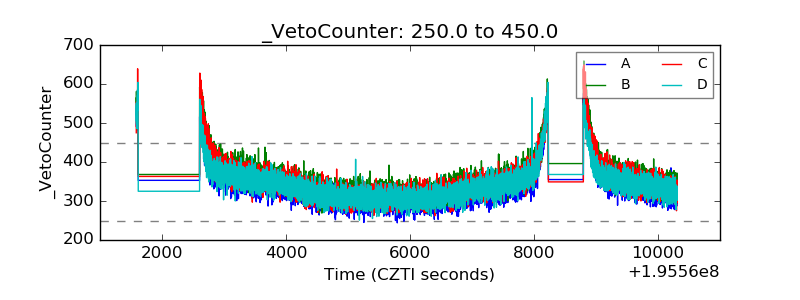 |