| Param | Original file | Final file |
|---|---|---|
| Filename | modeM0/AS1G02_018T06_9000000370_02479cztM0_level2.evt | modeM0/AS1G02_018T06_9000000370_02479cztM0_level2_quad_clean.evt |
| Size (bytes) | 457,865,280 | 90,230,400 |
| Size | 436.7 MB | 86.1 MB |
| Events in quadrant A | 3,303,823 | 552,873 |
| Events in quadrant B | 3,406,433 | 569,611 |
| Events in quadrant C | 3,288,935 | 565,799 |
| Events in quadrant D | 3,381,559 | 547,195 |
| Mode SS | |||
|---|---|---|---|
| Quadrant | BADHDUFLAG | Total packets | Discarded packets |
| A | 0 | 142 | 0 |
| B | 0 | 142 | 0 |
| C | 0 | 142 | 0 |
| D | 0 | 142 | 0 |
| Mode M0 | |||
|---|---|---|---|
| Quadrant | BADHDUFLAG | Total packets | Discarded packets |
| A | 0 | 14911 | 1 |
| B | 0 | 15010 | 0 |
| C | 0 | 14912 | 0 |
| D | 0 | 15333 | 0 |
| Quadrant | Total seconds | Saturated seconds | Saturation percentage |
|---|---|---|---|
| A | 7139 | 219 | 3.067657% |
| B | 7139 | 214 | 2.997619% |
| C | 7139 | 116 | 1.624877% |
| D | 7139 | 140 | 1.961059% |
Noise dominated data is calculated using 1-second bins in cleaned event files. If a bin has >2000 counts, and if more than 50% of those come from <1% of pixels, then it is considered to be noise-dominated and hence unusable.
| Quadrant | # 1 sec bins | Bins with >0 counts | Bins with >2000 counts | High rate bins dominated by noise | Noise dominated (total time) | Noise dominated (detector-on time) | Marked lightcurve |
|---|---|---|---|---|---|---|---|
| A | 7139 | 7139 | 0 | 0 | 0.00% | 0.00% | 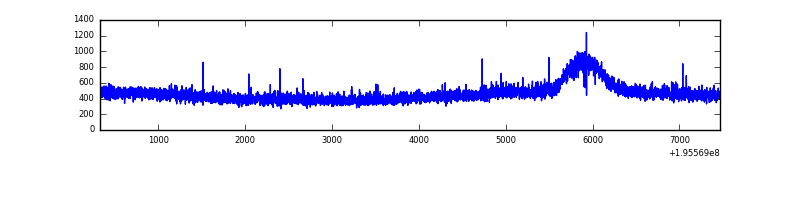 |
| B | 7139 | 7139 | 0 | 0 | 0.00% | 0.00% | 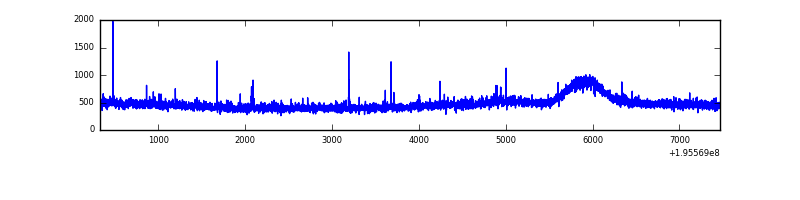 |
| C | 7139 | 7139 | 0 | 0 | 0.00% | 0.00% | 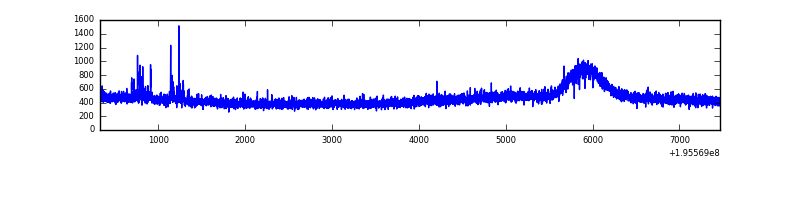 |
| D | 7139 | 7139 | 9 | 9 | 0.13% | 0.13% | 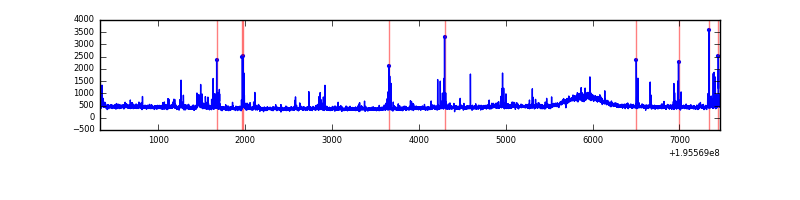 |
Top three noisy pixels from each quadrant. If the there are fewer than three noisy pixels in the level2.evt file, extra rows are filled as -1
| Pixel properties | Quadrant properties | ||||||
|---|---|---|---|---|---|---|---|
| Quadrant | DetID | PixID | Counts | Sigma | Mean | Median | Sigma |
| A | 12 | 194 | 9669 | 49.75 | 856 | 834 | 177.6 |
| A | 0 | 226 | 9034 | 46.18 | 856 | 834 | 177.6 |
| A | 8 | 15 | 6799 | 33.59 | 856 | 834 | 177.6 |
| B | 10 | 244 | 17572 | 99.19 | 868 | 845 | 168.6 |
| B | 4 | 48 | 14003 | 78.03 | 868 | 845 | 168.6 |
| B | 12 | 111 | 13053 | 72.4 | 868 | 845 | 168.6 |
| C | 14 | 223 | 26646 | 132.44 | 830 | 833 | 194.9 |
| C | 13 | 61 | 7316 | 33.26 | 830 | 833 | 194.9 |
| C | 0 | 64 | 5752 | 25.24 | 830 | 833 | 194.9 |
| D | 2 | 184 | 144305 | 723.08 | 825 | 803 | 198.5 |
| D | 5 | 172 | 61331 | 304.99 | 825 | 803 | 198.5 |
| D | 9 | 64 | 15529 | 74.2 | 825 | 803 | 198.5 |
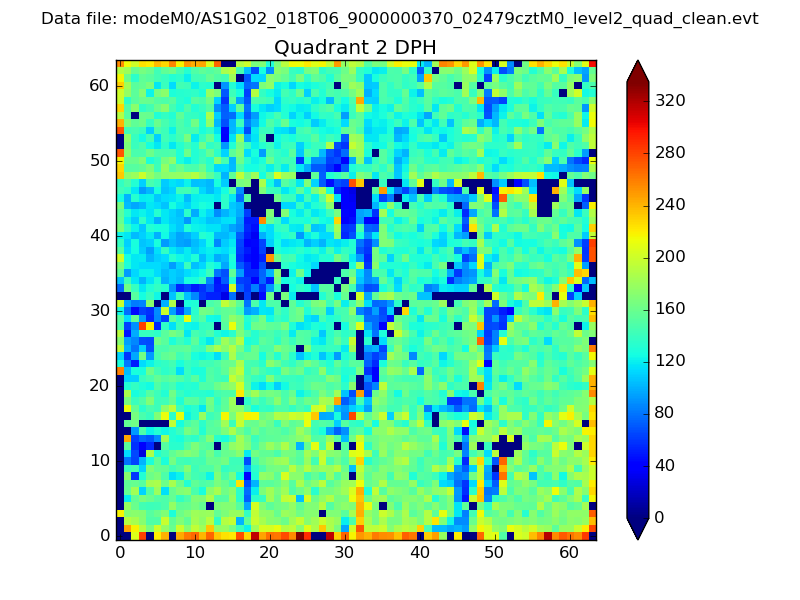
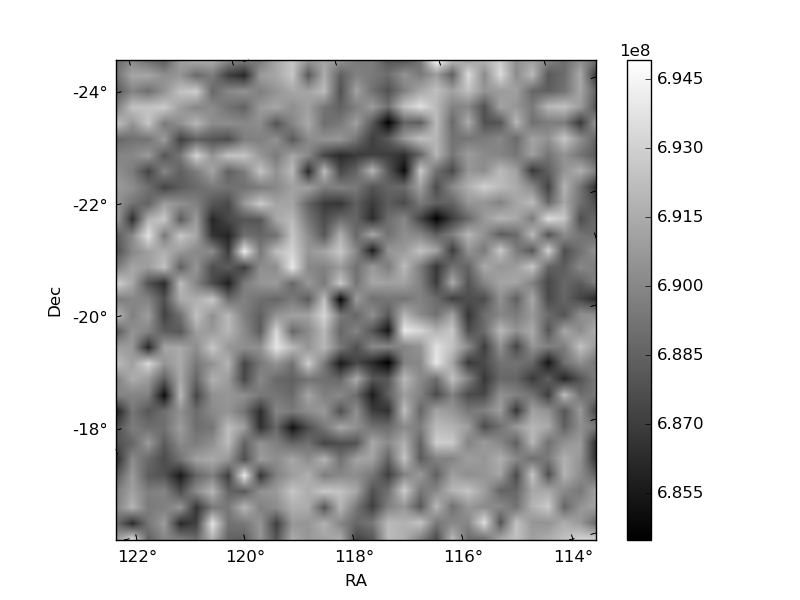
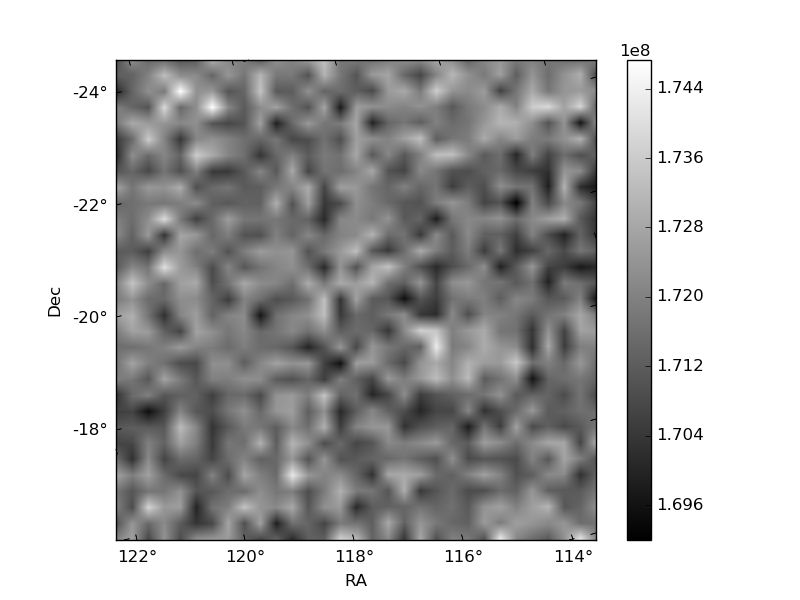
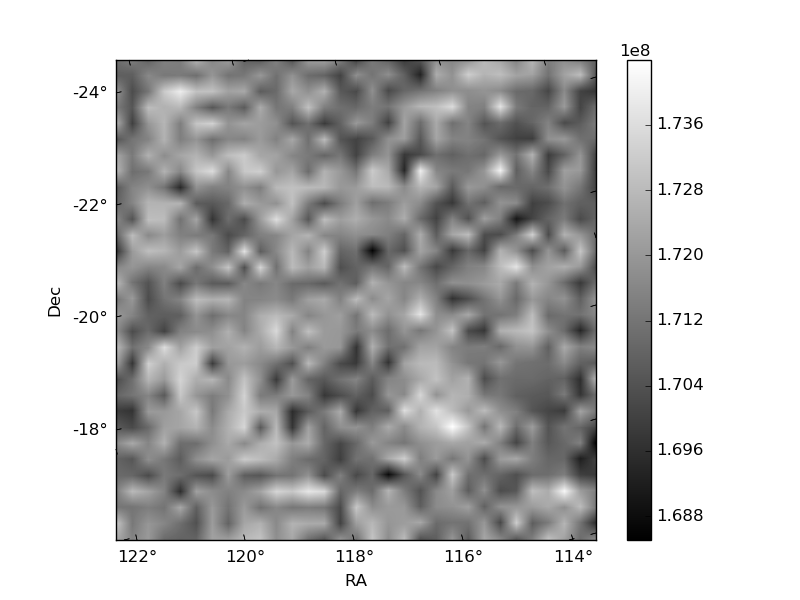
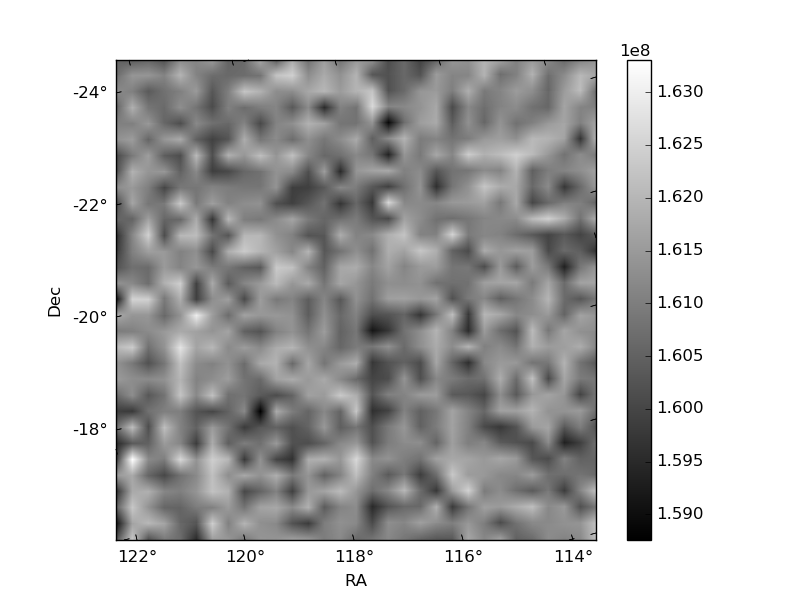
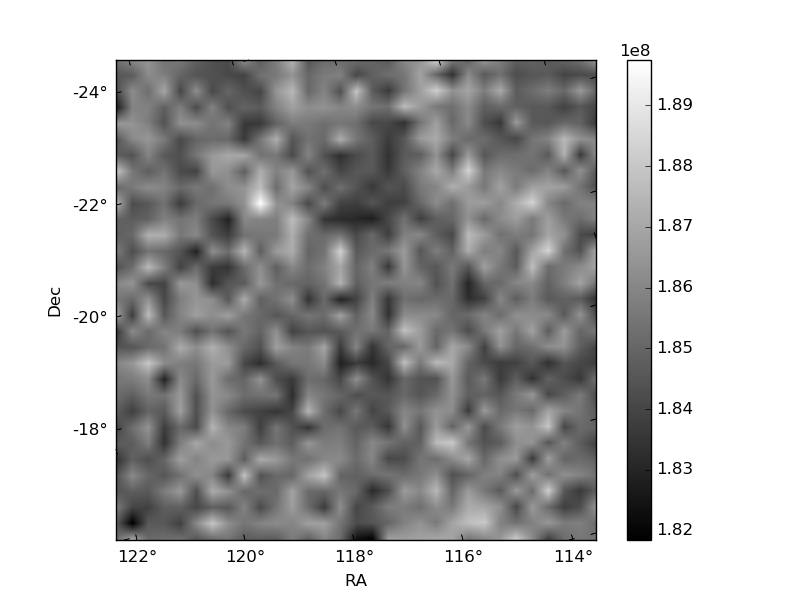
Histogram calculated using DETX and DETY for each event in the final _common_clean file
| Quadrant A | 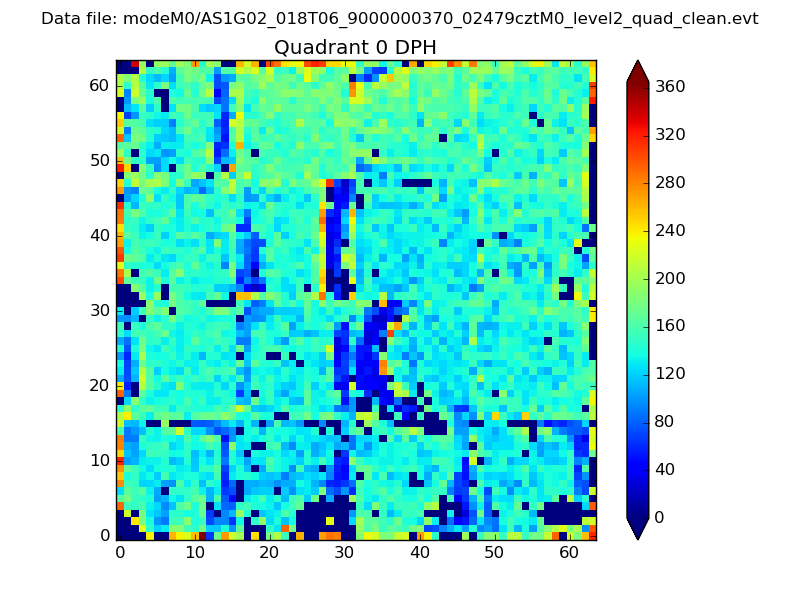 |
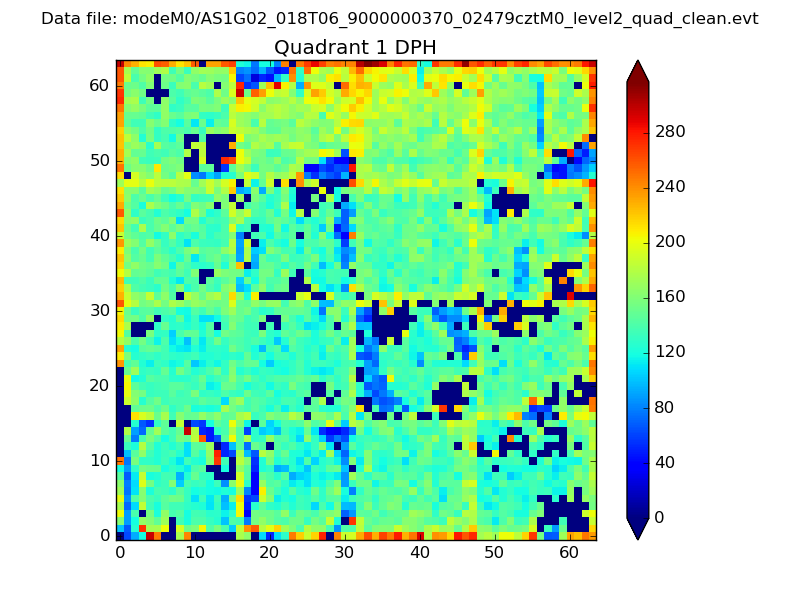 |
Quadrant B |
|---|---|---|---|
| Quadrant D | 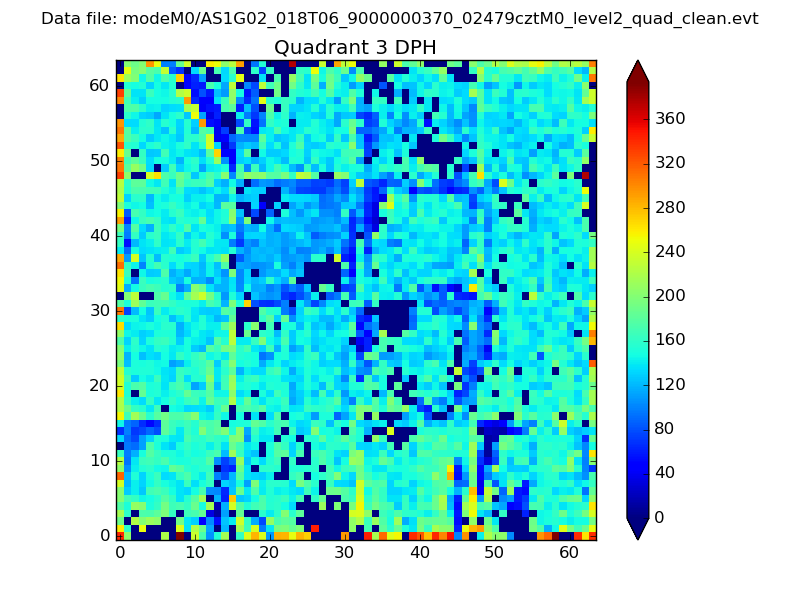 |
 |
Quadrant C |
| Plot type | Count rate plots | Images |
|---|---|---|
| Comparison with Poisson distribution Blue bars denote a histogram of data divided into 1 sec bins. Red curve is a Poisson curve with rate = median count rate of data. |
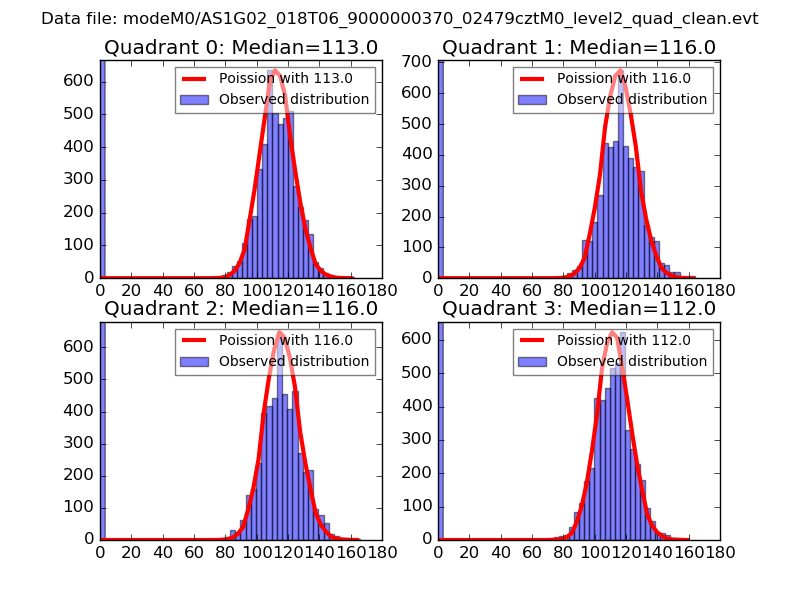 |
 |
| Quadrant-wise count rates Data is divided into 100 sec bins |
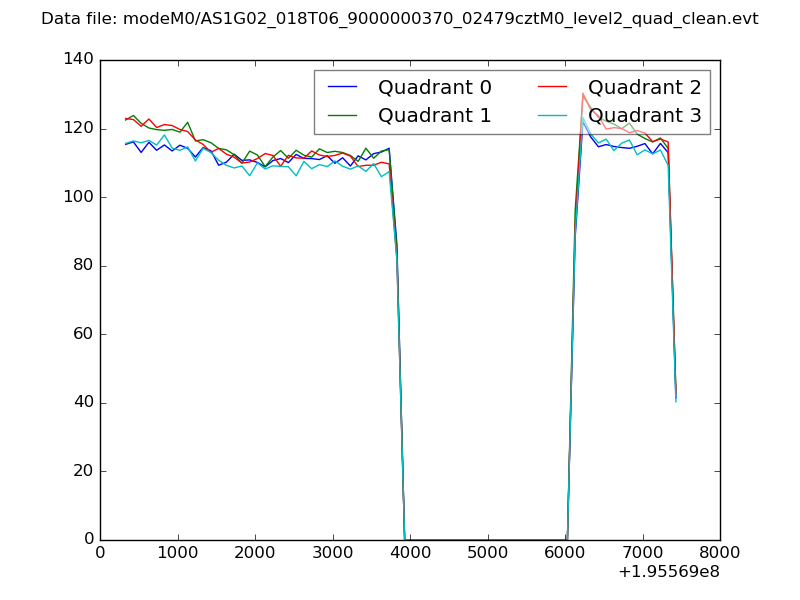 |
|
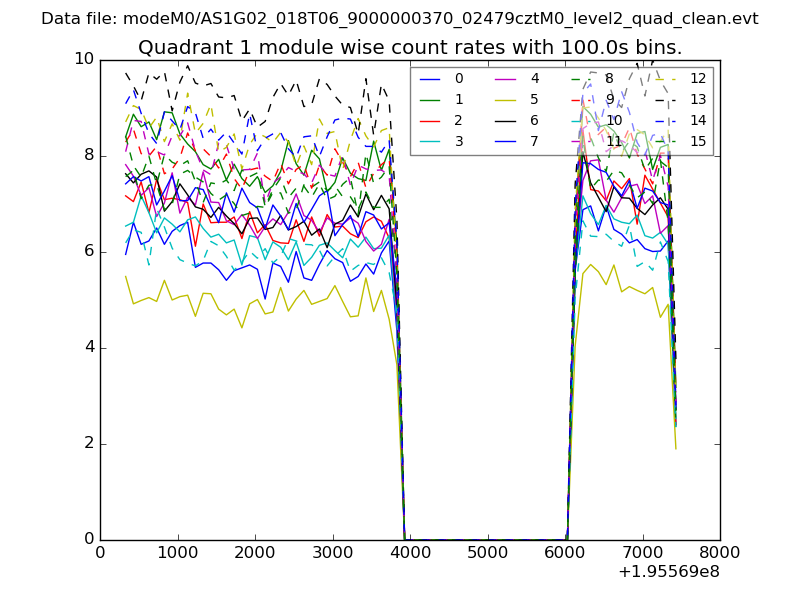
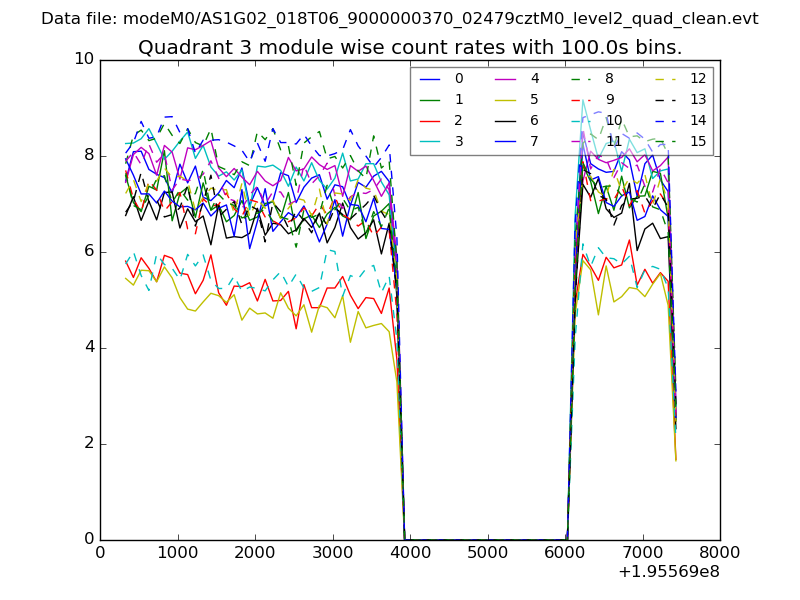
| Module-wise count rates for Quadrant A Data is divided into 100 sec bins |
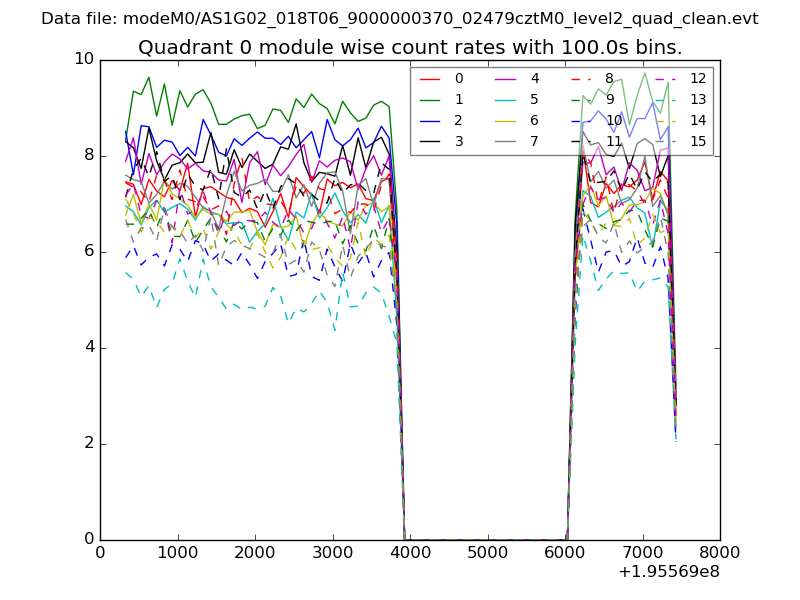 |
 |
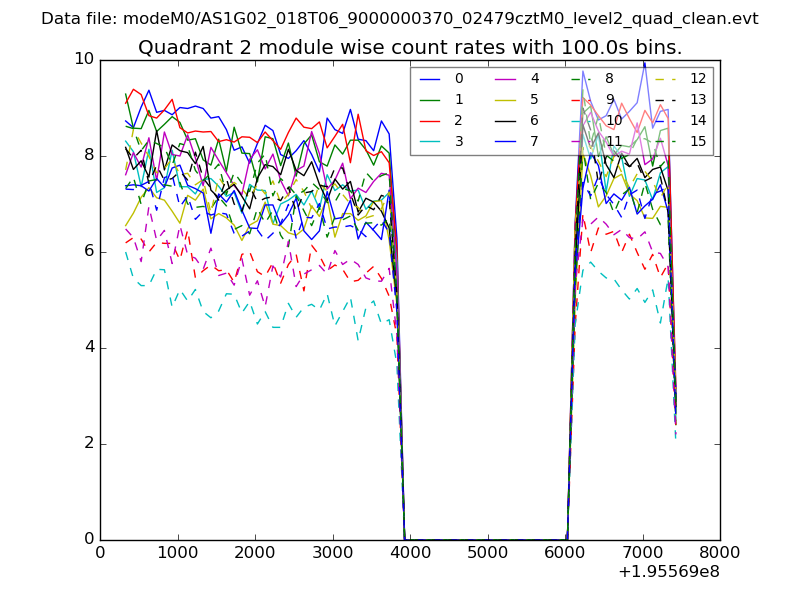
| Module-wise count rates for Quadrant B Data is divided into 100 sec bins |
 |
 |
| Module-wise count rates for Quadrant C Data is divided into 100 sec bins |
 |
 |
| Module-wise count rates for Quadrant D Data is divided into 100 sec bins |
 |
 |
| Parameter | Plot |
|---|---|
| CZT HV Monitor | 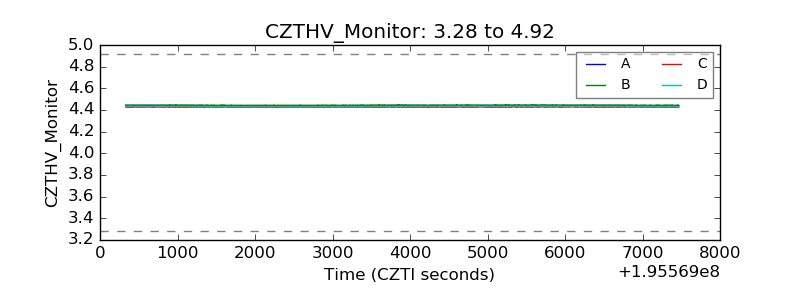 |
| D_VDD | 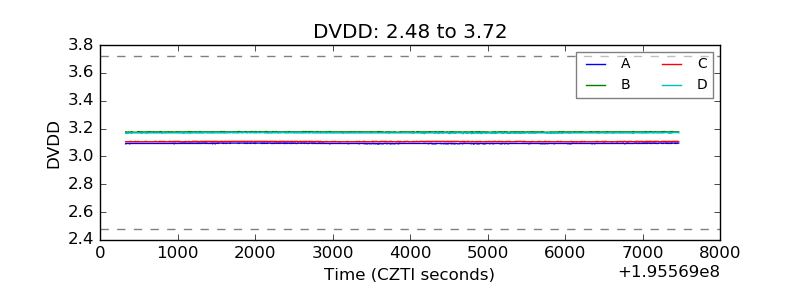 |
| Temperature 1 | 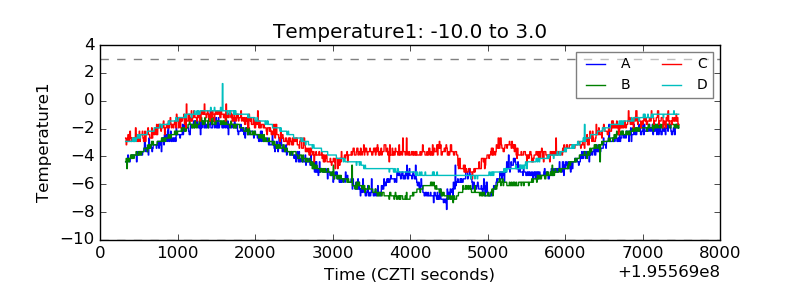 |
| Veto HV Monitor | 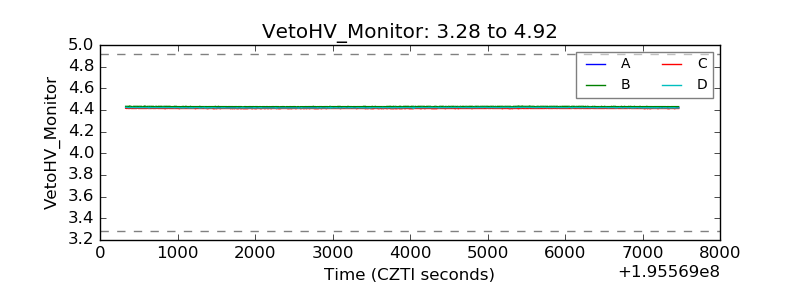 |
| Veto LLD | 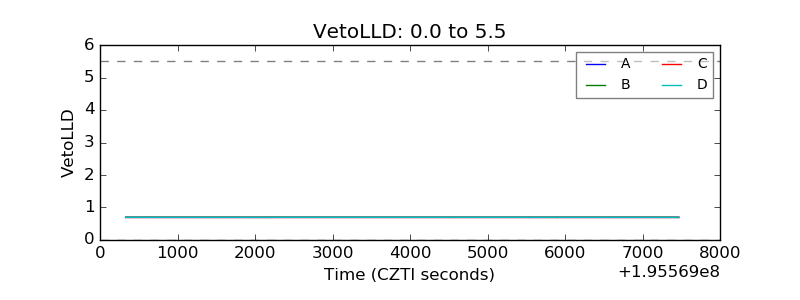 |
| Alpha Counter | 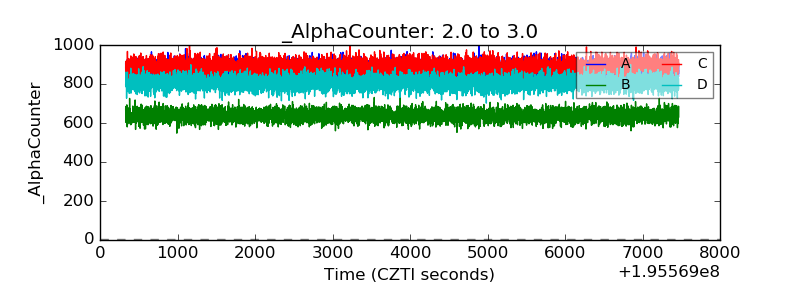 |
| _CPM_Rate | 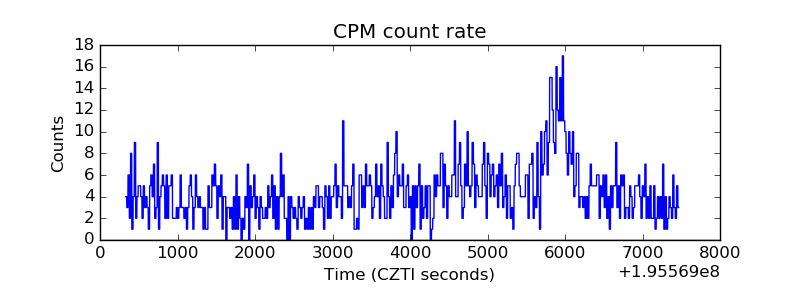 |
| CZT Counter | 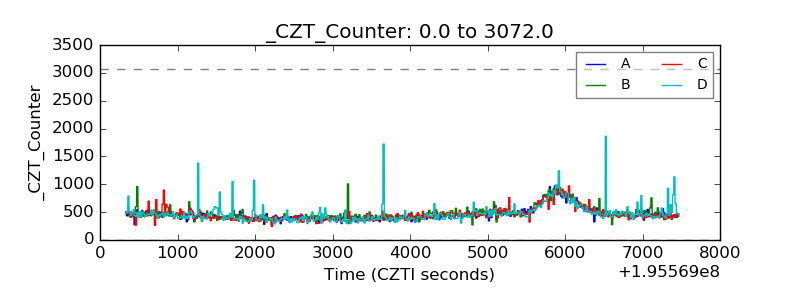 |
| +2.5 Volts monitor |  |
| +5 Volts monitor |  |
| _ROLL_ROT | 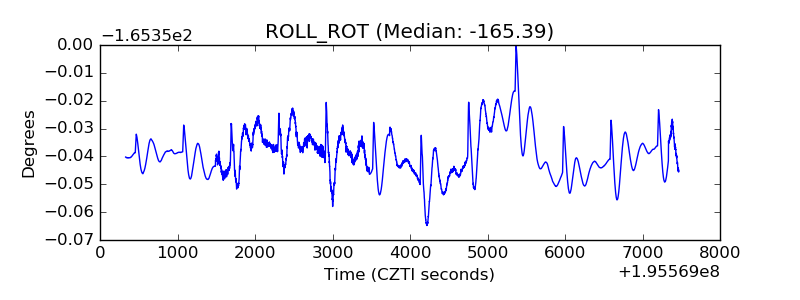 |
| _Roll_DEC | 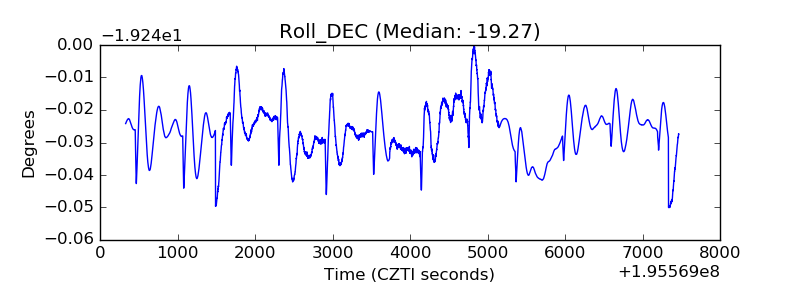 |
| _Roll_RA | 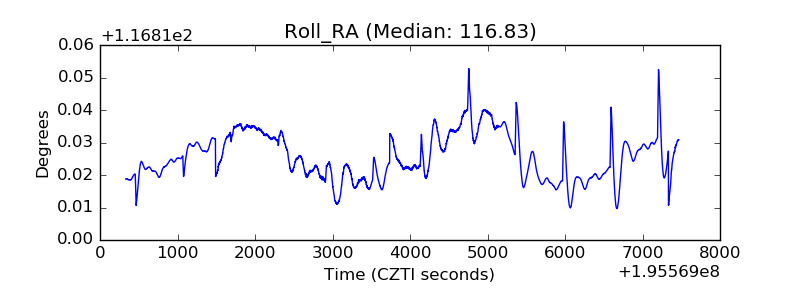 |
| Veto Counter | 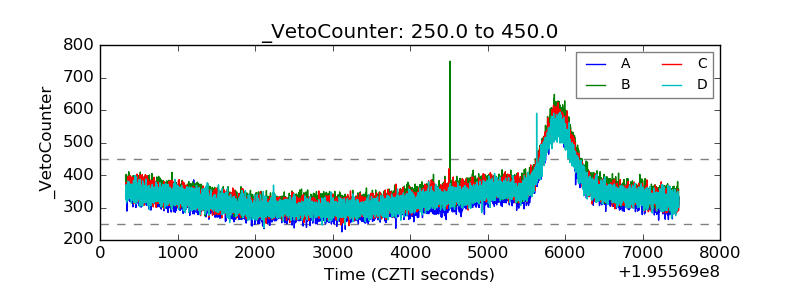 |