| Param | Original file | Final file |
|---|---|---|
| Filename | modeM0/AS1G02_018T06_9000000370_02481cztM0_level2.evt | modeM0/AS1G02_018T06_9000000370_02481cztM0_level2_quad_clean.evt |
| Size (bytes) | 473,276,160 | 99,241,920 |
| Size | 451.4 MB | 94.6 MB |
| Events in quadrant A | 3,407,243 | 615,123 |
| Events in quadrant B | 3,592,312 | 628,361 |
| Events in quadrant C | 3,477,851 | 622,862 |
| Events in quadrant D | 3,335,687 | 607,083 |
| Mode M9 | |||
|---|---|---|---|
| Quadrant | BADHDUFLAG | Total packets | Discarded packets |
| A | 0 | 3 | 0 |
| B | 0 | 3 | 0 |
| C | 0 | 3 | 0 |
| D | 0 | 3 | 0 |
| Mode SS | |||
|---|---|---|---|
| Quadrant | BADHDUFLAG | Total packets | Discarded packets |
| A | 0 | 154 | 0 |
| B | 0 | 154 | 0 |
| C | 0 | 154 | 0 |
| D | 0 | 154 | 0 |
| Mode M0 | |||
|---|---|---|---|
| Quadrant | BADHDUFLAG | Total packets | Discarded packets |
| A | 0 | 15667 | 2 |
| B | 0 | 16004 | 1 |
| C | 0 | 15829 | 1 |
| D | 0 | 15836 | 1 |
| Quadrant | Total seconds | Saturated seconds | Saturation percentage |
|---|---|---|---|
| A | 7653 | 47 | 0.614138% |
| B | 7653 | 79 | 1.032275% |
| C | 7653 | 34 | 0.444270% |
| D | 7653 | 20 | 0.261335% |
Noise dominated data is calculated using 1-second bins in cleaned event files. If a bin has >2000 counts, and if more than 50% of those come from <1% of pixels, then it is considered to be noise-dominated and hence unusable.
| Quadrant | # 1 sec bins | Bins with >0 counts | Bins with >2000 counts | High rate bins dominated by noise | Noise dominated (total time) | Noise dominated (detector-on time) | Marked lightcurve |
|---|---|---|---|---|---|---|---|
| A | 7983 | 7654 | 0 | 0 | 0.00% | 0.00% | 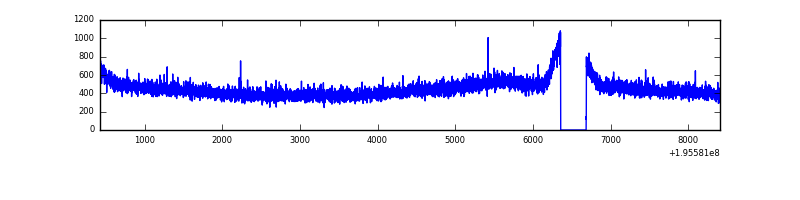 |
| B | 7983 | 7654 | 12 | 12 | 0.15% | 0.16% | 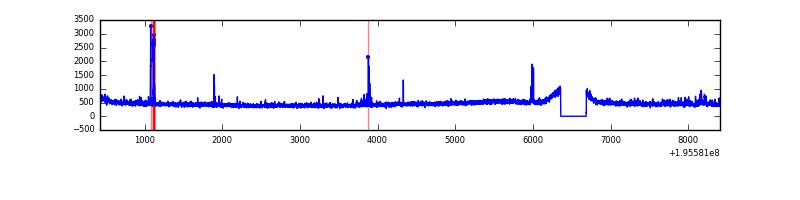 |
| C | 7983 | 7654 | 0 | 0 | 0.00% | 0.00% | 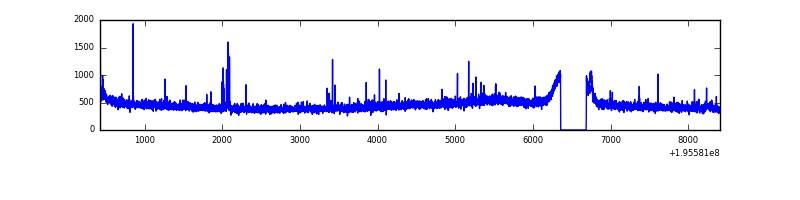 |
| D | 7983 | 7654 | 1 | 1 | 0.01% | 0.01% | 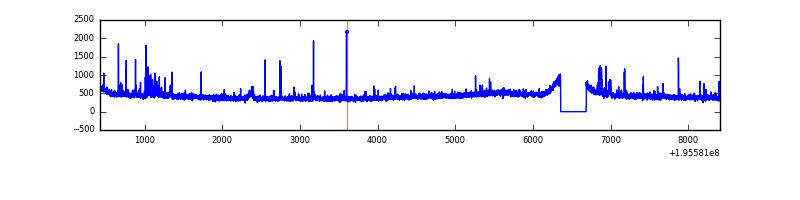 |
Top three noisy pixels from each quadrant. If the there are fewer than three noisy pixels in the level2.evt file, extra rows are filled as -1
| Pixel properties | Quadrant properties | ||||||
|---|---|---|---|---|---|---|---|
| Quadrant | DetID | PixID | Counts | Sigma | Mean | Median | Sigma |
| A | 14 | 63 | 11251 | 57.06 | 880 | 860 | 182.1 |
| A | 12 | 194 | 9992 | 50.15 | 880 | 860 | 182.1 |
| A | 0 | 226 | 9380 | 46.79 | 880 | 860 | 182.1 |
| B | 4 | 48 | 44973 | 254.76 | 892 | 871 | 173.1 |
| B | 0 | 87 | 40396 | 228.32 | 892 | 871 | 173.1 |
| B | 10 | 244 | 35591 | 200.57 | 892 | 871 | 173.1 |
| C | 8 | 112 | 31933 | 155.24 | 853 | 855 | 200.2 |
| C | 10 | 65 | 25848 | 124.84 | 853 | 855 | 200.2 |
| C | 2 | 53 | 15650 | 73.9 | 853 | 855 | 200.2 |
| D | 5 | 172 | 60234 | 293.35 | 847 | 827 | 202.5 |
| D | 2 | 184 | 40139 | 194.12 | 847 | 827 | 202.5 |
| D | 15 | 194 | 15473 | 72.32 | 847 | 827 | 202.5 |
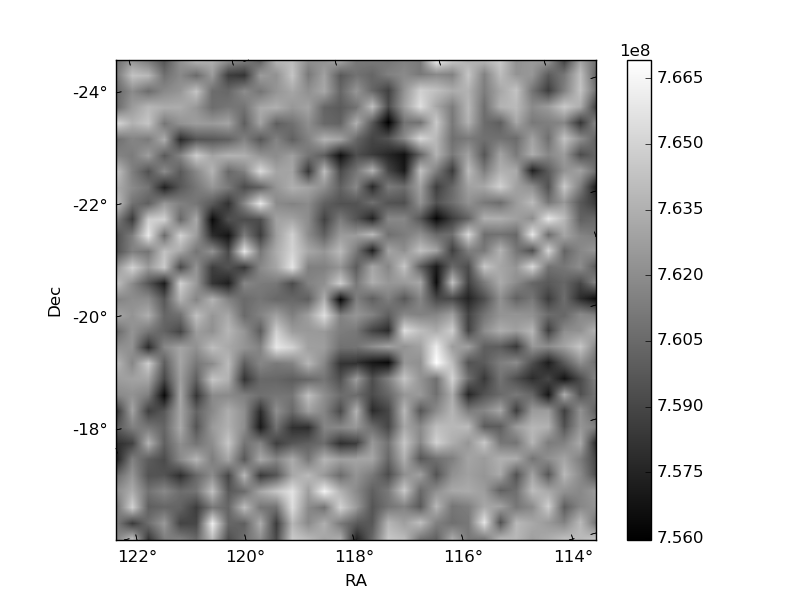
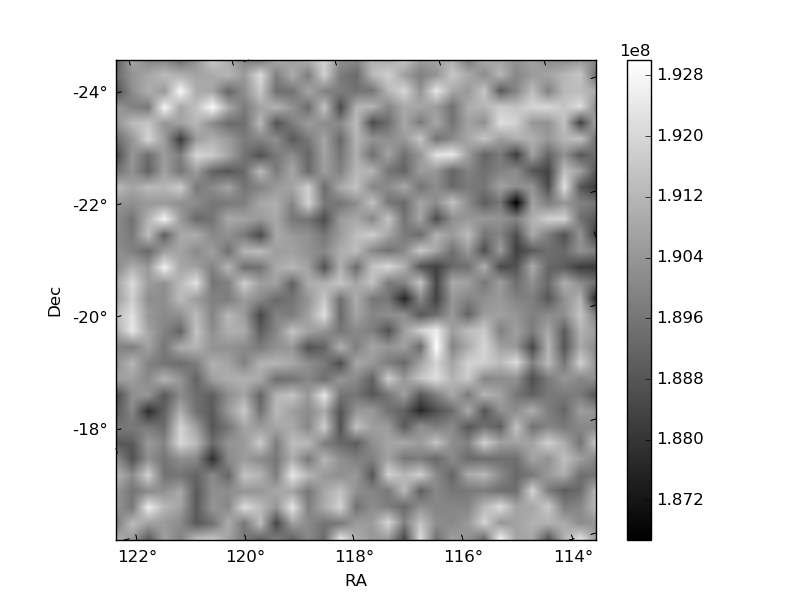
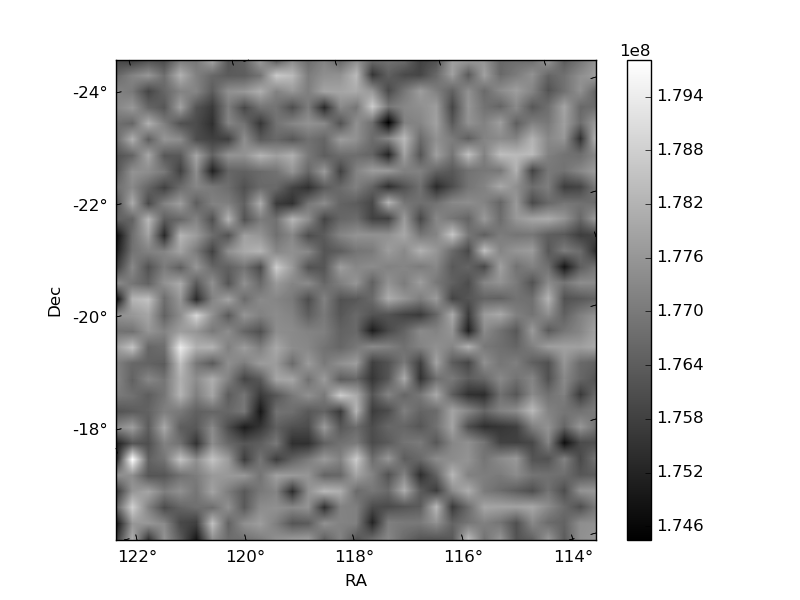
Histogram calculated using DETX and DETY for each event in the final _common_clean file
| Quadrant A | 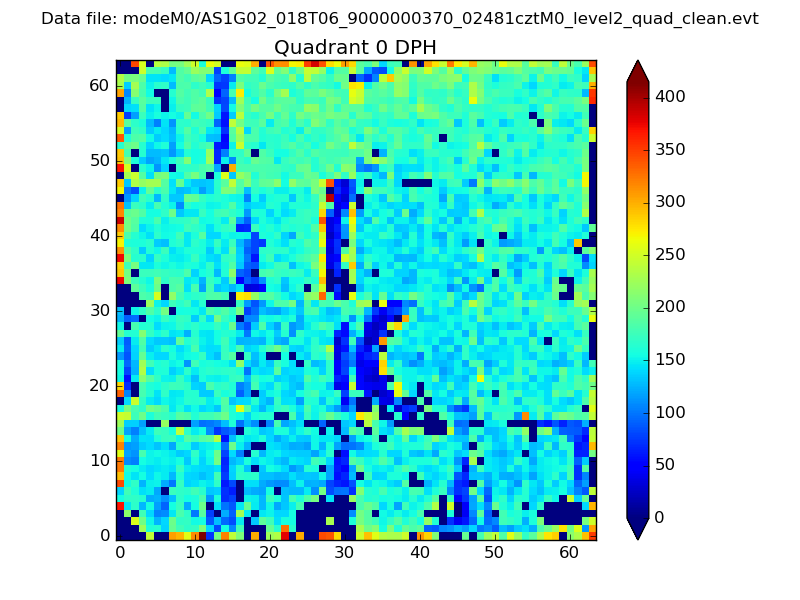 |
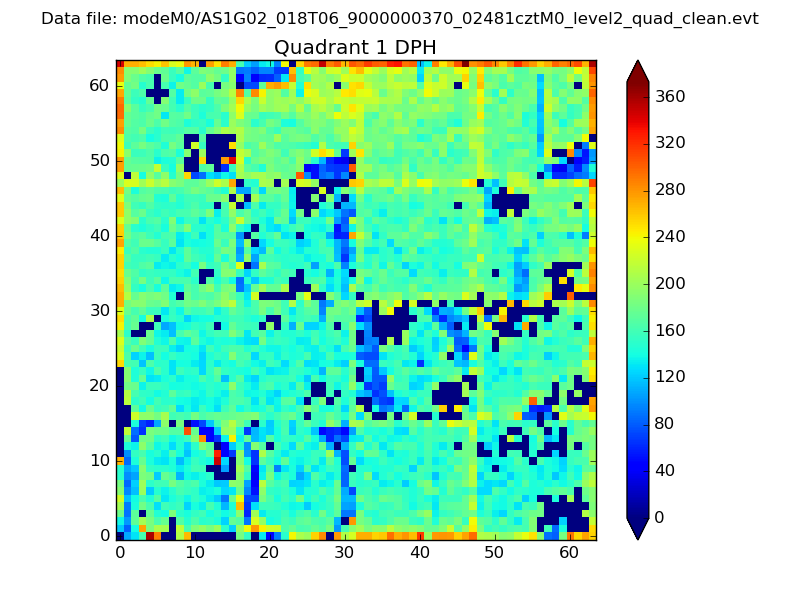 |
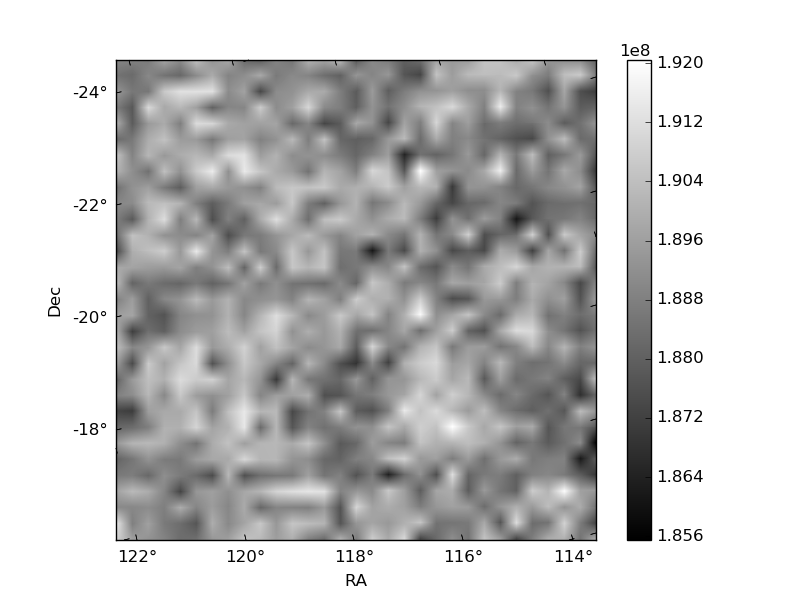
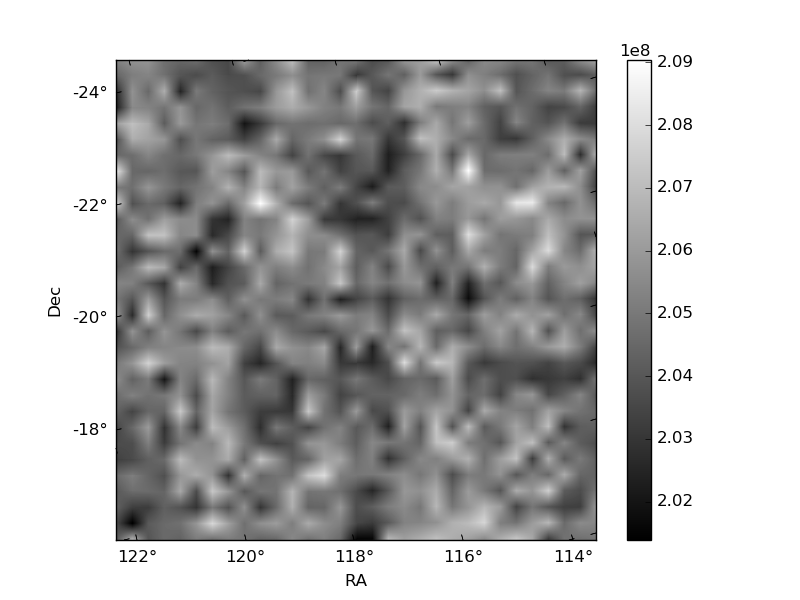
Quadrant B |
|---|---|---|---|
| Quadrant D | 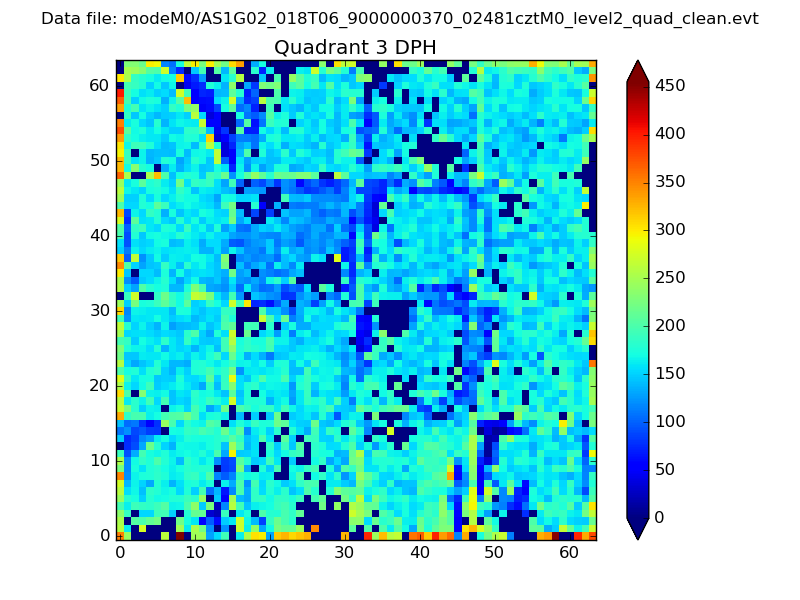 |
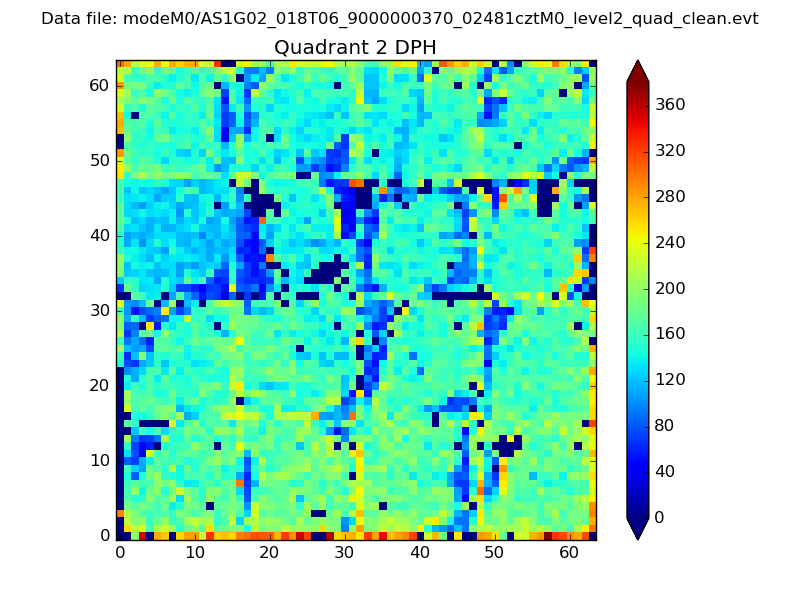 |
Quadrant C |
| Plot type | Count rate plots | Images |
|---|---|---|
| Comparison with Poisson distribution Blue bars denote a histogram of data divided into 1 sec bins. Red curve is a Poisson curve with rate = median count rate of data. |
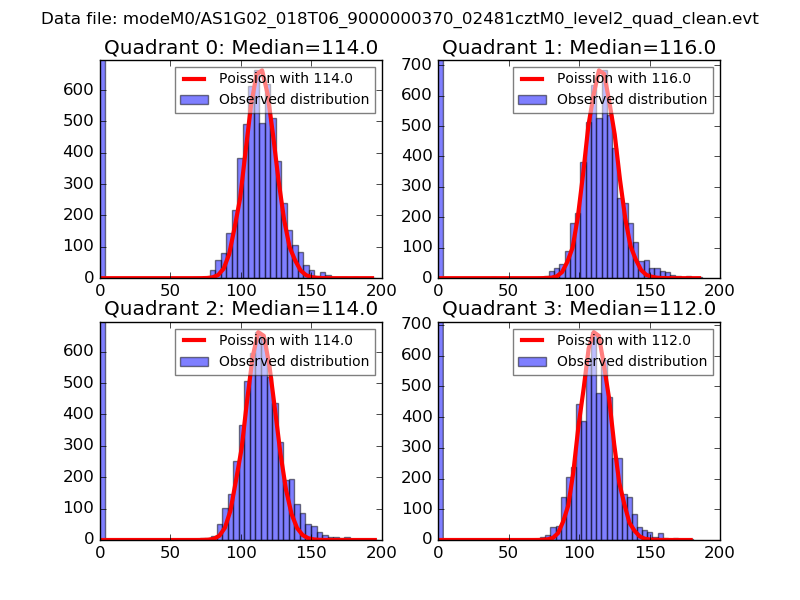 |
 |
| Quadrant-wise count rates Data is divided into 100 sec bins |
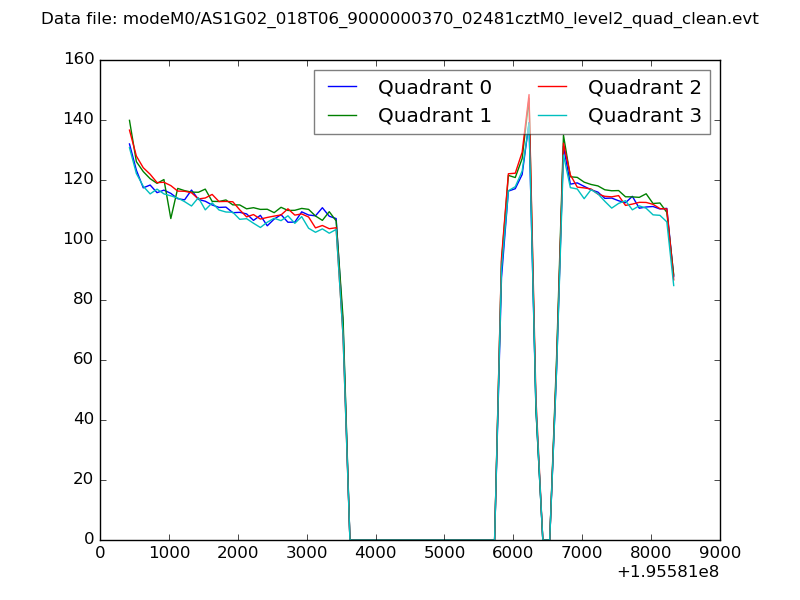 |
|
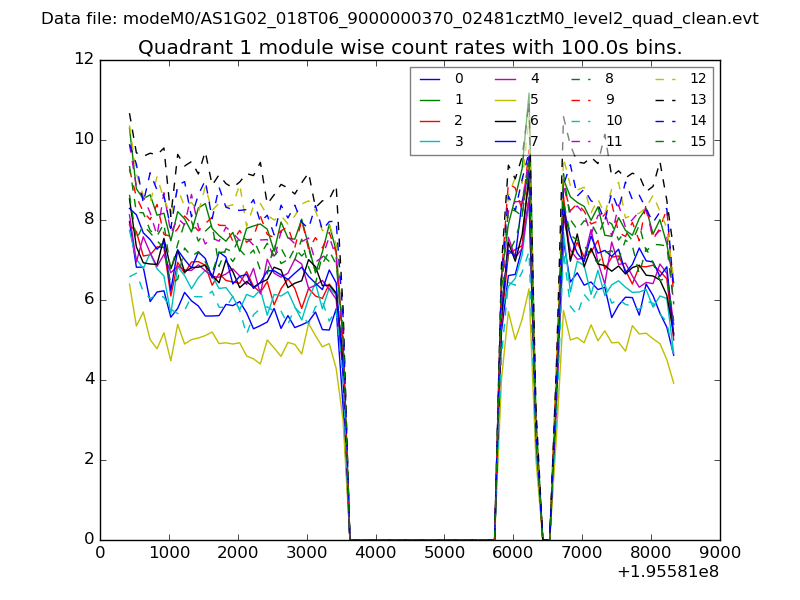
| Module-wise count rates for Quadrant A Data is divided into 100 sec bins |
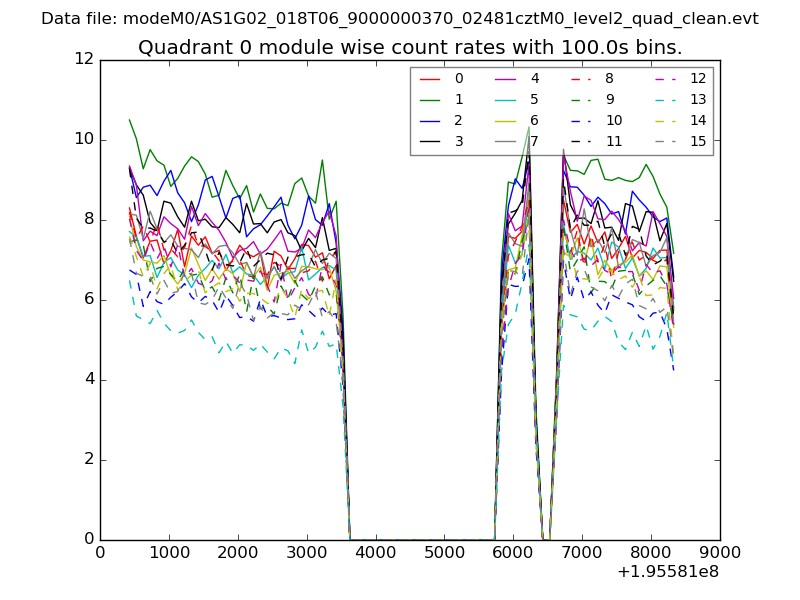 |
 |
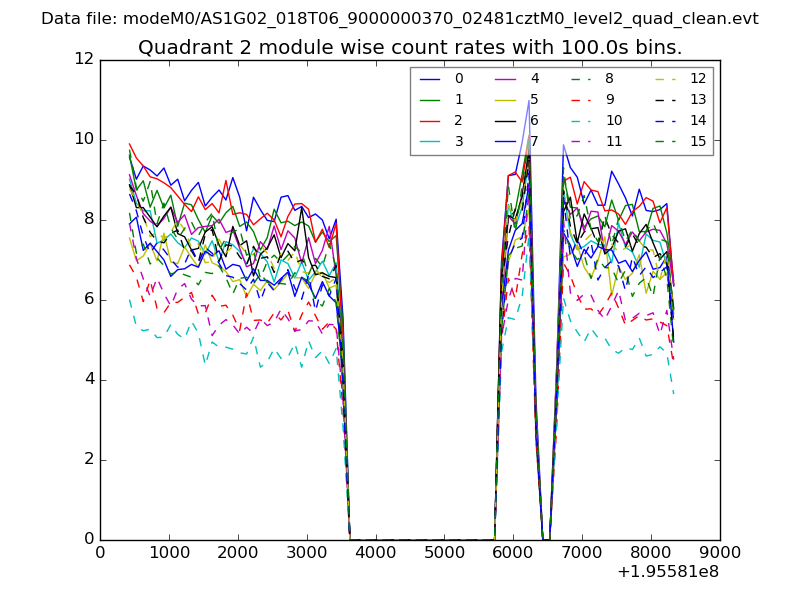
| Module-wise count rates for Quadrant B Data is divided into 100 sec bins |
 |
 |
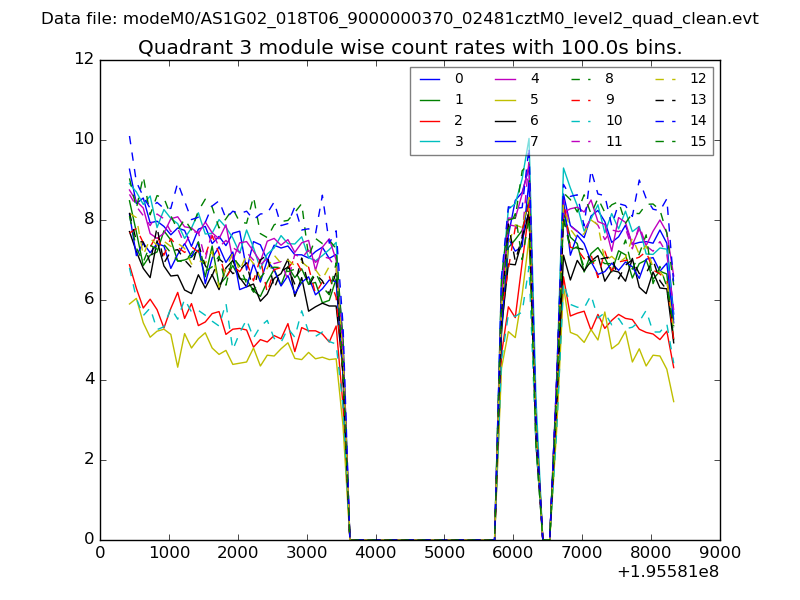
| Module-wise count rates for Quadrant C Data is divided into 100 sec bins |
 |
 |
| Module-wise count rates for Quadrant D Data is divided into 100 sec bins |
 |
 |
| Parameter | Plot |
|---|---|
| CZT HV Monitor | 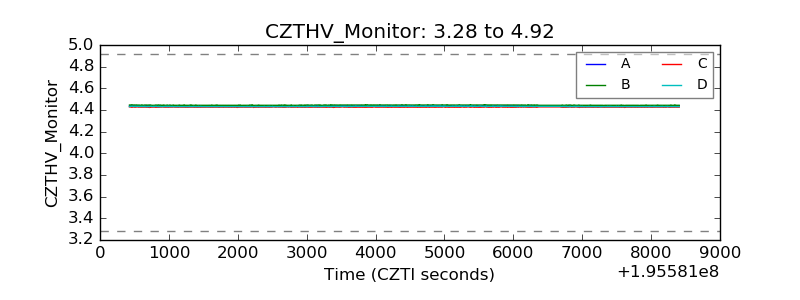 |
| D_VDD | 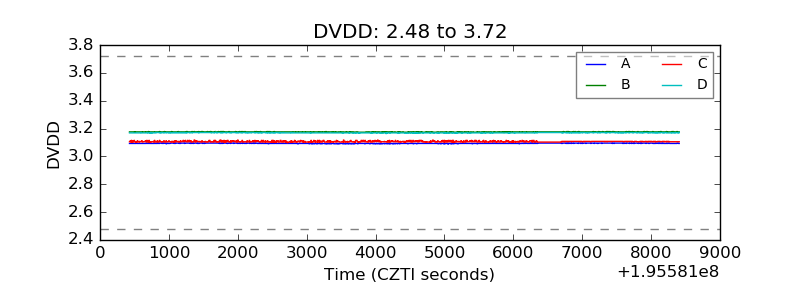 |
| Temperature 1 | 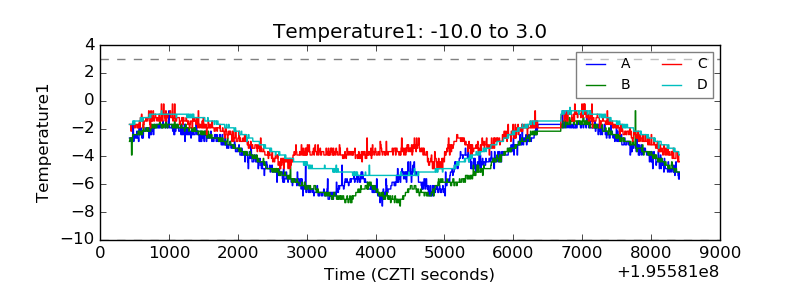 |
| Veto HV Monitor | 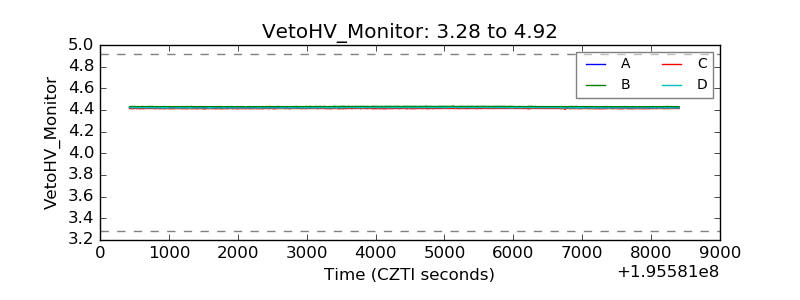 |
| Veto LLD | 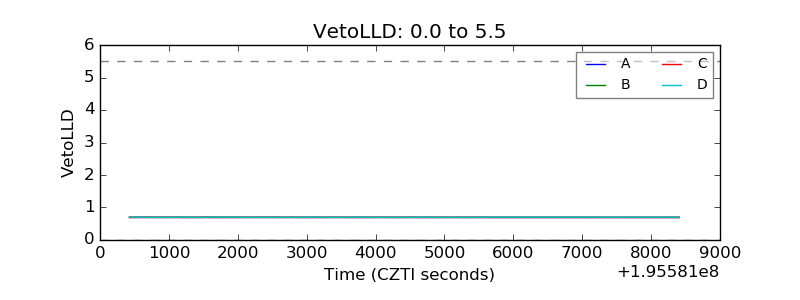 |
| Alpha Counter | 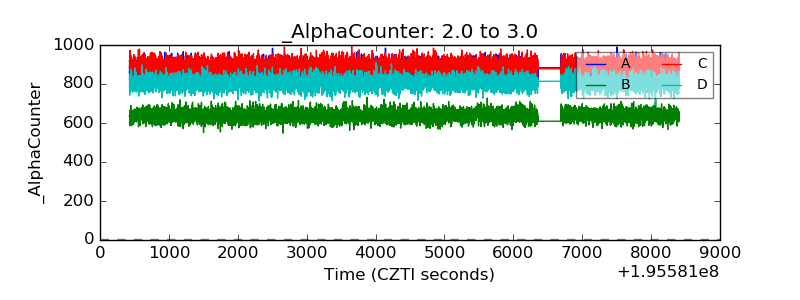 |
| _CPM_Rate | 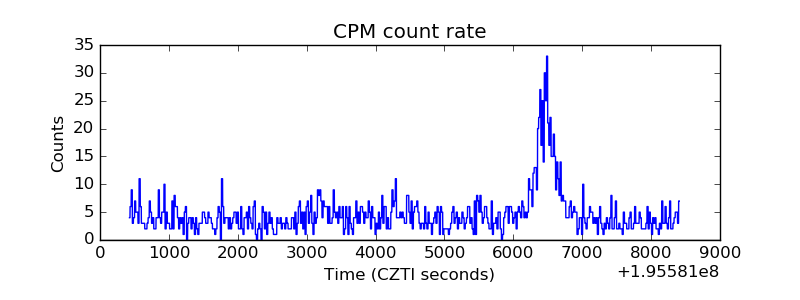 |
| CZT Counter | 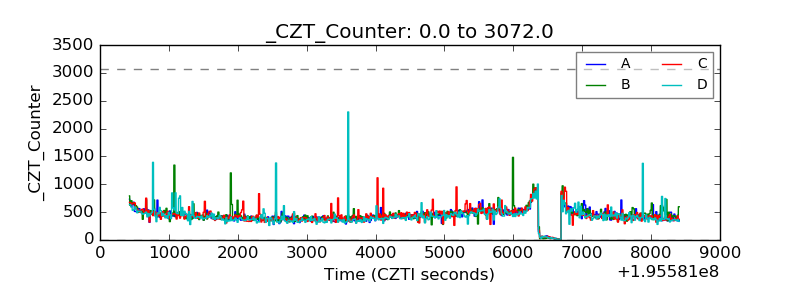 |
| +2.5 Volts monitor | 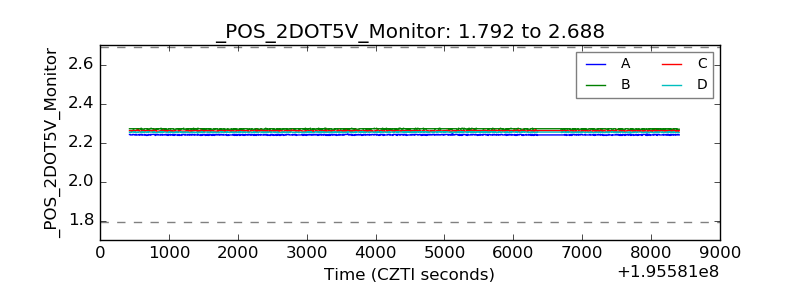 |
| +5 Volts monitor | 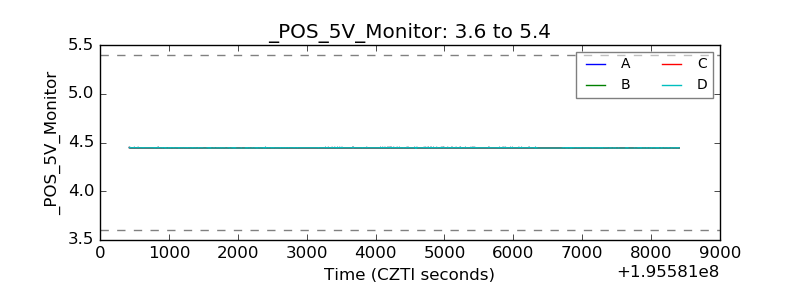 |
| _ROLL_ROT | 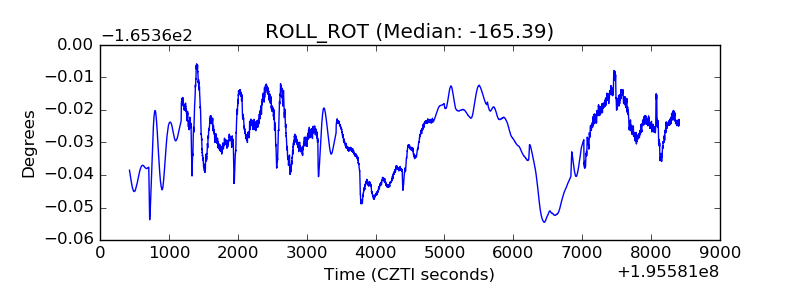 |
| _Roll_DEC | 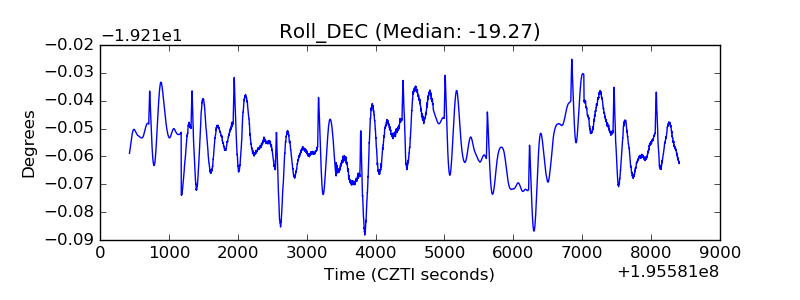 |
| _Roll_RA | 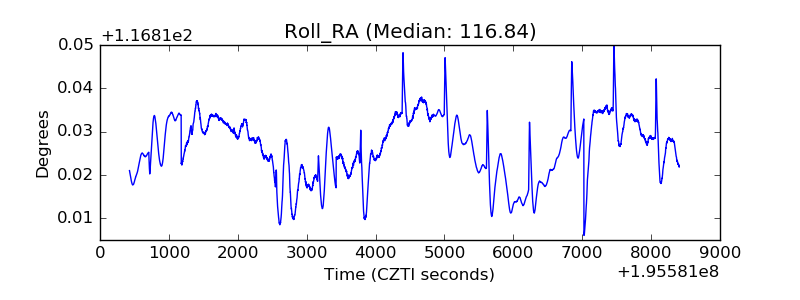 |
| Veto Counter | 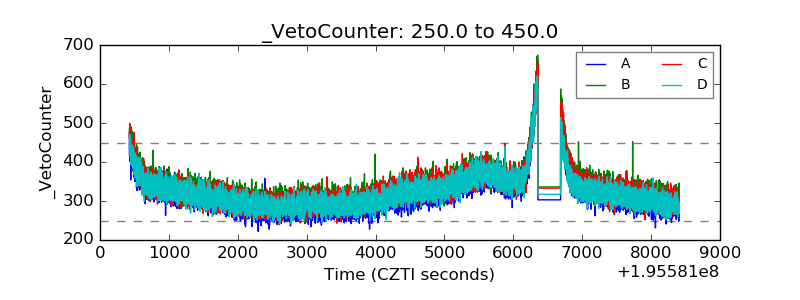 |