| Param | Original file | Final file |
|---|---|---|
| Filename | modeM0/AS1T01_031T01_9000000368cztM0_level2.fits | modeM0/AS1T01_031T01_9000000368cztM0_level2_quad_clean.evt |
| Size (bytes) | 193,351,680 | 197,700,480 |
| Size | 184.4 MB | 188.5 MB |
| Events in quadrant A | 1,150,554 | 1,174,818 |
| Events in quadrant B | 1,112,558 | 1,176,697 |
| Events in quadrant C | 1,130,754 | 1,106,608 |
| Events in quadrant D | 951,220 | 1,019,207 |
| Mode M9 | |||
|---|---|---|---|
| Quadrant | BADHDUFLAG | Total packets | Discarded packets |
| A | 0 | 10 | 0 |
| B | 0 | 10 | 0 |
| C | 0 | 10 | 0 |
| D | 0 | 10 | 0 |
| Mode M0 | |||
|---|---|---|---|
| Quadrant | BADHDUFLAG | Total packets | Discarded packets |
| A | 0 | 45828 | 0 |
| B | 0 | 46193 | 0 |
| C | 0 | 45714 | 0 |
| D | 0 | 54456 | 0 |
| Mode SS | |||
|---|---|---|---|
| Quadrant | BADHDUFLAG | Total packets | Discarded packets |
| A | 0 | 446 | 0 |
| B | 0 | 446 | 0 |
| C | 0 | 446 | 0 |
| D | 0 | 446 | 0 |
| Quadrant | Total seconds | Saturated seconds | Saturation percentage |
|---|---|---|---|
| A | 21934 | 623 | 2.840339% |
| B | 21934 | 645 | 2.940640% |
| C | 21934 | 284 | 1.294793% |
| D | 21934 | 1062 | 4.841798% |
Noise dominated data is calculated using 1-second bins in cleaned event files. If a bin has >2000 counts, and if more than 50% of those come from <1% of pixels, then it is considered to be noise-dominated and hence unusable.
| Quadrant | # 1 sec bins | Bins with >0 counts | Bins with >2000 counts | High rate bins dominated by noise | Noise dominated (total time) | Noise dominated (detector-on time) | Marked lightcurve |
|---|---|---|---|---|---|---|---|
| A | 22914 | 21935 | 0 | 0 | 0.00% | 0.00% |  |
| B | 22914 | 21934 | 0 | 0 | 0.00% | 0.00% | 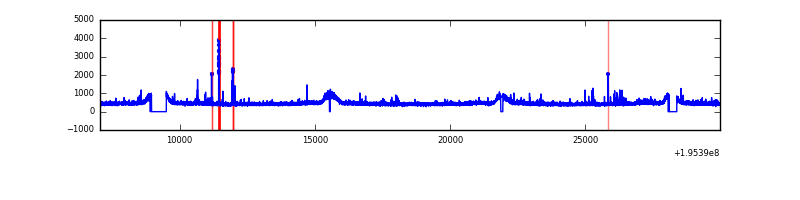 |
| C | 22914 | 21934 | 0 | 0 | 0.00% | 0.00% |  |
| D | 22914 | 21918 | 0 | 0 | 0.00% | 0.00% |  |
Top three noisy pixels from each quadrant. If the there are fewer than three noisy pixels in the level2.evt file, extra rows are filled as -1
| Pixel properties | Quadrant properties | ||||||
|---|---|---|---|---|---|---|---|
| Quadrant | DetID | PixID | Counts | Sigma | Mean | Median | Sigma |
| A | 14 | 188 | 1148 | 10.88 | 297 | 276 | 80.2 |
| A | 0 | 29 | 1089 | 10.14 | 297 | 276 | 80.2 |
| A | 7 | 110 | 1055 | 9.72 | 297 | 276 | 80.2 |
| B | 2 | 9 | 947 | 10.7 | 293 | 276 | 62.7 |
| B | 12 | 226 | 890 | 9.79 | 293 | 276 | 62.7 |
| B | 14 | 254 | 850 | 9.15 | 293 | 276 | 62.7 |
| C | 1 | 81 | 772 | 6.04 | 299 | 274 | 82.5 |
| C | 1 | 80 | 767 | 5.98 | 299 | 274 | 82.5 |
| C | 2 | 127 | 749 | 5.76 | 299 | 274 | 82.5 |
| D | 4 | 160 | 707 | 6.0 | 271 | 246 | 76.9 |
| D | 11 | 82 | 706 | 5.98 | 271 | 246 | 76.9 |
| D | 6 | 231 | 703 | 5.94 | 271 | 246 | 76.9 |
Histogram calculated using DETX and DETY for each event in the final _common_clean file
| Quadrant A | 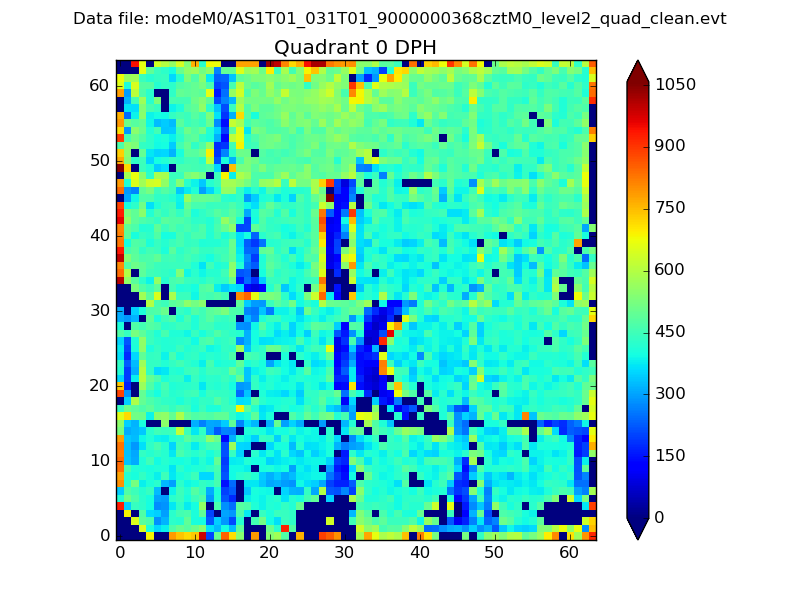 |
 |
Quadrant B |
|---|---|---|---|
| Quadrant D | 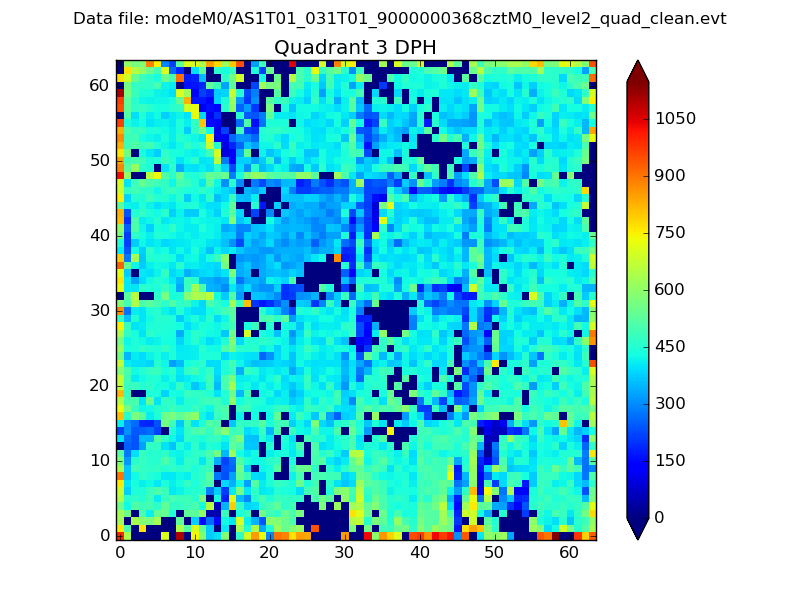 |
 |
Quadrant C |
| Plot type | Count rate plots | Images |
|---|---|---|
| Comparison with Poisson distribution Blue bars denote a histogram of data divided into 1 sec bins. Red curve is a Poisson curve with rate = median count rate of data. |
 |
 |
| Quadrant-wise count rates Data is divided into 100 sec bins |
 |
|
| Module-wise count rates for Quadrant A Data is divided into 100 sec bins |
 |
 |
| Module-wise count rates for Quadrant B Data is divided into 100 sec bins |
 |
 |
| Module-wise count rates for Quadrant C Data is divided into 100 sec bins |
 |
 |
| Module-wise count rates for Quadrant D Data is divided into 100 sec bins |
 |
 |
| Parameter | Plot |
|---|---|
| CZT HV Monitor |  |
| D_VDD | 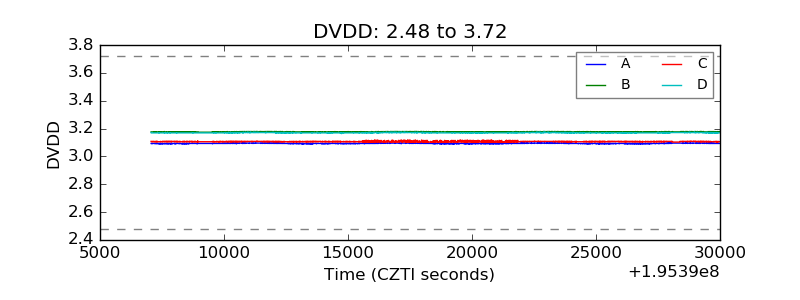 |
| Temperature 1 |  |
| Veto HV Monitor |  |
| Veto LLD | 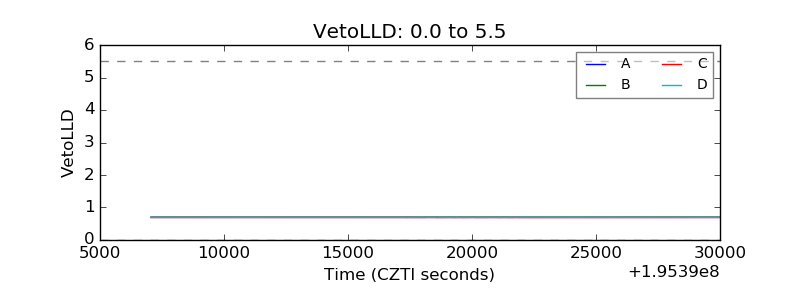 |
| Alpha Counter |  |
| _CPM_Rate | 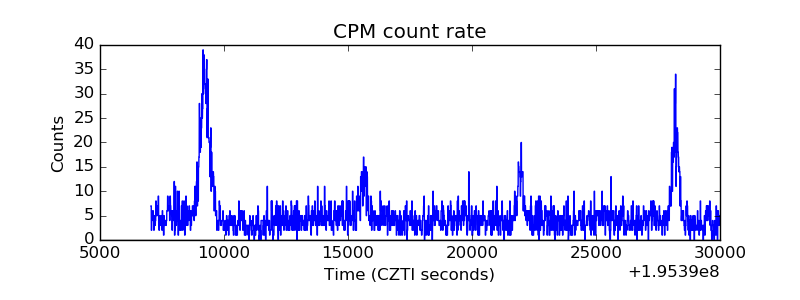 |
| CZT Counter |  |
| +2.5 Volts monitor |  |
| +5 Volts monitor |  |
| _ROLL_ROT |  |
| _Roll_DEC |  |
| _Roll_RA |  |
| Veto Counter |  |