| Param | Original file | Final file |
|---|---|---|
| Filename | modeM0/AS1T01_046T01_9000000372_02485cztM0_level2.fits | modeM0/AS1T01_046T01_9000000372_02485cztM0_level2_quad_clean.evt |
| Size (bytes) | 518,906,880 | 153,918,720 |
| Size | 494.9 MB | 146.8 MB |
| Events in quadrant A | 4,167,596 | 1,024,414 |
| Events in quadrant B | 4,274,085 | 1,060,466 |
| Events in quadrant C | 4,597,823 | 988,570 |
| Events in quadrant D | 5,419,853 | 918,539 |
| Mode M0 | |||
|---|---|---|---|
| Quadrant | BADHDUFLAG | Total packets | Discarded packets |
| A | 0 | 19563 | 3 |
| B | 0 | 19715 | 2 |
| C | 0 | 20888 | 4 |
| D | 0 | 23408 | 2 |
| Mode M9 | |||
|---|---|---|---|
| Quadrant | BADHDUFLAG | Total packets | Discarded packets |
| A | 0 | 18 | 0 |
| B | 0 | 18 | 0 |
| C | 0 | 18 | 0 |
| D | 0 | 18 | 0 |
| Mode SS | |||
|---|---|---|---|
| Quadrant | BADHDUFLAG | Total packets | Discarded packets |
| A | 0 | 198 | 0 |
| B | 0 | 198 | 0 |
| C | 0 | 198 | 0 |
| D | 0 | 198 | 0 |
| Quadrant | Total seconds | Saturated seconds | Saturation percentage |
|---|---|---|---|
| A | 9632 | 31 | 0.321844% |
| B | 9632 | 60 | 0.622924% |
| C | 9631 | 229 | 2.377739% |
| D | 9632 | 250 | 2.595515% |
Noise dominated data is calculated using 1-second bins in cleaned event files. If a bin has >2000 counts, and if more than 50% of those come from <1% of pixels, then it is considered to be noise-dominated and hence unusable.
| Quadrant | # 1 sec bins | Bins with >0 counts | Bins with >2000 counts | High rate bins dominated by noise | Noise dominated (total time) | Noise dominated (detector-on time) | Marked lightcurve |
|---|---|---|---|---|---|---|---|
| A | 11482 | 9634 | 0 | 0 | 0.00% | 0.00% | 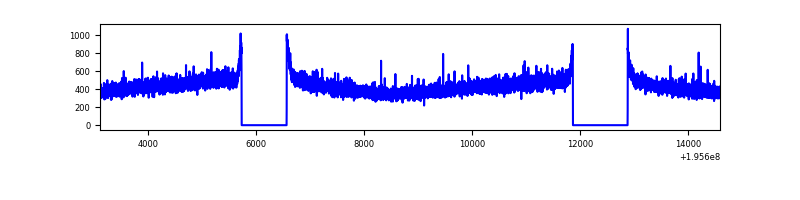 |
| B | 11482 | 9634 | 2 | 2 | 0.02% | 0.02% | 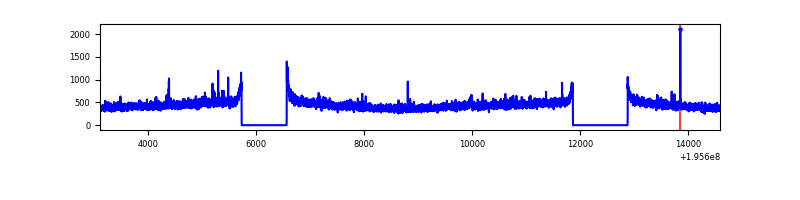 |
| C | 11482 | 9634 | 176 | 176 | 1.53% | 1.83% | 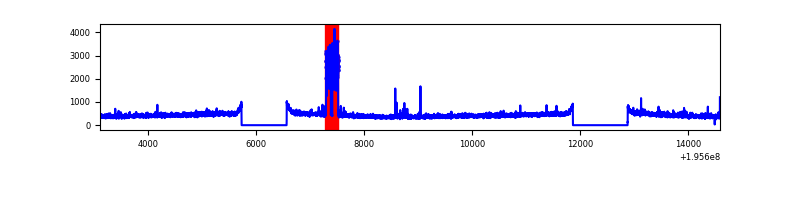 |
| D | 11482 | 9634 | 205 | 205 | 1.79% | 2.13% | 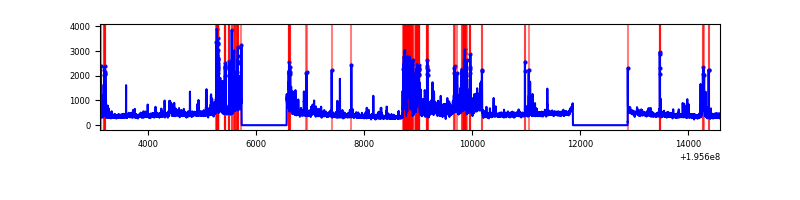 |
Top three noisy pixels from each quadrant. If the there are fewer than three noisy pixels in the level2.evt file, extra rows are filled as -1
| Pixel properties | Quadrant properties | ||||||
|---|---|---|---|---|---|---|---|
| Quadrant | DetID | PixID | Counts | Sigma | Mean | Median | Sigma |
| A | 14 | 63 | 17166 | 73.28 | 1073 | 1046 | 220.0 |
| A | 8 | 15 | 13212 | 55.31 | 1073 | 1046 | 220.0 |
| A | 12 | 194 | 11763 | 48.72 | 1073 | 1046 | 220.0 |
| B | 4 | 200 | 34114 | 158.07 | 1093 | 1065 | 209.1 |
| B | 12 | 111 | 15481 | 68.95 | 1093 | 1065 | 209.1 |
| B | 11 | 111 | 13192 | 58.0 | 1093 | 1065 | 209.1 |
| C | 2 | 53 | 459781 | 1910.28 | 1033 | 1040 | 240.1 |
| C | 10 | 65 | 61785 | 252.95 | 1033 | 1040 | 240.1 |
| C | 8 | 112 | 15087 | 58.49 | 1033 | 1040 | 240.1 |
| D | 2 | 184 | 1186397 | 4876.51 | 1020 | 994 | 243.1 |
| D | 7 | 67 | 253215 | 1037.59 | 1020 | 994 | 243.1 |
| D | 9 | 64 | 31986 | 127.49 | 1020 | 994 | 243.1 |
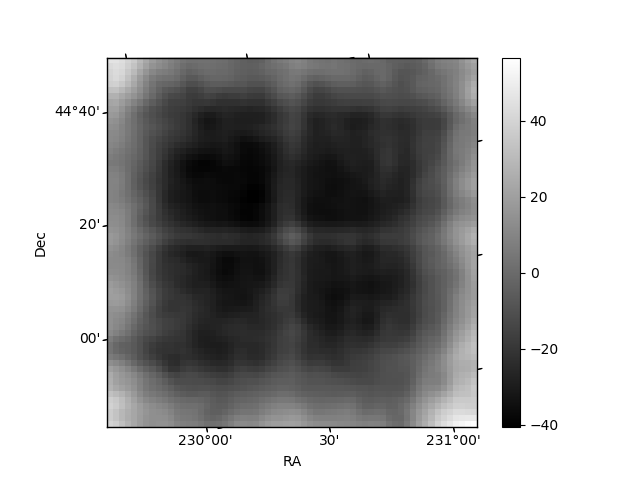
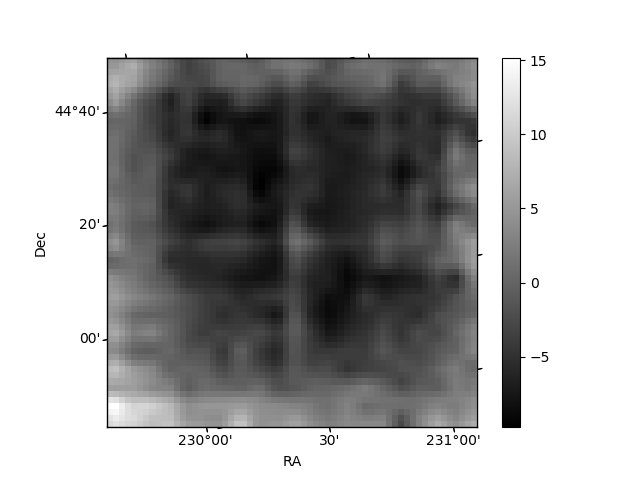
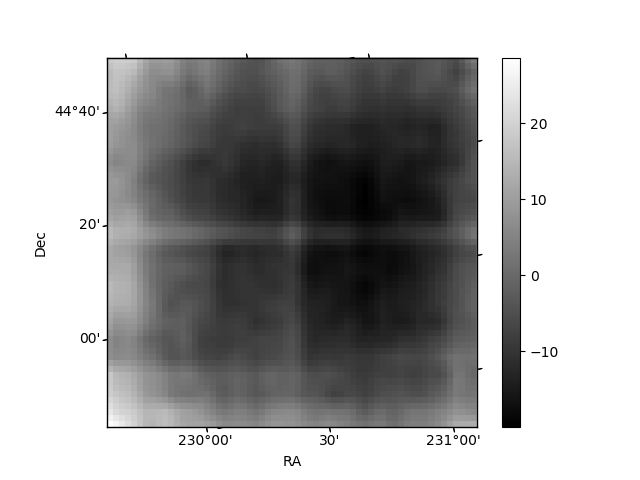
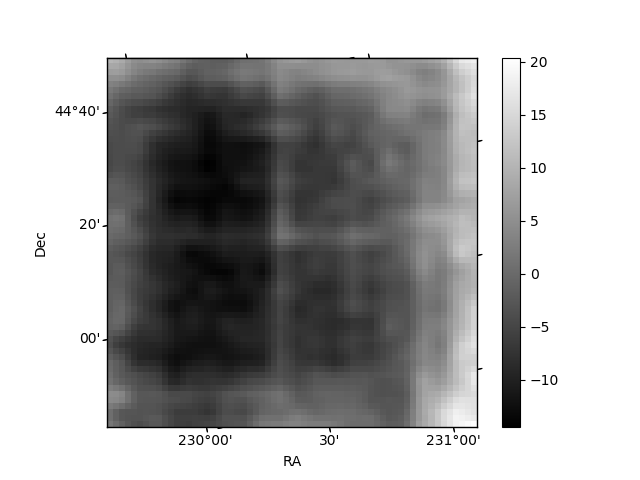
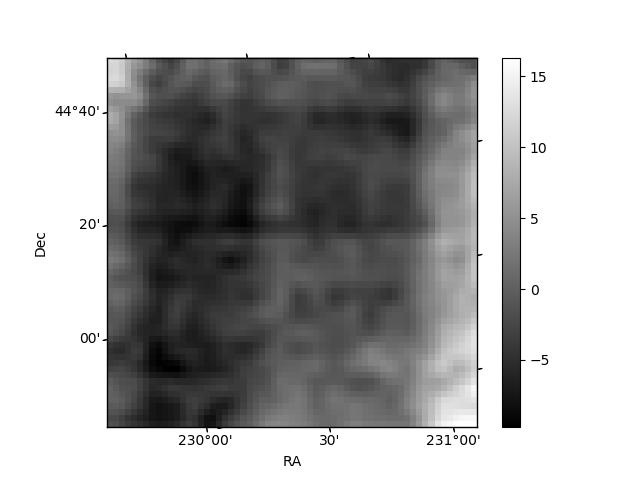
Histogram calculated using DETX and DETY for each event in the final _common_clean file
| Quadrant A | 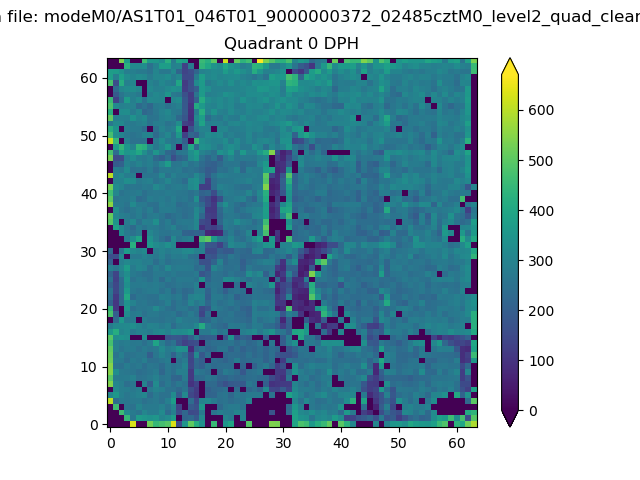 |
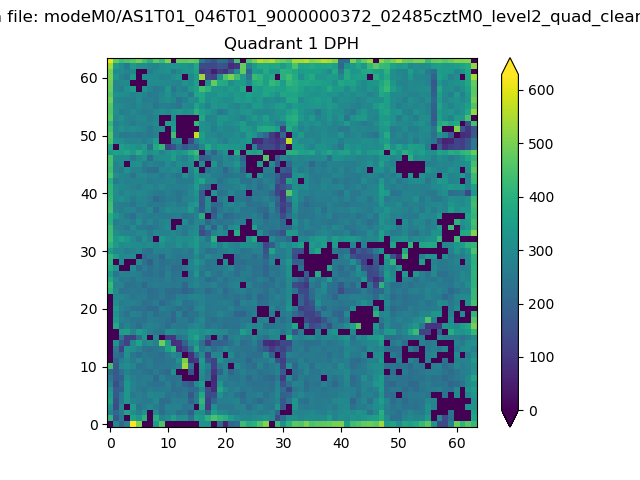 |
Quadrant B |
|---|---|---|---|
| Quadrant D | 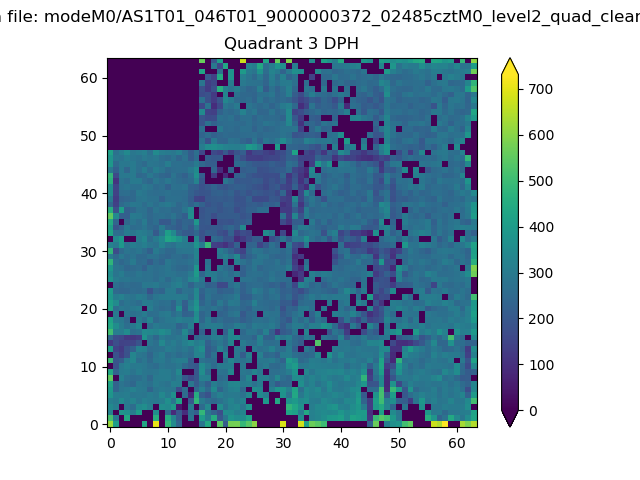 |
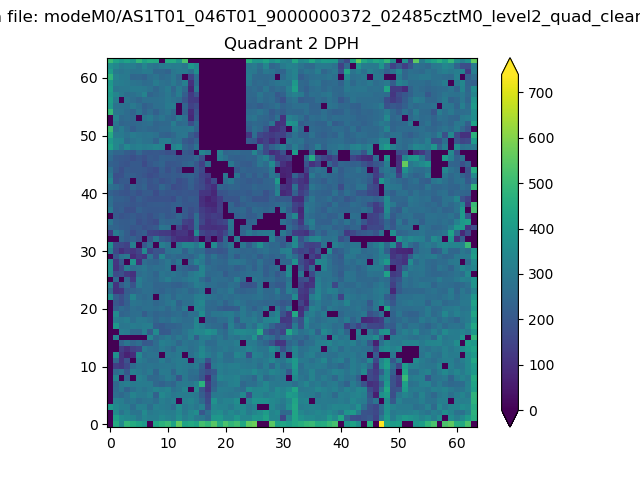 |
Quadrant C |
| Plot type | Count rate plots | Images |
|---|---|---|
| Comparison with Poisson distribution Blue bars denote a histogram of data divided into 1 sec bins. Red curve is a Poisson curve with rate = median count rate of data. |
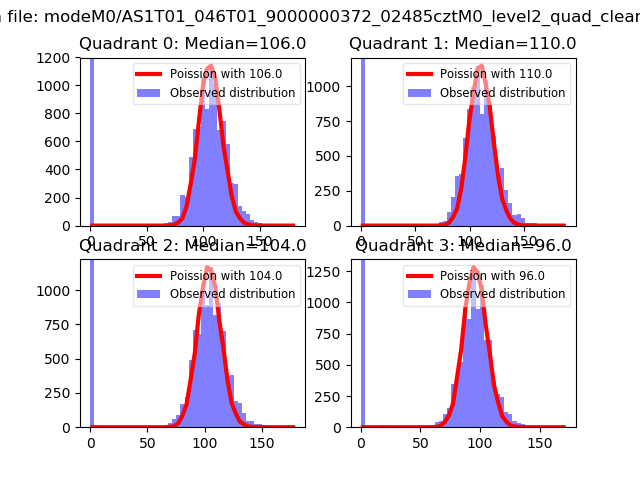 |
 |
| Quadrant-wise count rates Data is divided into 100 sec bins |
 |
|
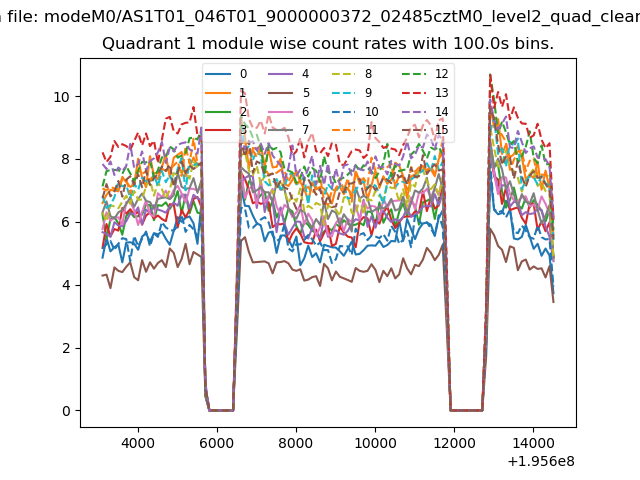
| Module-wise count rates for Quadrant A Data is divided into 100 sec bins |
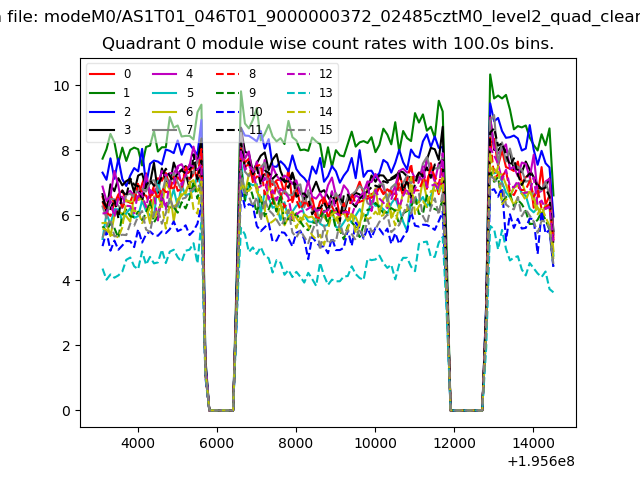 |
 |
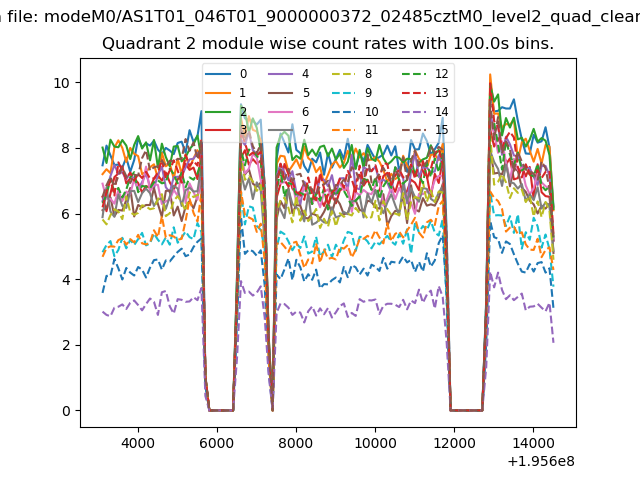
| Module-wise count rates for Quadrant B Data is divided into 100 sec bins |
 |
 |
| Module-wise count rates for Quadrant C Data is divided into 100 sec bins |
 |
 |
| Module-wise count rates for Quadrant D Data is divided into 100 sec bins |
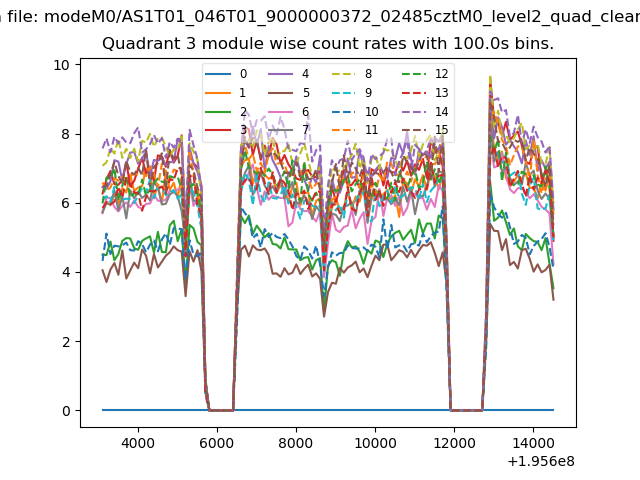 |
 |
| Parameter | Plot |
|---|---|
| CZT HV Monitor | 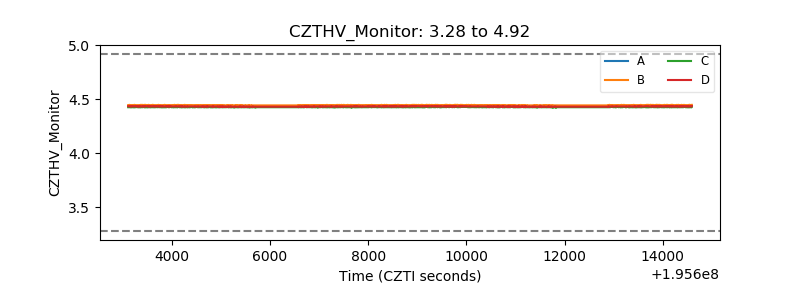 |
| D_VDD | 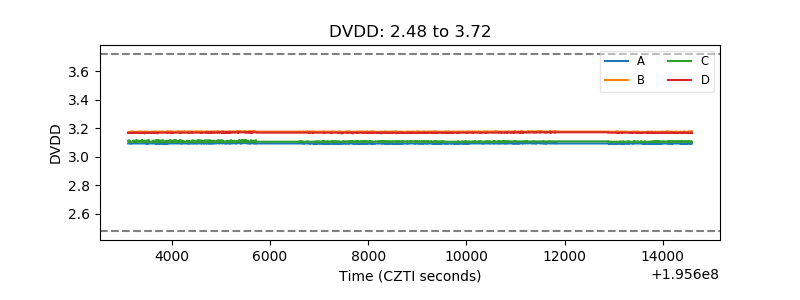 |
| Temperature 1 | 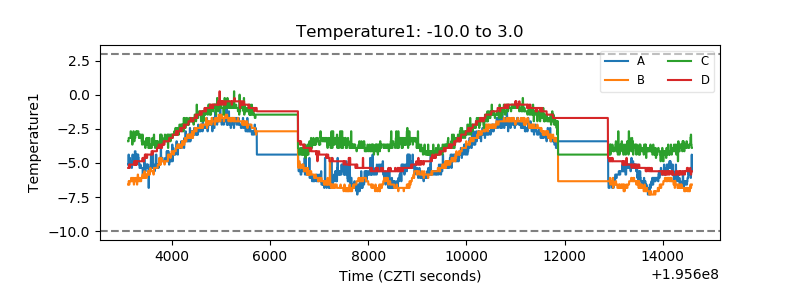 |
| Veto HV Monitor | 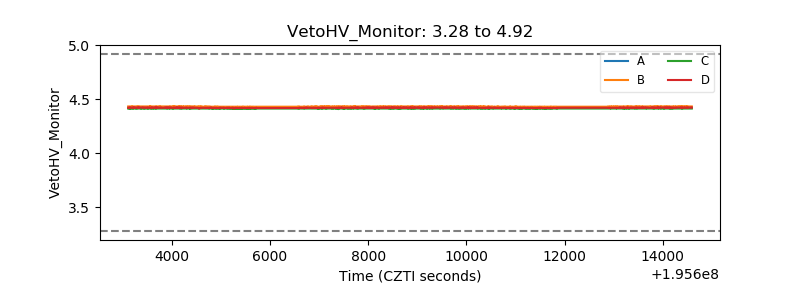 |
| Veto LLD | 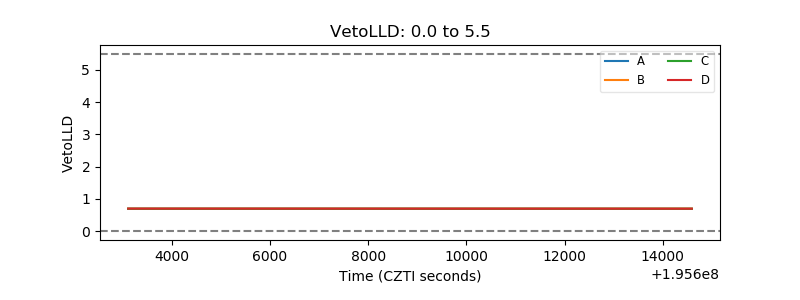 |
| Alpha Counter | 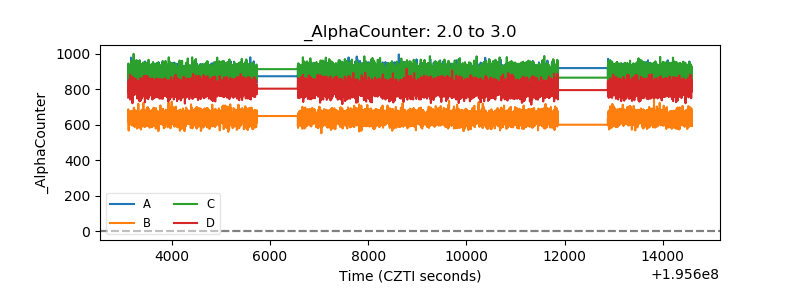 |
| _CPM_Rate | 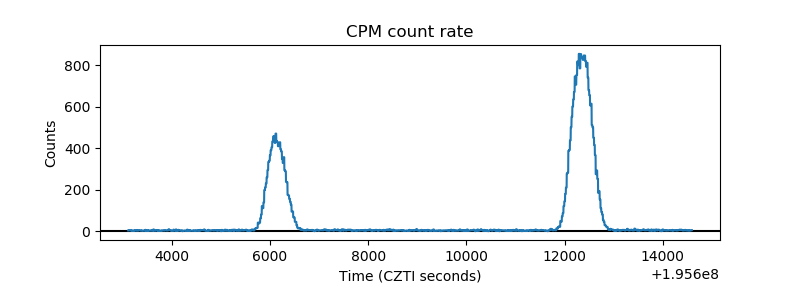 |
| CZT Counter | 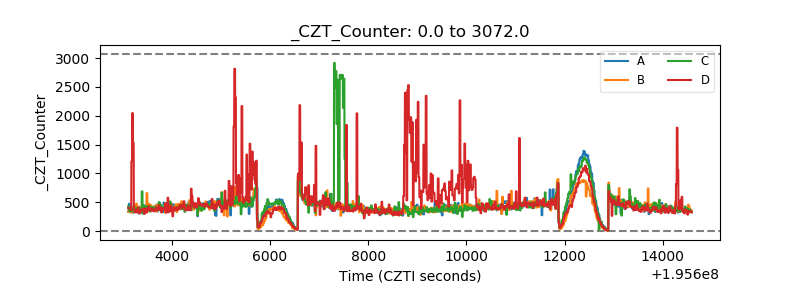 |
| +2.5 Volts monitor |  |
| +5 Volts monitor | 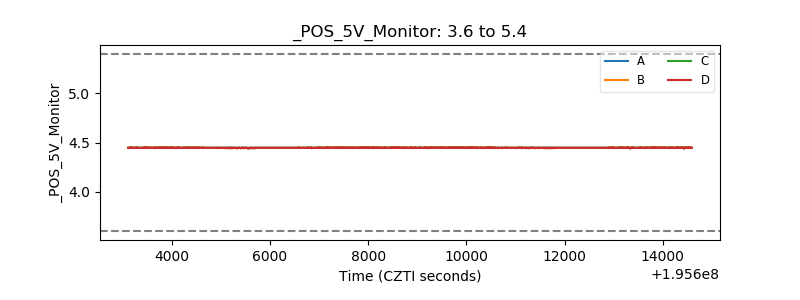 |
| _ROLL_ROT | 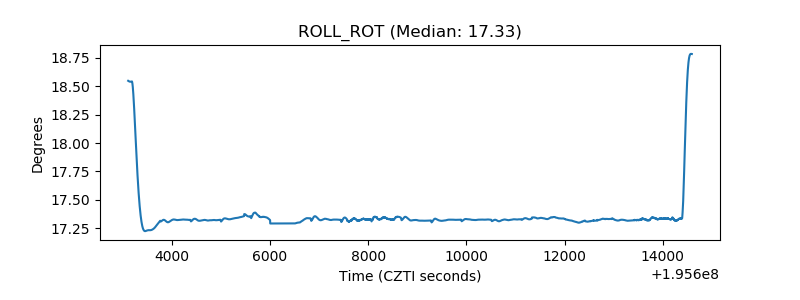 |
| _Roll_DEC | 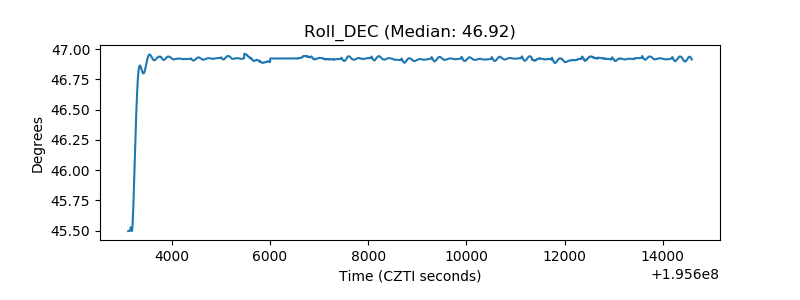 |
| _Roll_RA | 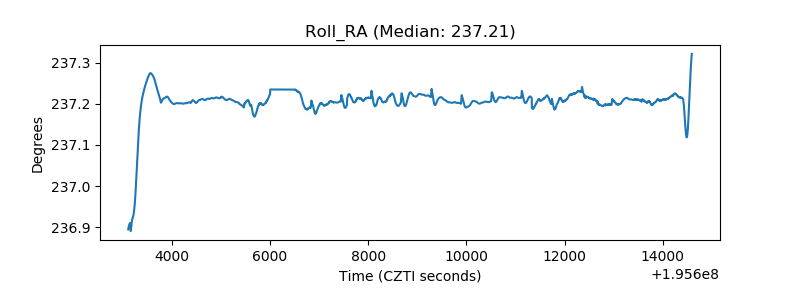 |
| Veto Counter | 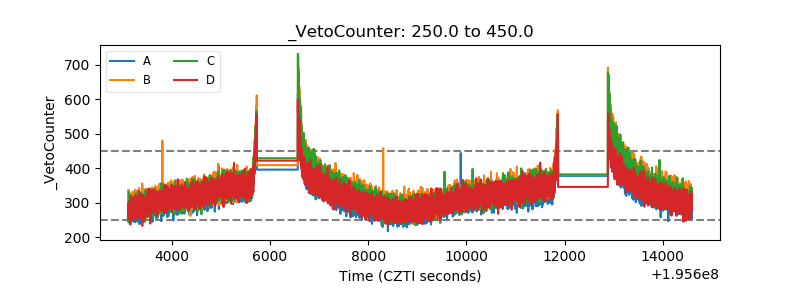 |