| Param | Original file | Final file |
|---|---|---|
| Filename | modeM0/AS1SLEW_01234_9000000371_02485cztM0_level2.evt | modeM0/AS1SLEW_01234_9000000371_02485cztM0_level2_quad_clean.evt |
| Size (bytes) | 81,224,640 | 21,015,360 |
| Size | 77.5 MB | 20.0 MB |
| Events in quadrant A | 530,911 | 132,798 |
| Events in quadrant B | 569,908 | 133,159 |
| Events in quadrant C | 550,018 | 133,481 |
| Events in quadrant D | 707,853 | 129,377 |
| Mode M0 | |||
|---|---|---|---|
| Quadrant | BADHDUFLAG | Total packets | Discarded packets |
| A | 0 | 2883 | 0 |
| B | 0 | 2930 | 0 |
| C | 0 | 2891 | 0 |
| D | 0 | 3349 | 0 |
| Mode SS | |||
|---|---|---|---|
| Quadrant | BADHDUFLAG | Total packets | Discarded packets |
| A | 0 | 28 | 0 |
| B | 0 | 28 | 0 |
| C | 0 | 28 | 0 |
| D | 0 | 28 | 0 |
| Quadrant | Total seconds | Saturated seconds | Saturation percentage |
|---|---|---|---|
| A | 1442 | 0 | 0.000000% |
| B | 1442 | 1 | 0.069348% |
| C | 1442 | 1 | 0.069348% |
| D | 1442 | 33 | 2.288488% |
Noise dominated data is calculated using 1-second bins in cleaned event files. If a bin has >2000 counts, and if more than 50% of those come from <1% of pixels, then it is considered to be noise-dominated and hence unusable.
| Quadrant | # 1 sec bins | Bins with >0 counts | Bins with >2000 counts | High rate bins dominated by noise | Noise dominated (total time) | Noise dominated (detector-on time) | Marked lightcurve |
|---|---|---|---|---|---|---|---|
| A | 1442 | 1442 | 0 | 0 | 0.00% | 0.00% | 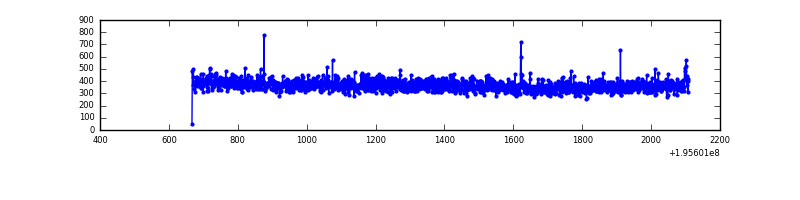 |
| B | 1442 | 1442 | 2 | 2 | 0.14% | 0.14% | 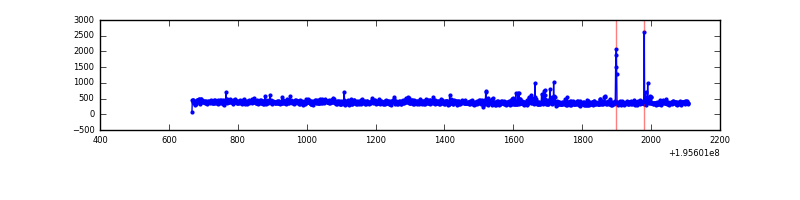 |
| C | 1442 | 1442 | 0 | 0 | 0.00% | 0.00% | 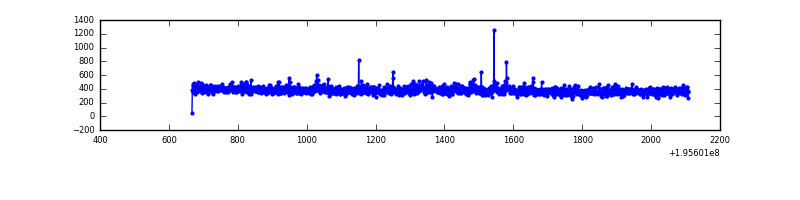 |
| D | 1442 | 1442 | 41 | 41 | 2.84% | 2.84% | 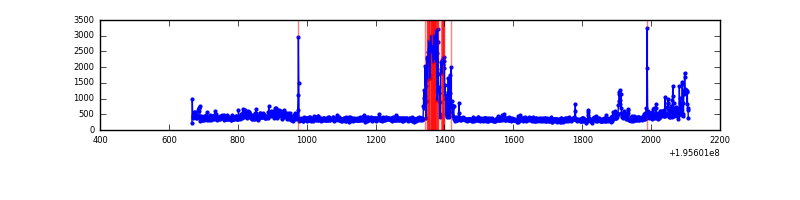 |
Top three noisy pixels from each quadrant. If the there are fewer than three noisy pixels in the level2.evt file, extra rows are filled as -1
| Pixel properties | Quadrant properties | ||||||
|---|---|---|---|---|---|---|---|
| Quadrant | DetID | PixID | Counts | Sigma | Mean | Median | Sigma |
| A | 3 | 254 | 2701 | 85.48 | 136 | 133 | 30.0 |
| A | 14 | 63 | 2283 | 71.57 | 136 | 133 | 30.0 |
| A | 12 | 194 | 1466 | 44.37 | 136 | 133 | 30.0 |
| B | 10 | 244 | 27757 | 950.44 | 140 | 136 | 29.1 |
| B | 5 | 6 | 2410 | 78.25 | 140 | 136 | 29.1 |
| B | 12 | 111 | 2126 | 68.48 | 140 | 136 | 29.1 |
| C | 8 | 112 | 8354 | 244.25 | 135 | 135 | 33.7 |
| C | 10 | 65 | 4648 | 134.11 | 135 | 135 | 33.7 |
| C | 12 | 4 | 4246 | 122.17 | 135 | 135 | 33.7 |
| D | 7 | 67 | 146592 | 4502.83 | 128 | 125 | 32.5 |
| D | 2 | 184 | 48349 | 1482.55 | 128 | 125 | 32.5 |
| D | 13 | 53 | 10499 | 318.93 | 128 | 125 | 32.5 |
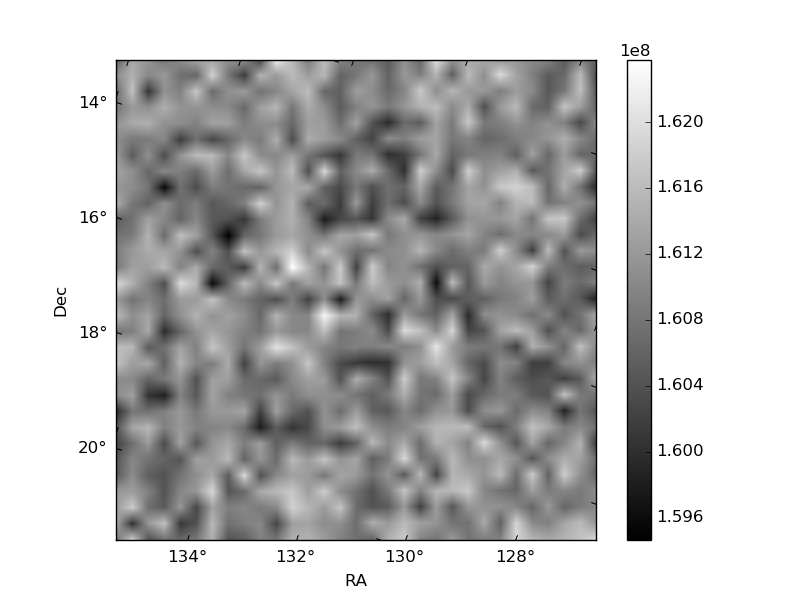
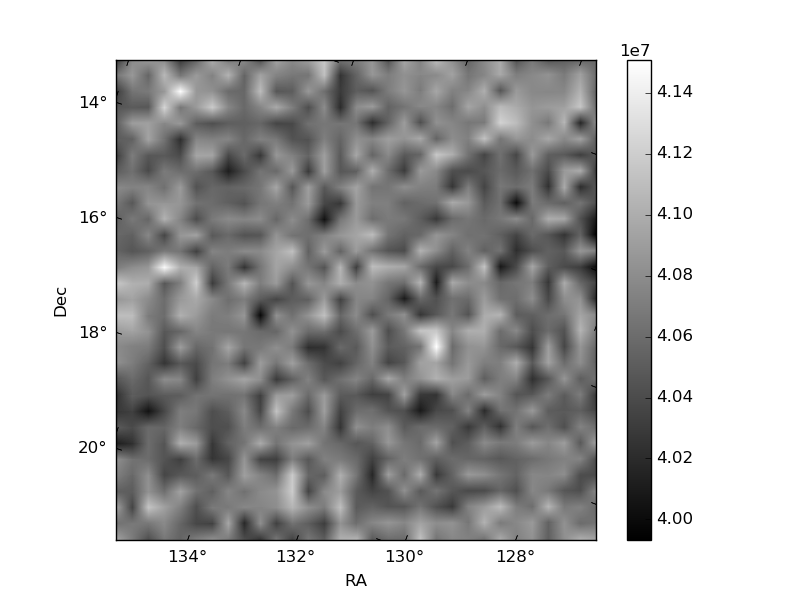
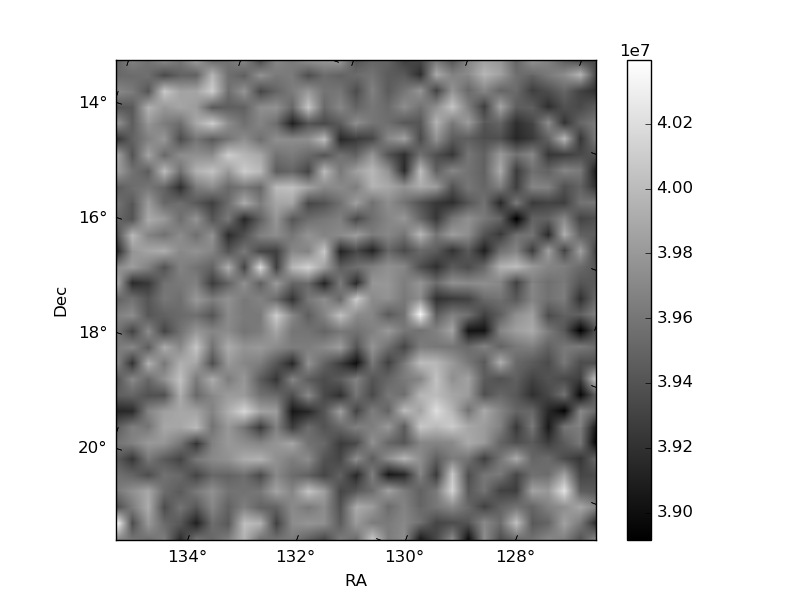
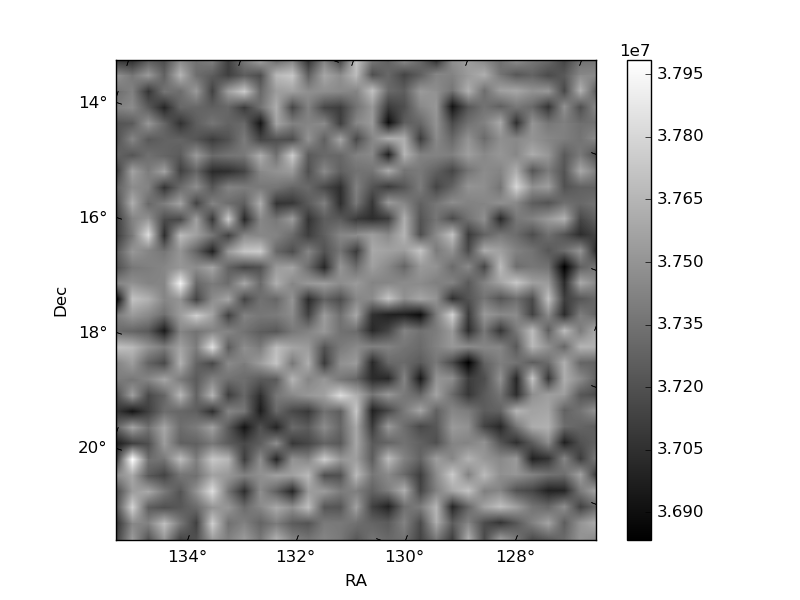
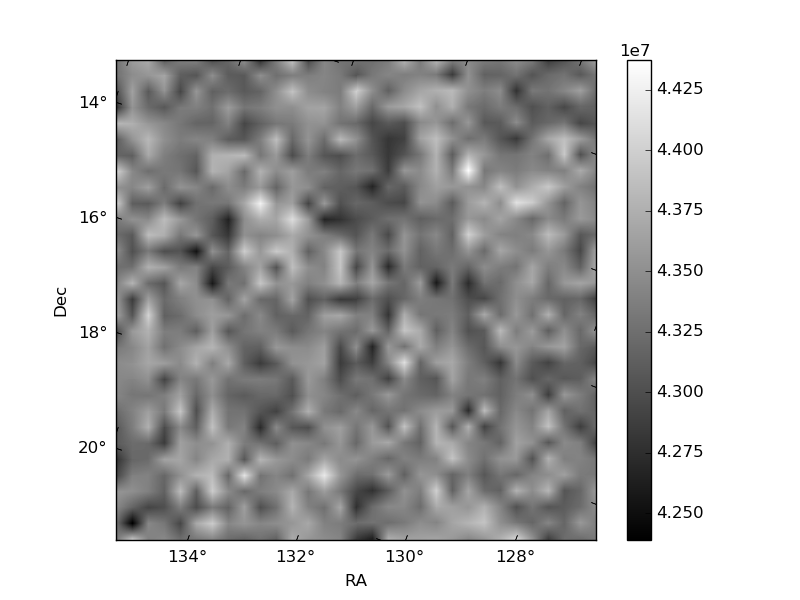
Histogram calculated using DETX and DETY for each event in the final _common_clean file
| Quadrant A | 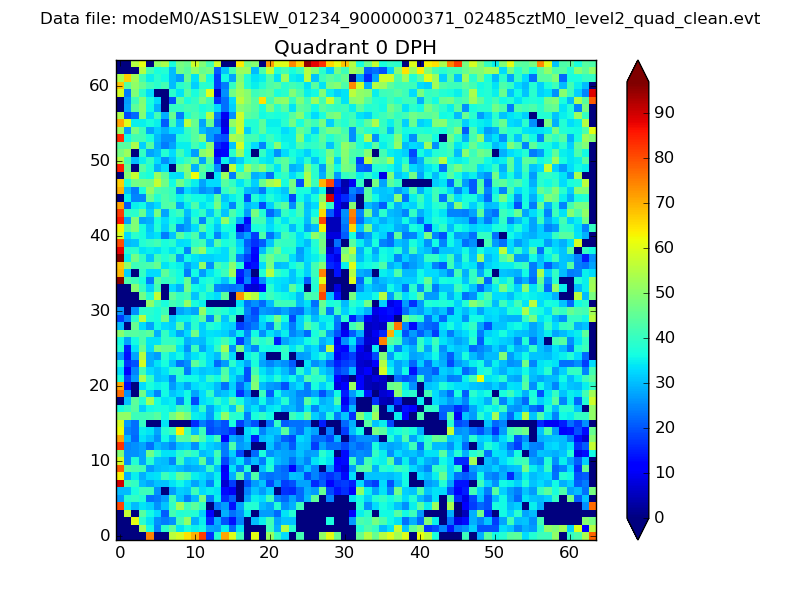 |
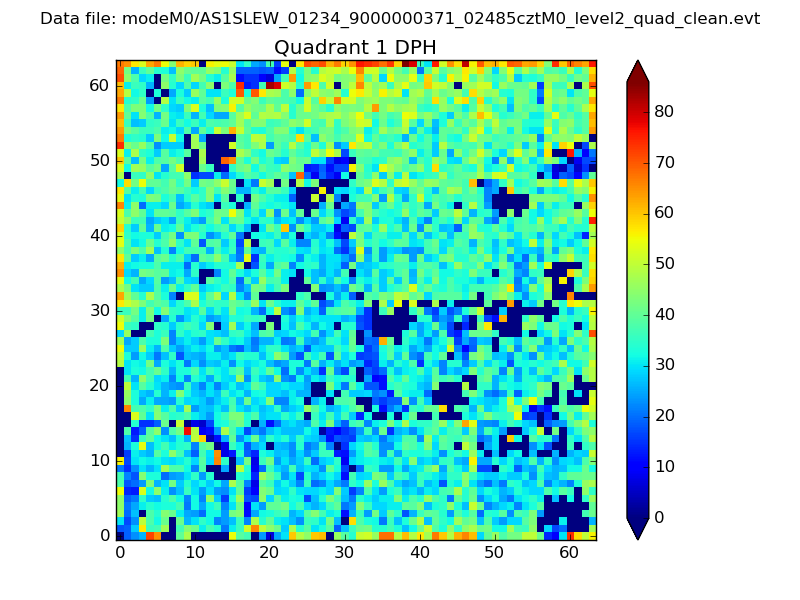 |
Quadrant B |
|---|---|---|---|
| Quadrant D | 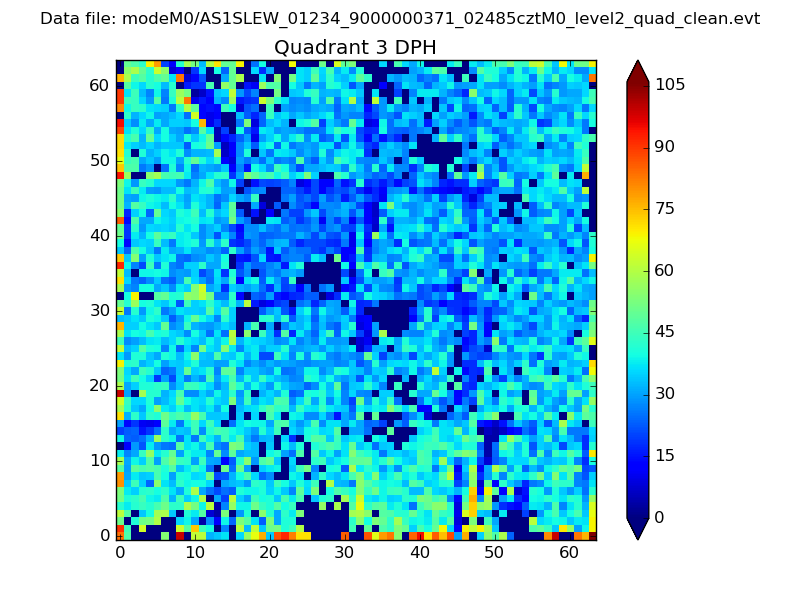 |
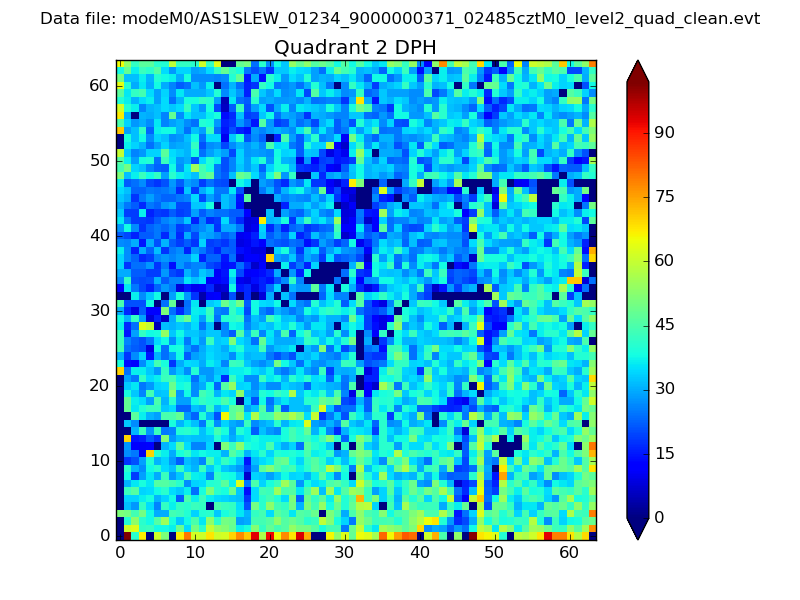 |
Quadrant C |
| Plot type | Count rate plots | Images |
|---|---|---|
| Comparison with Poisson distribution Blue bars denote a histogram of data divided into 1 sec bins. Red curve is a Poisson curve with rate = median count rate of data. |
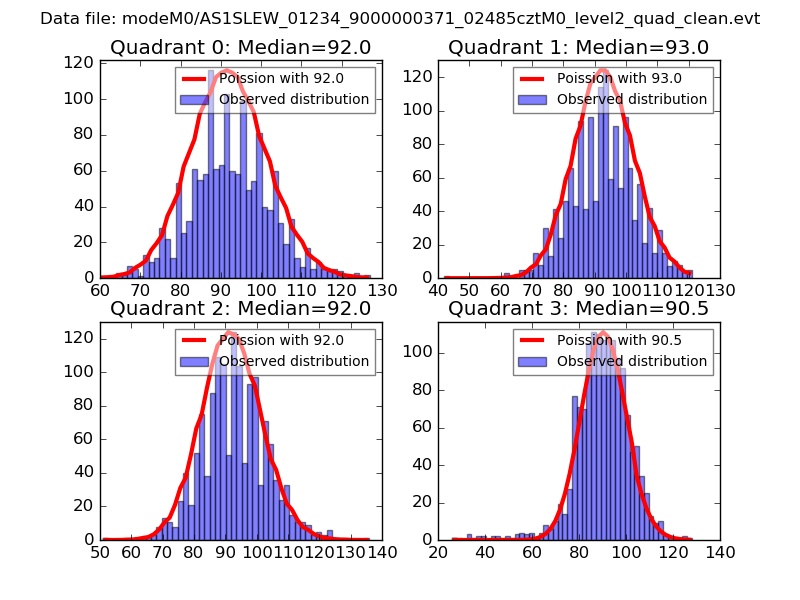 |
 |
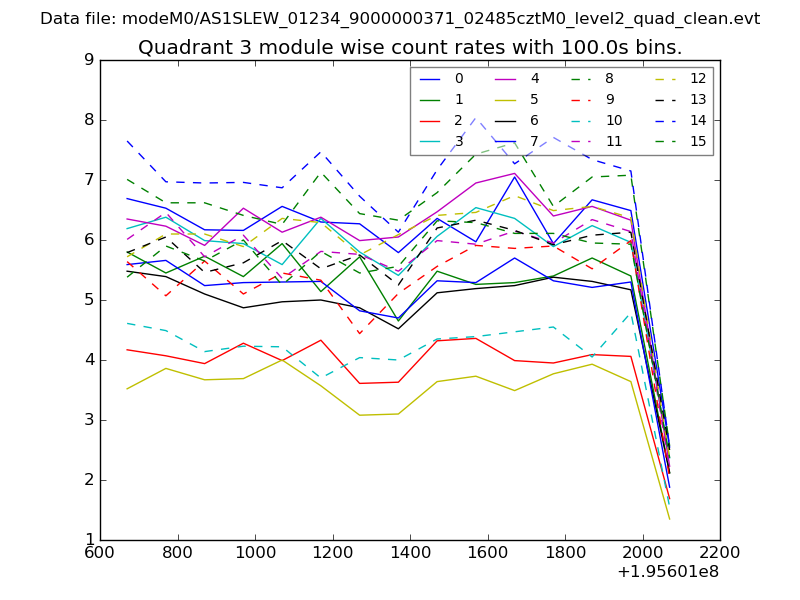
| Quadrant-wise count rates Data is divided into 100 sec bins |
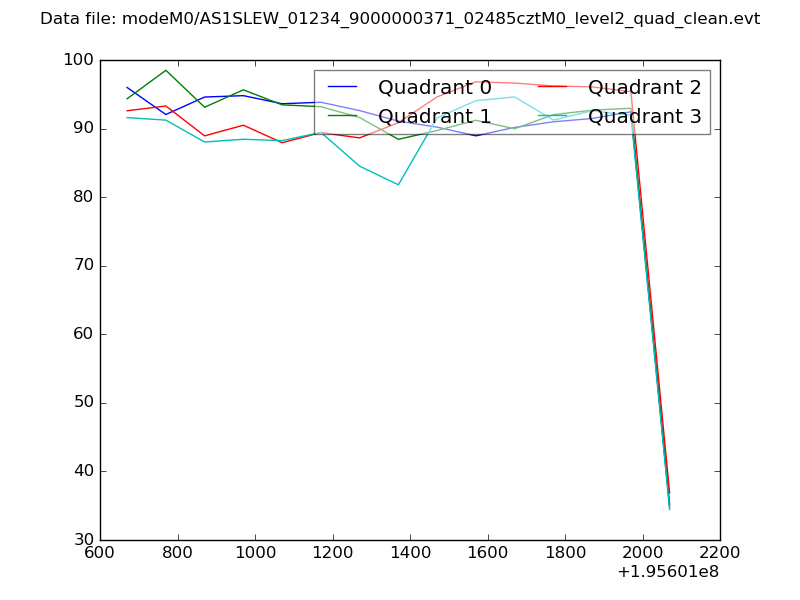 |
|
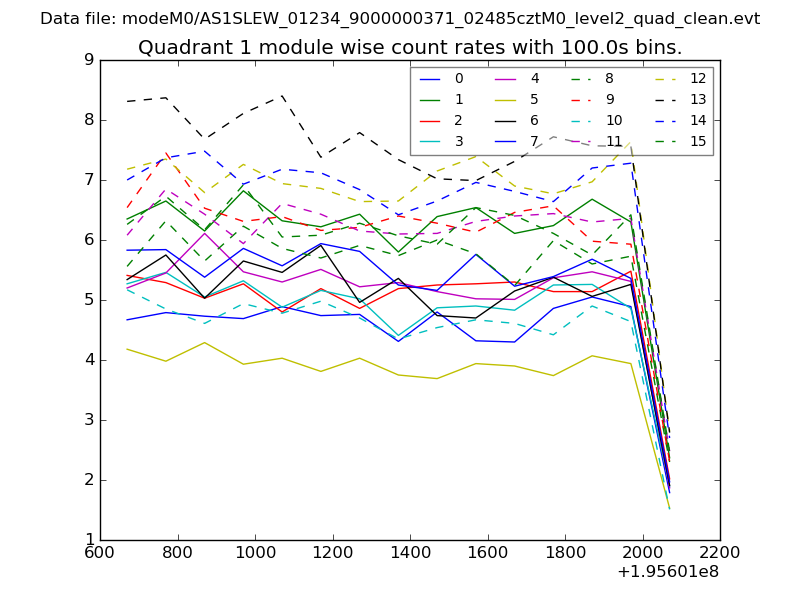
| Module-wise count rates for Quadrant A Data is divided into 100 sec bins |
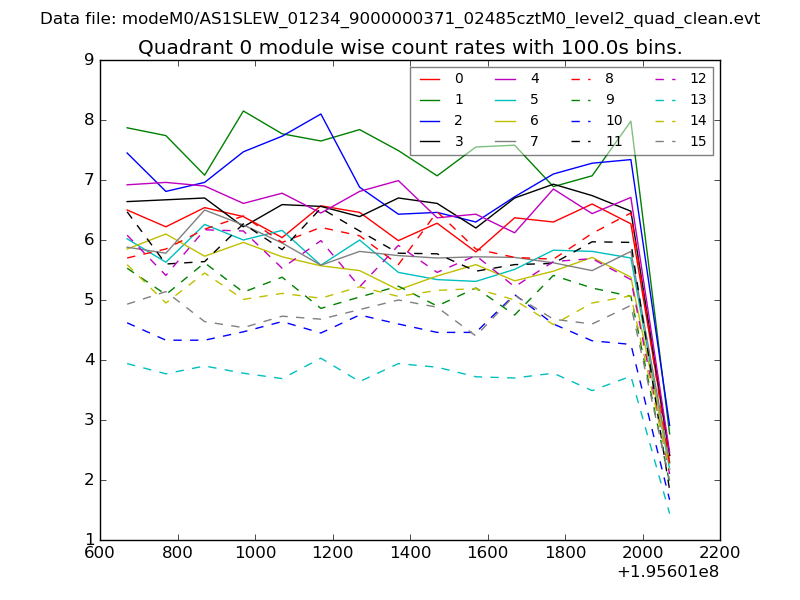 |
 |
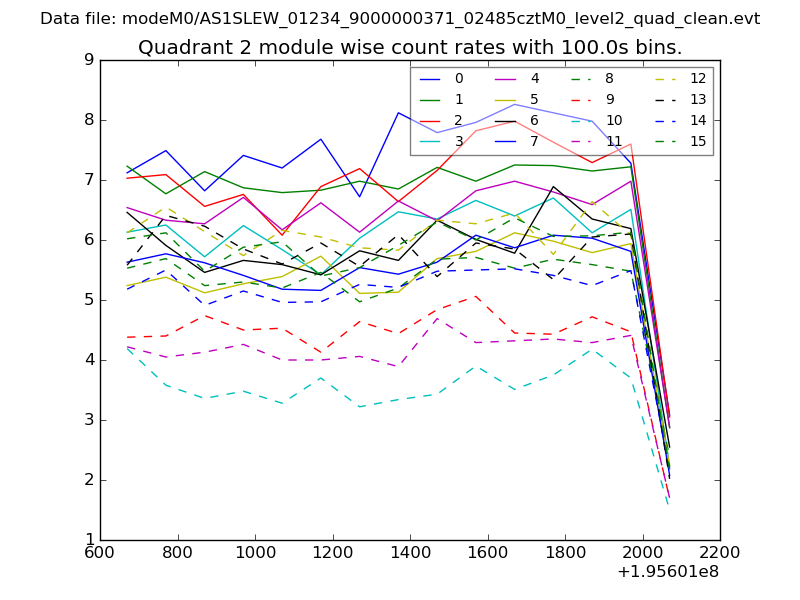
| Module-wise count rates for Quadrant B Data is divided into 100 sec bins |
 |
 |
| Module-wise count rates for Quadrant C Data is divided into 100 sec bins |
 |
 |
| Module-wise count rates for Quadrant D Data is divided into 100 sec bins |
 |
 |
| Parameter | Plot |
|---|---|
| CZT HV Monitor | 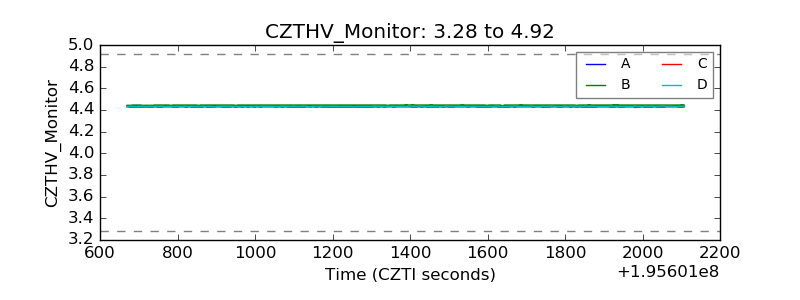 |
| D_VDD | 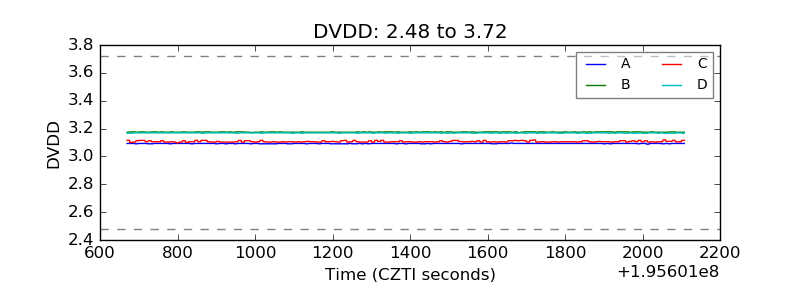 |
| Temperature 1 | 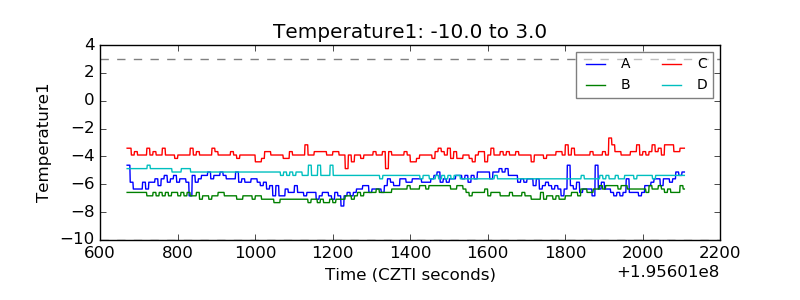 |
| Veto HV Monitor | 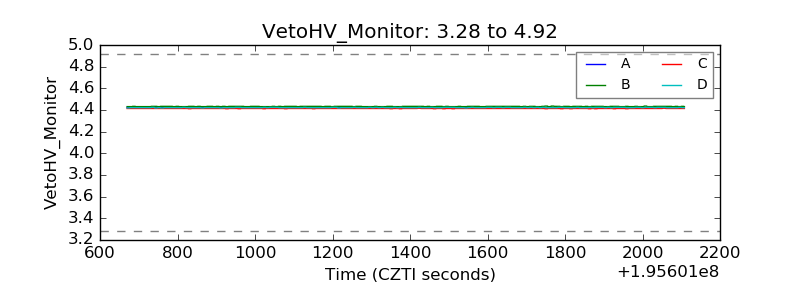 |
| Veto LLD | 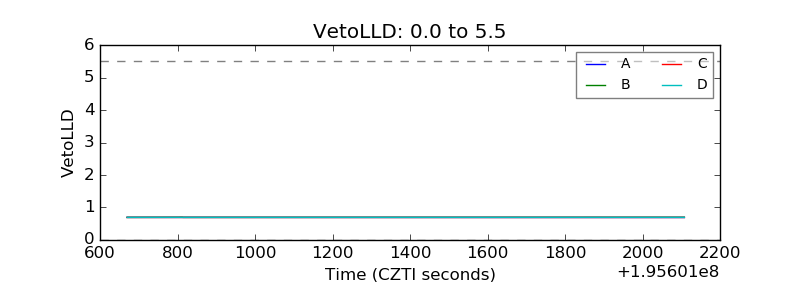 |
| Alpha Counter | 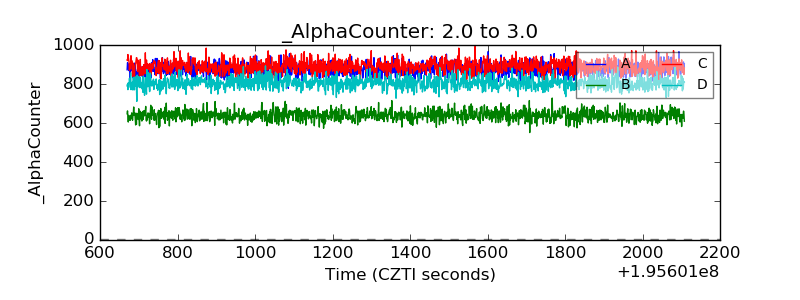 |
| _CPM_Rate | 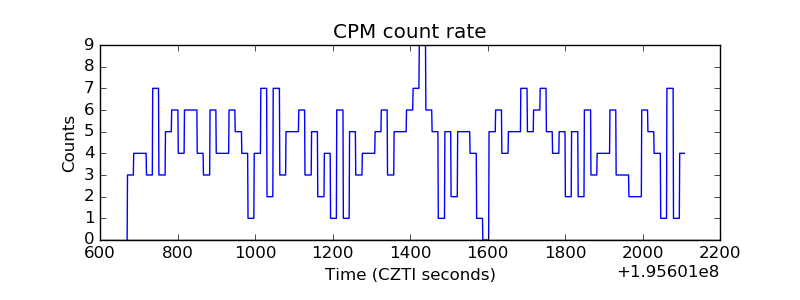 |
| CZT Counter | 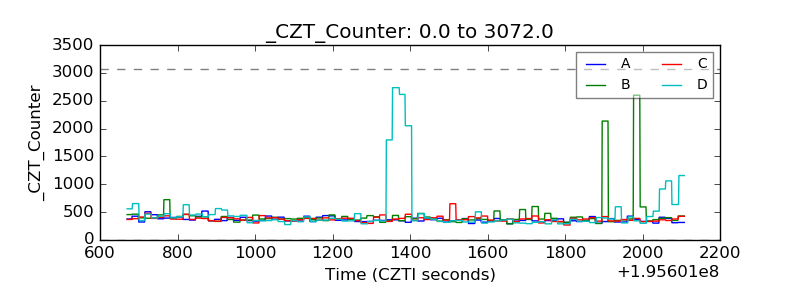 |
| +2.5 Volts monitor |  |
| +5 Volts monitor |  |
| Veto Counter | 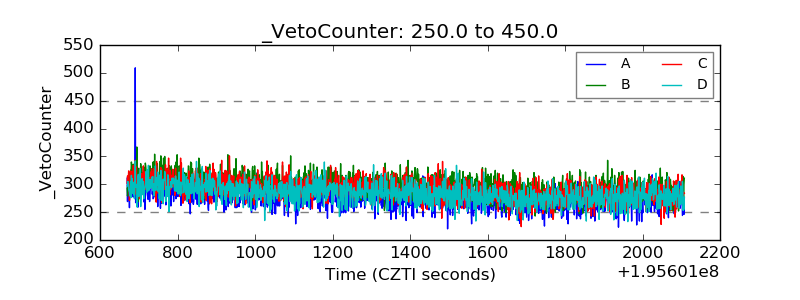 |