| Param | Original file | Final file |
|---|---|---|
| Filename | modeM0/AS1SLEW_01234_9000000373_02503cztM0_level2.evt | modeM0/AS1SLEW_01234_9000000373_02503cztM0_level2_quad_clean.evt |
| Size (bytes) | 39,893,760 | 11,554,560 |
| Size | 38.0 MB | 11.0 MB |
| Events in quadrant A | 283,426 | 74,186 |
| Events in quadrant B | 295,947 | 75,974 |
| Events in quadrant C | 289,785 | 74,975 |
| Events in quadrant D | 292,504 | 72,268 |
| Mode M0 | |||
|---|---|---|---|
| Quadrant | BADHDUFLAG | Total packets | Discarded packets |
| A | 0 | 1269 | 0 |
| B | 0 | 1281 | 0 |
| C | 0 | 1276 | 0 |
| D | 0 | 1321 | 0 |
| Mode SS | |||
|---|---|---|---|
| Quadrant | BADHDUFLAG | Total packets | Discarded packets |
| A | 0 | 12 | 0 |
| B | 0 | 12 | 0 |
| C | 0 | 12 | 0 |
| D | 0 | 12 | 0 |
| Quadrant | Total seconds | Saturated seconds | Saturation percentage |
|---|---|---|---|
| A | 633 | 0 | 0.000000% |
| B | 633 | 0 | 0.000000% |
| C | 633 | 0 | 0.000000% |
| D | 633 | 2 | 0.315956% |
Noise dominated data is calculated using 1-second bins in cleaned event files. If a bin has >2000 counts, and if more than 50% of those come from <1% of pixels, then it is considered to be noise-dominated and hence unusable.
| Quadrant | # 1 sec bins | Bins with >0 counts | Bins with >2000 counts | High rate bins dominated by noise | Noise dominated (total time) | Noise dominated (detector-on time) | Marked lightcurve |
|---|---|---|---|---|---|---|---|
| A | 633 | 633 | 0 | 0 | 0.00% | 0.00% | 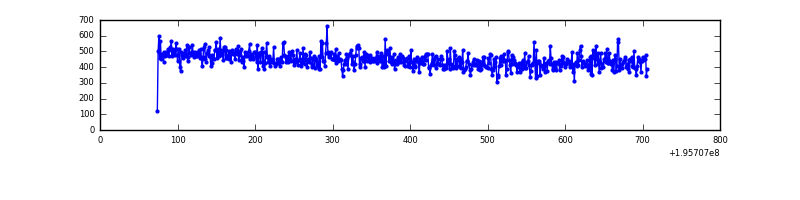 |
| B | 633 | 633 | 0 | 0 | 0.00% | 0.00% | 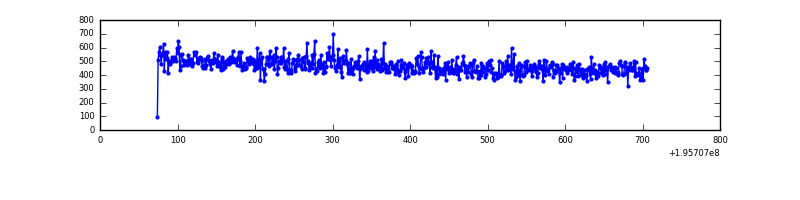 |
| C | 633 | 633 | 0 | 0 | 0.00% | 0.00% | 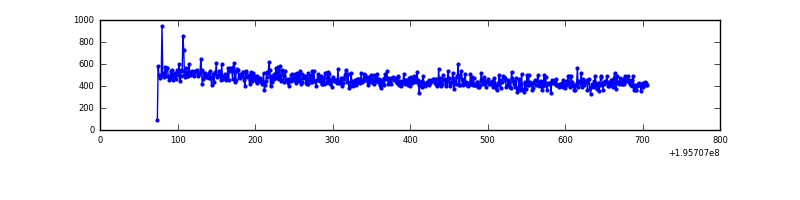 |
| D | 633 | 633 | 1 | 1 | 0.16% | 0.16% | 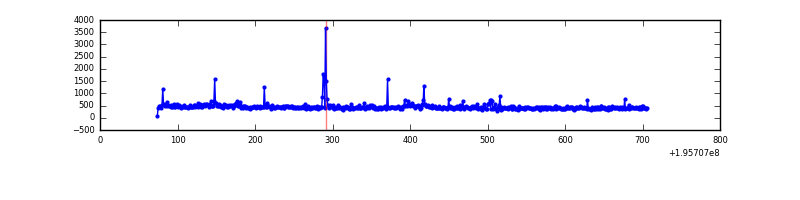 |
Top three noisy pixels from each quadrant. If the there are fewer than three noisy pixels in the level2.evt file, extra rows are filled as -1
| Pixel properties | Quadrant properties | ||||||
|---|---|---|---|---|---|---|---|
| Quadrant | DetID | PixID | Counts | Sigma | Mean | Median | Sigma |
| A | 12 | 194 | 838 | 45.72 | 73 | 71 | 16.8 |
| A | 0 | 226 | 772 | 41.79 | 73 | 71 | 16.8 |
| A | 0 | 128 | 772 | 41.79 | 73 | 71 | 16.8 |
| B | 10 | 244 | 1067 | 59.71 | 76 | 74 | 16.6 |
| B | 12 | 111 | 1034 | 57.72 | 76 | 74 | 16.6 |
| B | 11 | 111 | 816 | 44.61 | 76 | 74 | 16.6 |
| C | 10 | 65 | 2035 | 103.18 | 73 | 73 | 19.0 |
| C | 13 | 61 | 696 | 32.76 | 73 | 73 | 19.0 |
| C | 5 | 250 | 496 | 22.24 | 73 | 73 | 19.0 |
| D | 11 | 130 | 13616 | 741.62 | 70 | 68 | 18.3 |
| D | 2 | 184 | 9174 | 498.46 | 70 | 68 | 18.3 |
| D | 1 | 31 | 4182 | 225.2 | 70 | 68 | 18.3 |
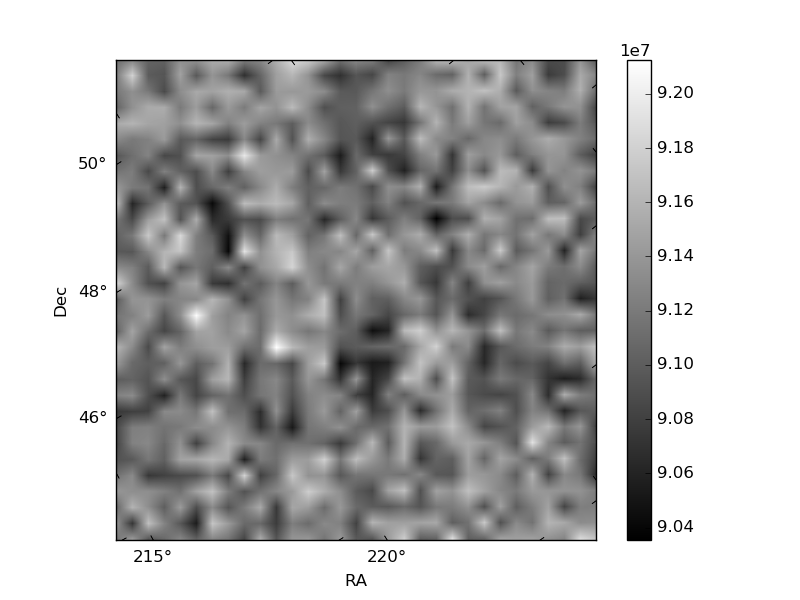
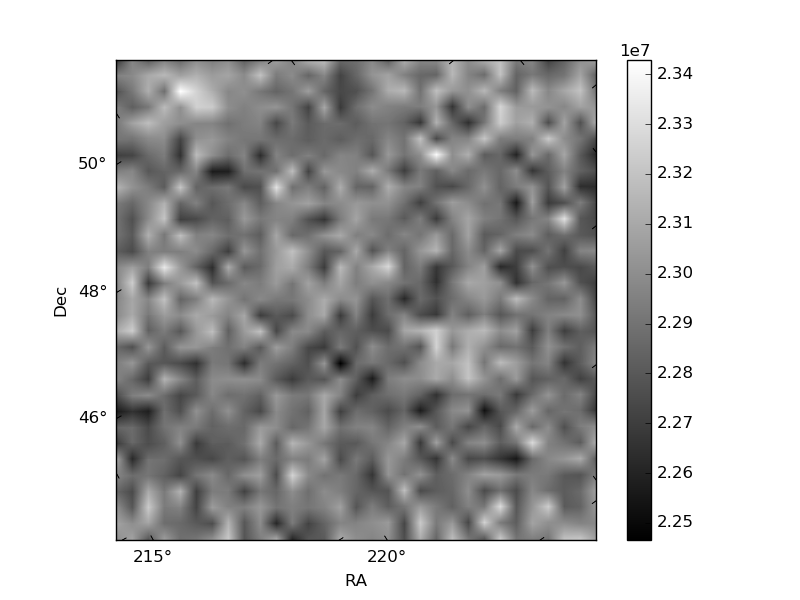
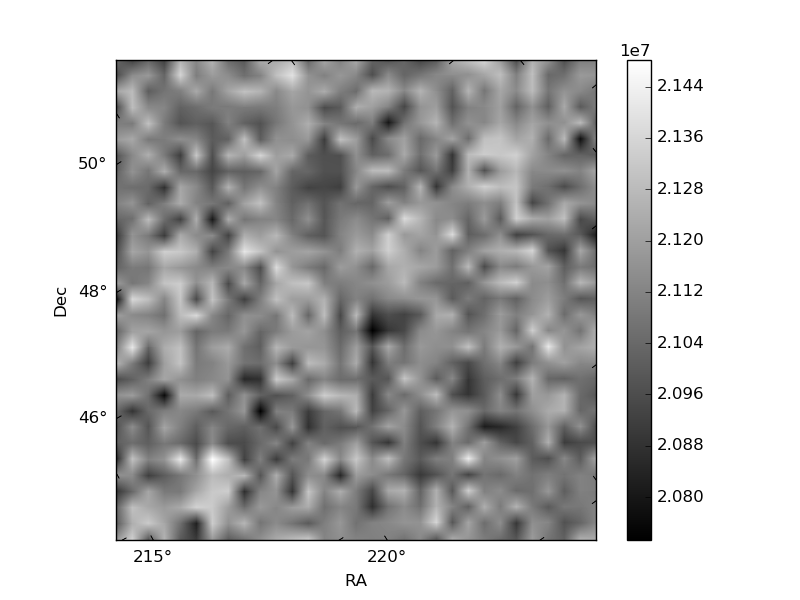
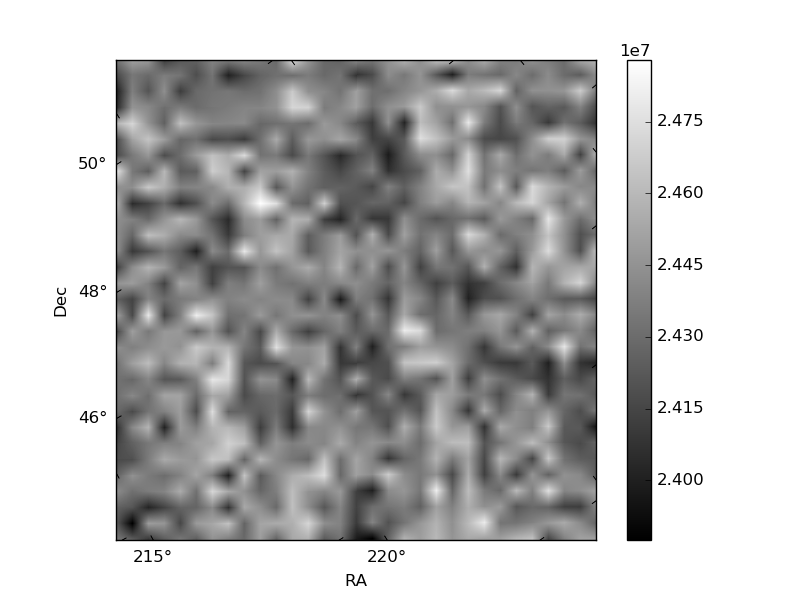
Histogram calculated using DETX and DETY for each event in the final _common_clean file
| Quadrant A | 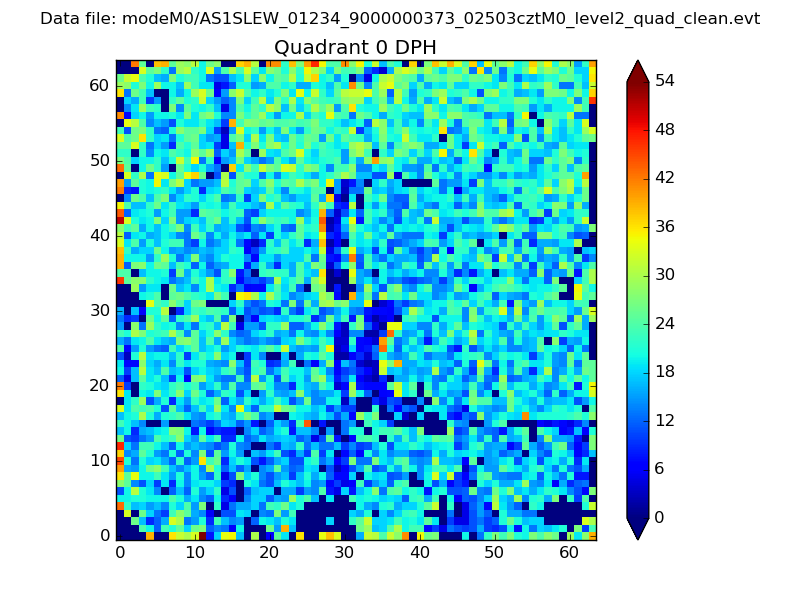 |
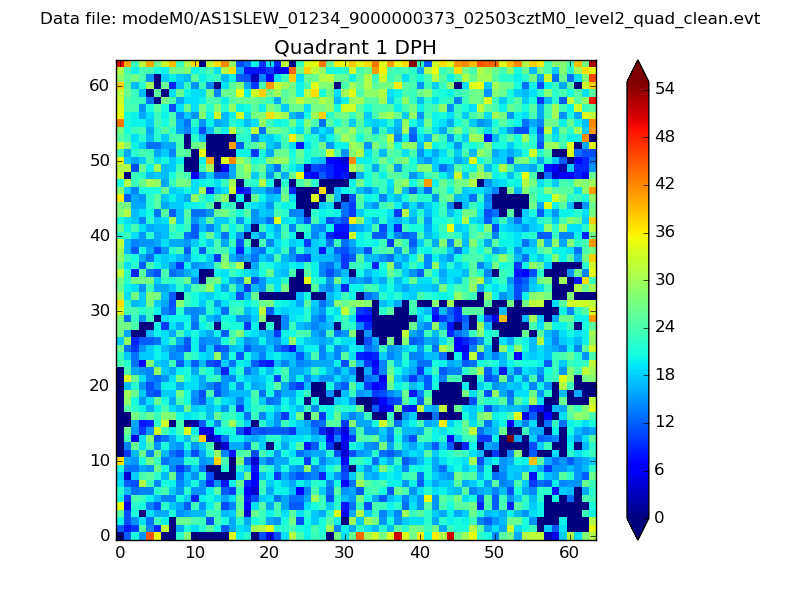 |
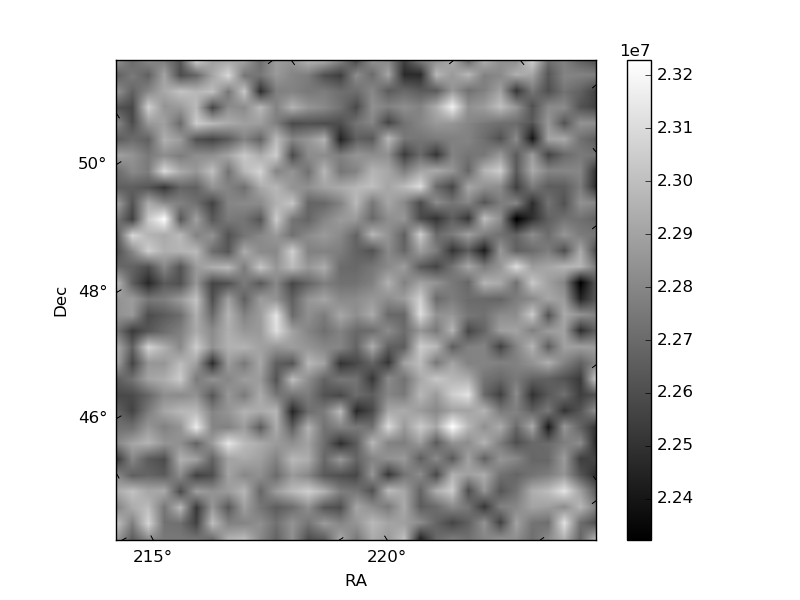
Quadrant B |
|---|---|---|---|
| Quadrant D | 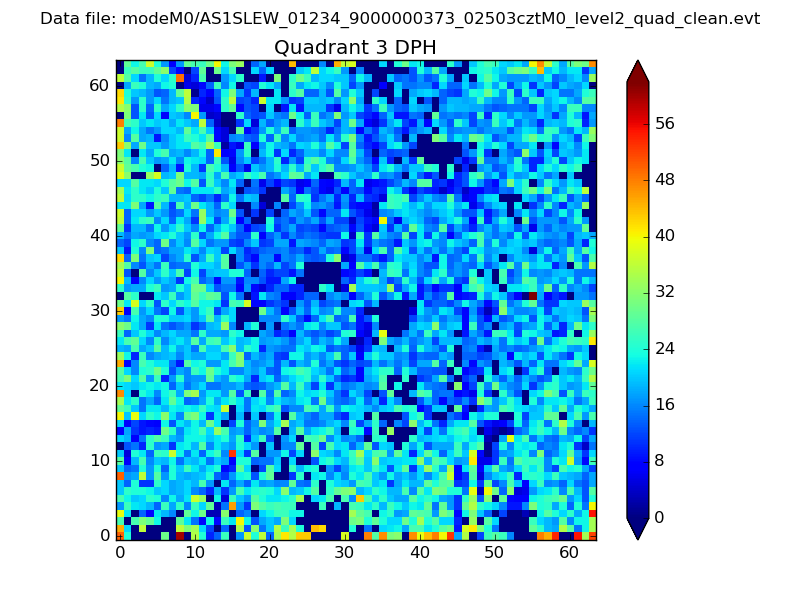 |
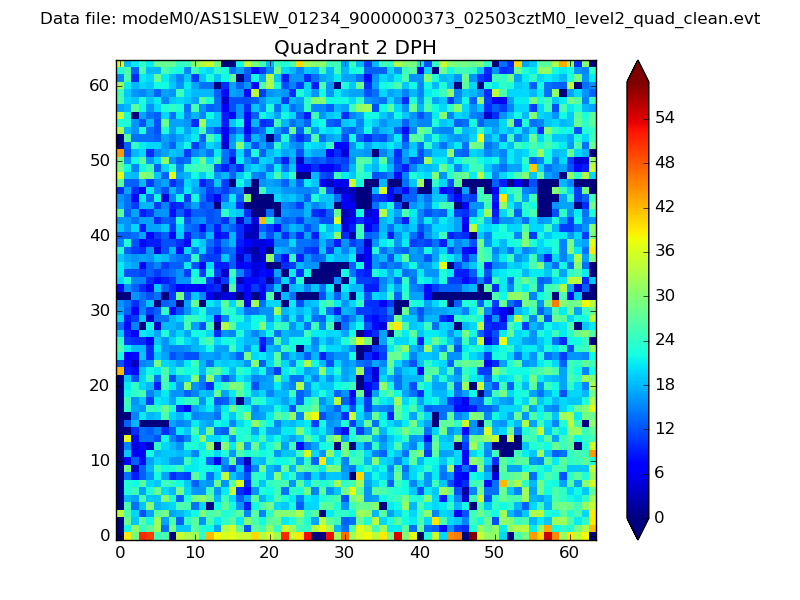 |
Quadrant C |
| Plot type | Count rate plots | Images |
|---|---|---|
| Comparison with Poisson distribution Blue bars denote a histogram of data divided into 1 sec bins. Red curve is a Poisson curve with rate = median count rate of data. |
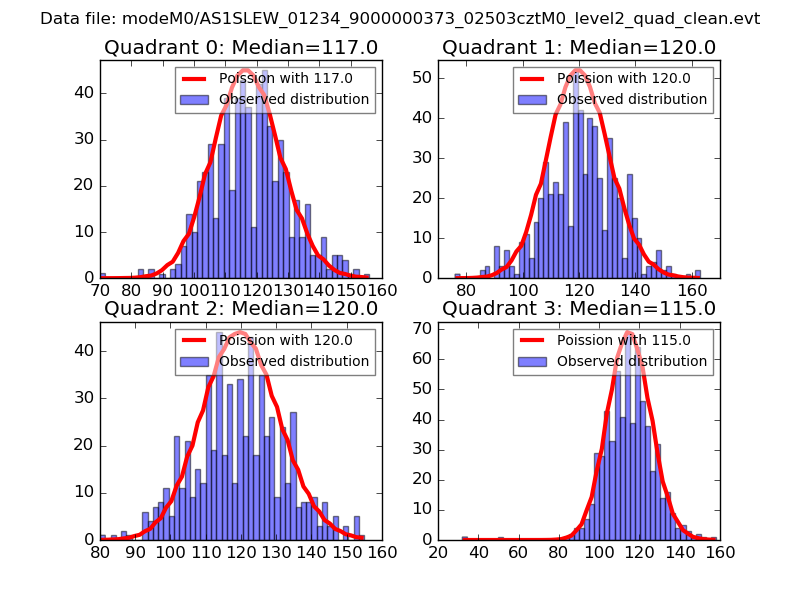 |
 |
| Quadrant-wise count rates Data is divided into 100 sec bins |
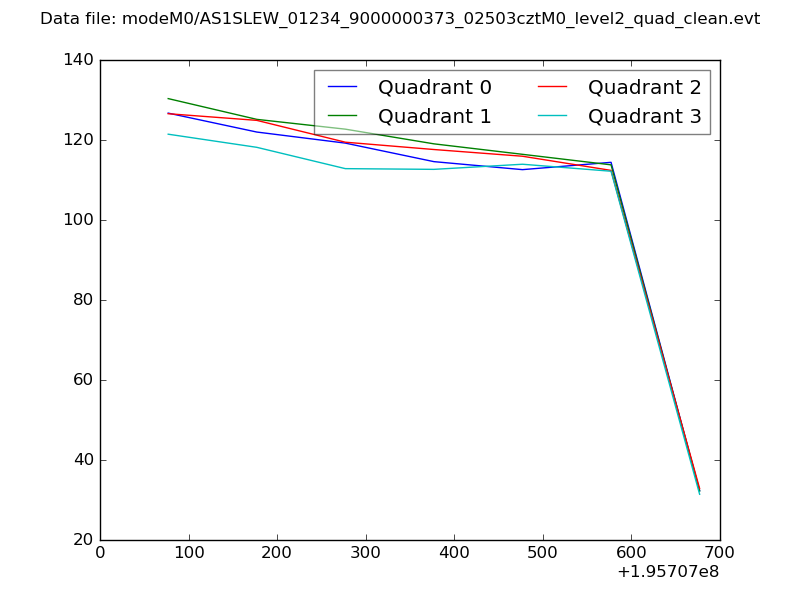 |
|
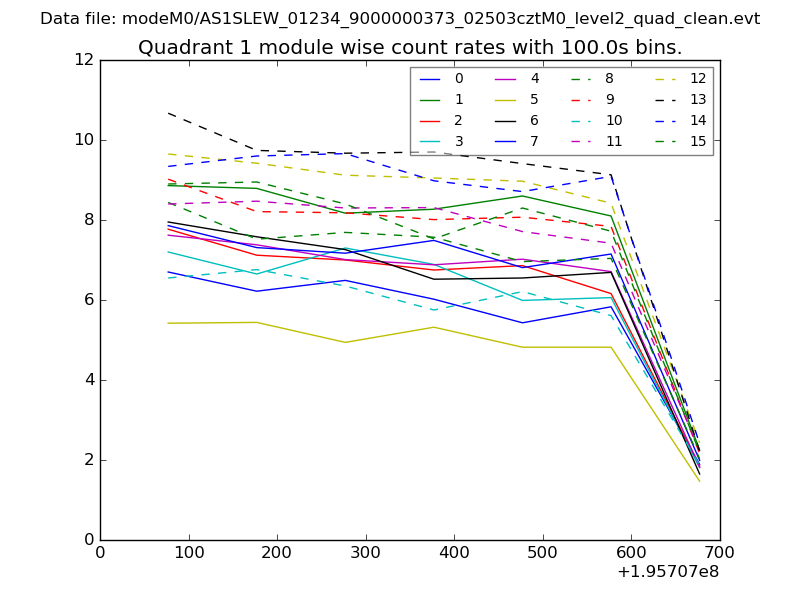
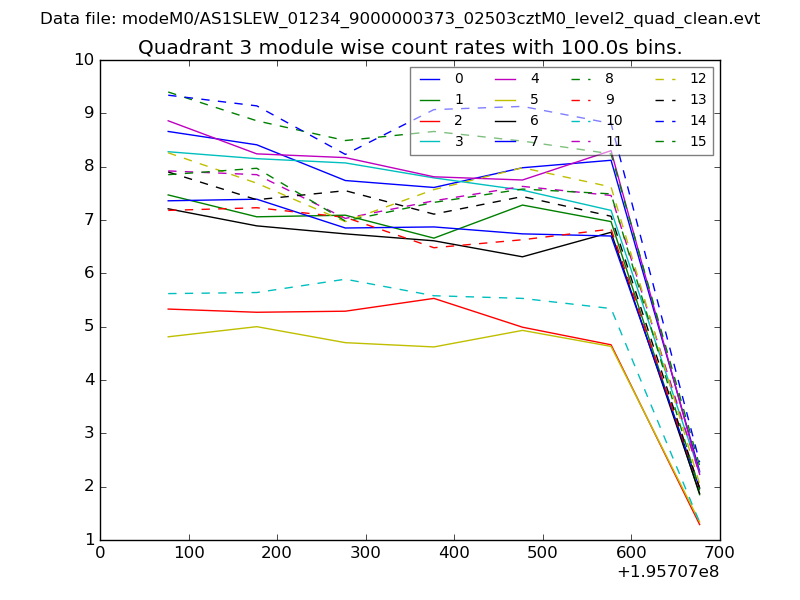
| Module-wise count rates for Quadrant A Data is divided into 100 sec bins |
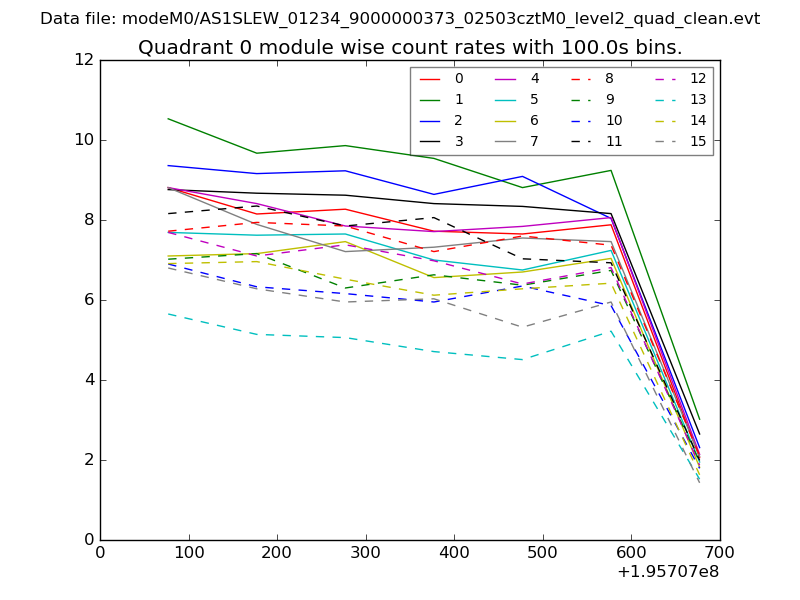 |
 |
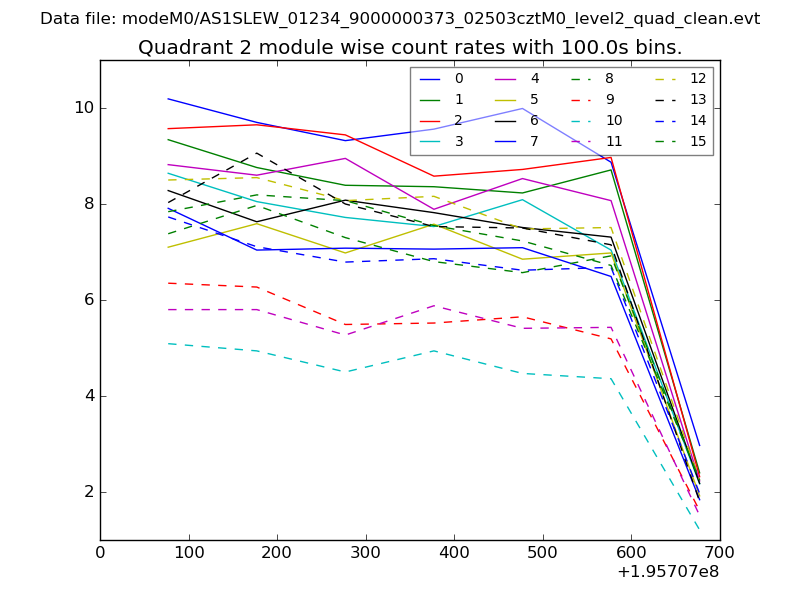
| Module-wise count rates for Quadrant B Data is divided into 100 sec bins |
 |
 |
| Module-wise count rates for Quadrant C Data is divided into 100 sec bins |
 |
 |
| Module-wise count rates for Quadrant D Data is divided into 100 sec bins |
 |
 |
| Parameter | Plot |
|---|---|
| CZT HV Monitor | 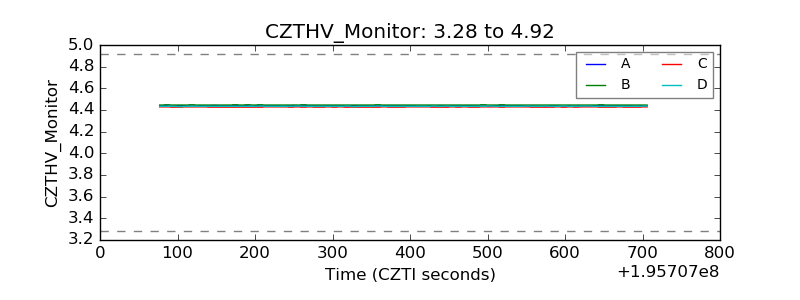 |
| D_VDD | 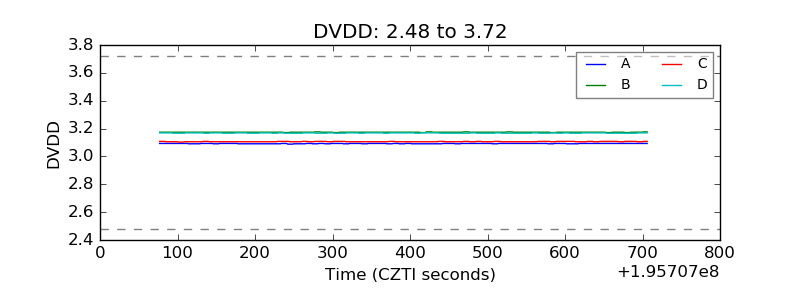 |
| Temperature 1 | 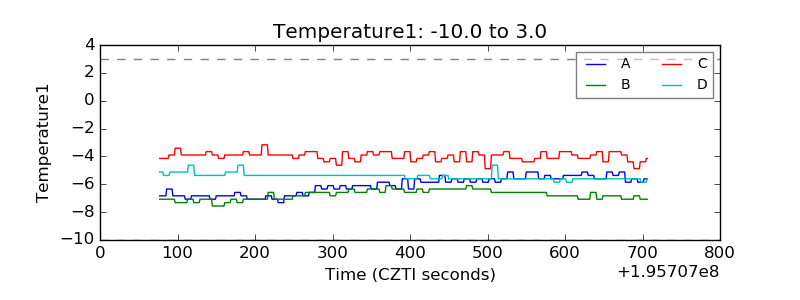 |
| Veto HV Monitor | 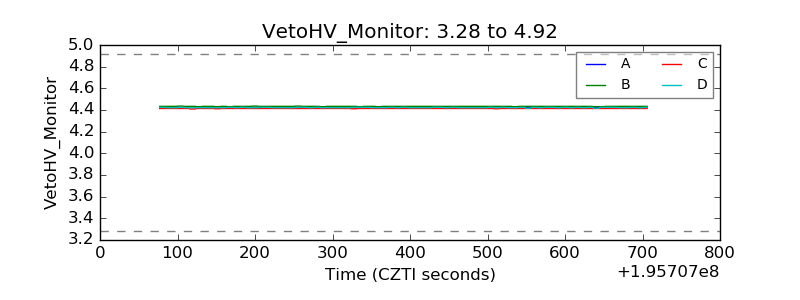 |
| Veto LLD | 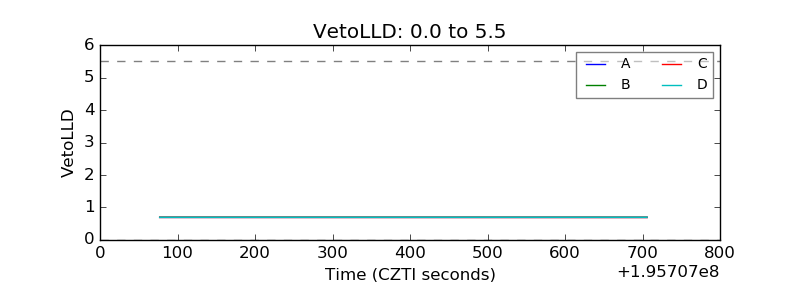 |
| Alpha Counter | 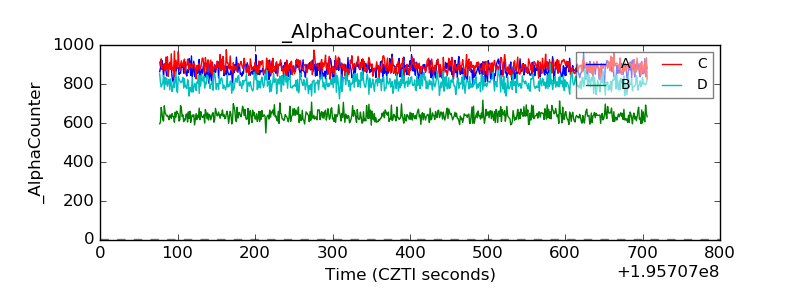 |
| _CPM_Rate | 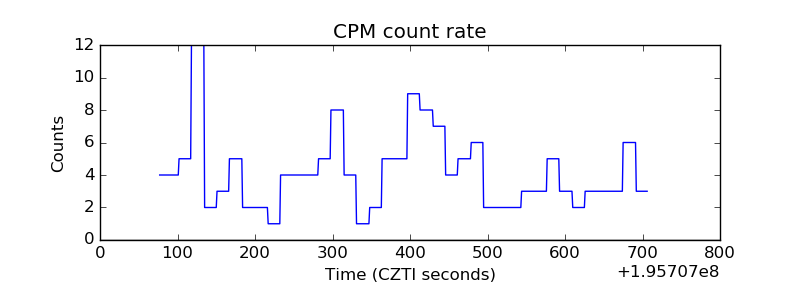 |
| CZT Counter | 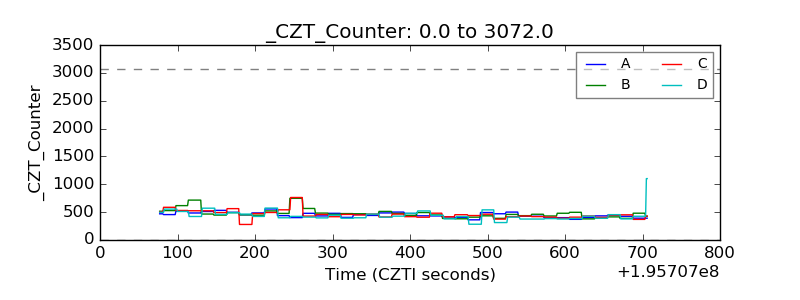 |
| +2.5 Volts monitor |  |
| +5 Volts monitor |  |
| Veto Counter | 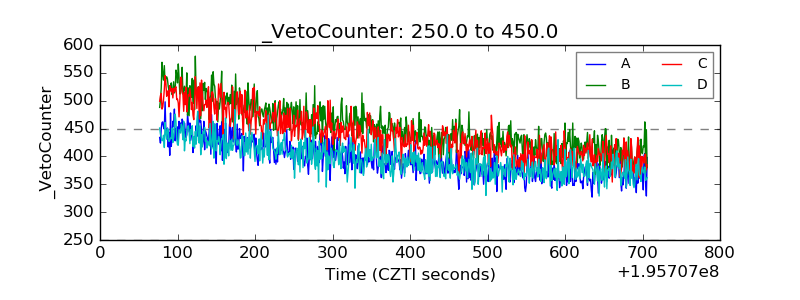 |