| Param | Original file | Final file |
|---|---|---|
| Filename | modeM0/AS1T01_046T01_9000000372cztM0_level2.fits | modeM0/AS1T01_046T01_9000000372cztM0_level2_quad_clean.evt |
| Size (bytes) | 786,286,080 | 846,659,520 |
| Size | 749.9 MB | 807.4 MB |
| Events in quadrant A | 4,664,878 | 5,032,425 |
| Events in quadrant B | 4,543,485 | 5,100,533 |
| Events in quadrant C | 4,550,940 | 4,846,689 |
| Events in quadrant D | 3,916,484 | 4,527,340 |
| Mode M0 | |||
|---|---|---|---|
| Quadrant | BADHDUFLAG | Total packets | Discarded packets |
| A | 0 | 183589 | 0 |
| B | 0 | 184036 | 0 |
| C | 0 | 192214 | 0 |
| D | 0 | 196835 | 0 |
| Mode M9 | |||
|---|---|---|---|
| Quadrant | BADHDUFLAG | Total packets | Discarded packets |
| A | 0 | 144 | 0 |
| B | 0 | 144 | 0 |
| C | 0 | 143 | 0 |
| D | 0 | 143 | 0 |
| Mode SS | |||
|---|---|---|---|
| Quadrant | BADHDUFLAG | Total packets | Discarded packets |
| A | 0 | 1826 | 0 |
| B | 0 | 1826 | 0 |
| C | 0 | 1824 | 0 |
| D | 0 | 1822 | 0 |
| Quadrant | Total seconds | Saturated seconds | Saturation percentage |
|---|---|---|---|
| A | 89509 | 983 | 1.098214% |
| B | 89509 | 987 | 1.102682% |
| C | 89500 | 1898 | 2.120670% |
| D | 89493 | 1469 | 1.641469% |
Noise dominated data is calculated using 1-second bins in cleaned event files. If a bin has >2000 counts, and if more than 50% of those come from <1% of pixels, then it is considered to be noise-dominated and hence unusable.
| Quadrant | # 1 sec bins | Bins with >0 counts | Bins with >2000 counts | High rate bins dominated by noise | Noise dominated (total time) | Noise dominated (detector-on time) | Marked lightcurve |
|---|---|---|---|---|---|---|---|
| A | 103965 | 89570 | 0 | 0 | 0.00% | 0.00% |  |
| B | 103965 | 89560 | 0 | 0 | 0.00% | 0.00% |  |
| C | 103965 | 89490 | 0 | 0 | 0.00% | 0.00% | 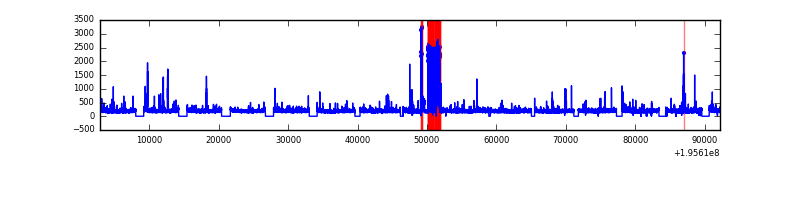 |
| D | 103964 | 89544 | 0 | 0 | 0.00% | 0.00% |  |
Top three noisy pixels from each quadrant. If the there are fewer than three noisy pixels in the level2.evt file, extra rows are filled as -1
| Pixel properties | Quadrant properties | ||||||
|---|---|---|---|---|---|---|---|
| Quadrant | DetID | PixID | Counts | Sigma | Mean | Median | Sigma |
| A | 0 | 29 | 4326 | 10.2 | 1213 | 1129 | 313.5 |
| A | 7 | 110 | 4062 | 9.36 | 1213 | 1129 | 313.5 |
| A | 9 | 19 | 3461 | 7.44 | 1213 | 1129 | 313.5 |
| B | 2 | 9 | 4157 | 13.01 | 1196 | 1137 | 232.1 |
| B | 12 | 226 | 3460 | 10.01 | 1196 | 1137 | 232.1 |
| B | 14 | 254 | 3318 | 9.4 | 1196 | 1137 | 232.1 |
| C | 7 | 111 | 3129 | 6.21 | 1205 | 1109 | 325.3 |
| C | 9 | 242 | 3029 | 5.9 | 1205 | 1109 | 325.3 |
| C | 9 | 188 | 3026 | 5.89 | 1205 | 1109 | 325.3 |
| D | 11 | 82 | 3029 | 6.45 | 1119 | 1012 | 312.5 |
| D | 10 | 189 | 2935 | 6.15 | 1119 | 1012 | 312.5 |
| D | 6 | 231 | 2927 | 6.13 | 1119 | 1012 | 312.5 |
Histogram calculated using DETX and DETY for each event in the final _common_clean file
| Quadrant A | 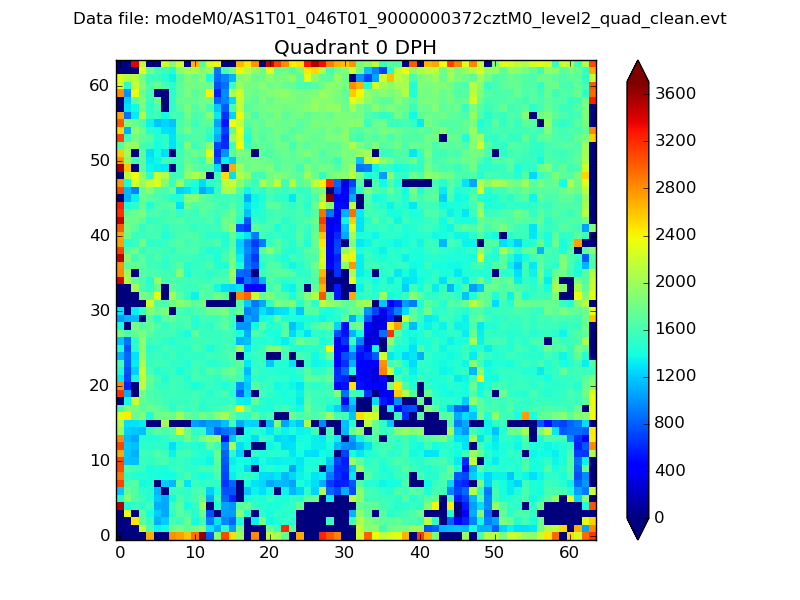 |
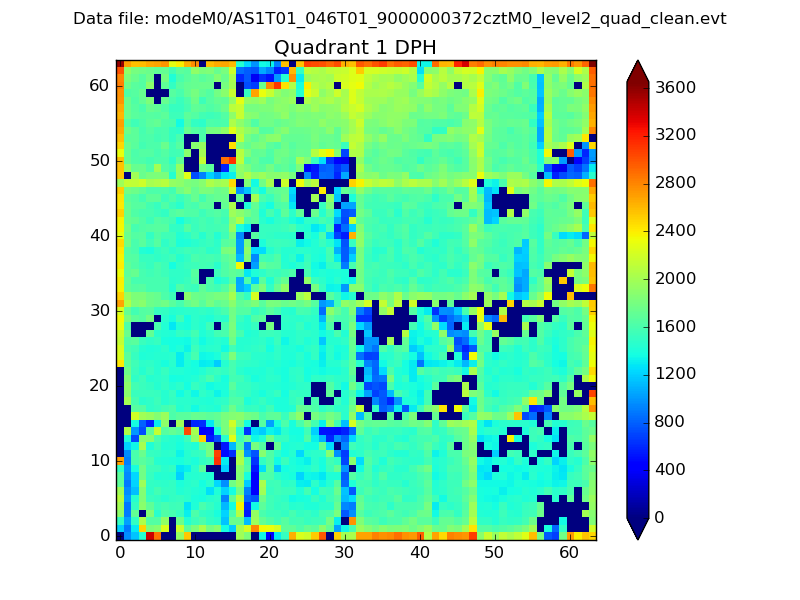 |
Quadrant B |
|---|---|---|---|
| Quadrant D | 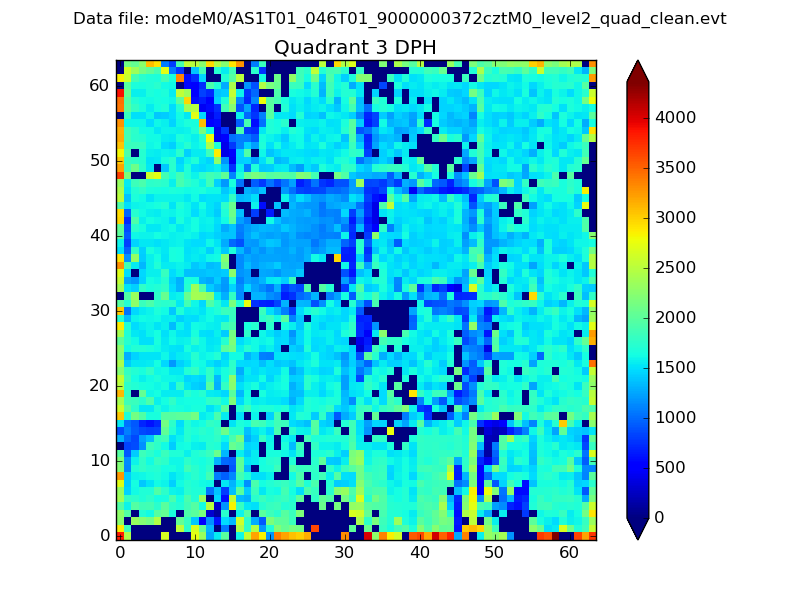 |
 |
Quadrant C |
| Plot type | Count rate plots | Images |
|---|---|---|
| Comparison with Poisson distribution Blue bars denote a histogram of data divided into 1 sec bins. Red curve is a Poisson curve with rate = median count rate of data. |
 |
 |
| Quadrant-wise count rates Data is divided into 100 sec bins |
 |
|
| Module-wise count rates for Quadrant A Data is divided into 100 sec bins |
 |
 |
| Module-wise count rates for Quadrant B Data is divided into 100 sec bins |
 |
 |
| Module-wise count rates for Quadrant C Data is divided into 100 sec bins |
 |
 |
| Module-wise count rates for Quadrant D Data is divided into 100 sec bins |
 |
 |
| Parameter | Plot |
|---|---|
| CZT HV Monitor |  |
| D_VDD |  |
| Temperature 1 |  |
| Veto HV Monitor |  |
| Veto LLD |  |
| Alpha Counter |  |
| _CPM_Rate |  |
| CZT Counter |  |
| +2.5 Volts monitor |  |
| +5 Volts monitor |  |
| _ROLL_ROT |  |
| _Roll_DEC |  |
| _Roll_RA |  |
| Veto Counter |  |