| Param | Original file | Final file |
|---|---|---|
| Filename | modeM0/AS1T01_046T01_9000000372_02487cztM0_level2.fits | modeM0/AS1T01_046T01_9000000372_02487cztM0_level2_quad_clean.evt |
| Size (bytes) | 333,169,920 | 110,946,240 |
| Size | 317.7 MB | 105.8 MB |
| Events in quadrant A | 2,875,642 | 736,276 |
| Events in quadrant B | 2,984,168 | 763,292 |
| Events in quadrant C | 2,936,722 | 726,863 |
| Events in quadrant D | 3,016,781 | 667,926 |
| Mode M0 | |||
|---|---|---|---|
| Quadrant | BADHDUFLAG | Total packets | Discarded packets |
| A | 0 | 13552 | 3 |
| B | 0 | 13732 | 2 |
| C | 0 | 13757 | 2 |
| D | 0 | 14262 | 2 |
| Mode M9 | |||
|---|---|---|---|
| Quadrant | BADHDUFLAG | Total packets | Discarded packets |
| A | 0 | 17 | 0 |
| B | 0 | 17 | 0 |
| C | 0 | 17 | 0 |
| D | 0 | 18 | 0 |
| Mode SS | |||
|---|---|---|---|
| Quadrant | BADHDUFLAG | Total packets | Discarded packets |
| A | 0 | 136 | 0 |
| B | 0 | 136 | 0 |
| C | 0 | 136 | 0 |
| D | 0 | 136 | 0 |
| Quadrant | Total seconds | Saturated seconds | Saturation percentage |
|---|---|---|---|
| A | 6664 | 11 | 0.165066% |
| B | 6664 | 17 | 0.255102% |
| C | 6664 | 16 | 0.240096% |
| D | 6664 | 42 | 0.630252% |
Noise dominated data is calculated using 1-second bins in cleaned event files. If a bin has >2000 counts, and if more than 50% of those come from <1% of pixels, then it is considered to be noise-dominated and hence unusable.
| Quadrant | # 1 sec bins | Bins with >0 counts | Bins with >2000 counts | High rate bins dominated by noise | Noise dominated (total time) | Noise dominated (detector-on time) | Marked lightcurve |
|---|---|---|---|---|---|---|---|
| A | 7819 | 6665 | 0 | 0 | 0.00% | 0.00% | 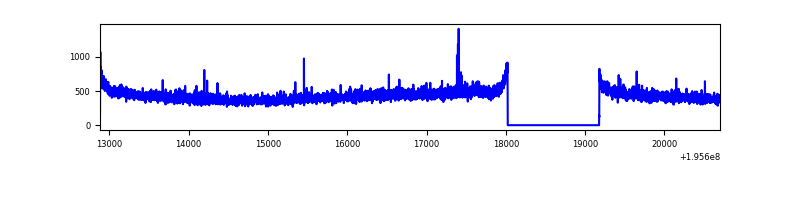 |
| B | 7819 | 6665 | 2 | 2 | 0.03% | 0.03% | 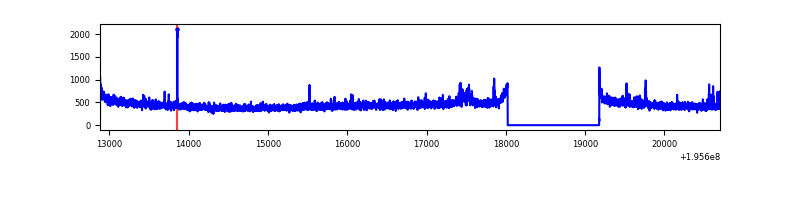 |
| C | 7819 | 6665 | 4 | 4 | 0.05% | 0.06% | 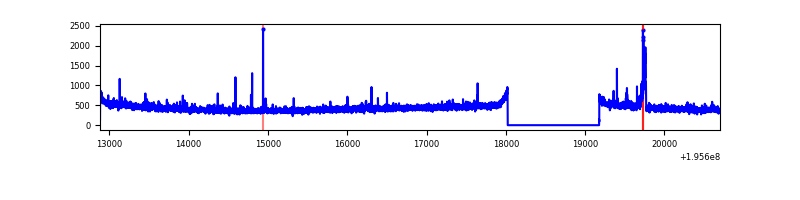 |
| D | 7819 | 6665 | 41 | 41 | 0.52% | 0.62% | 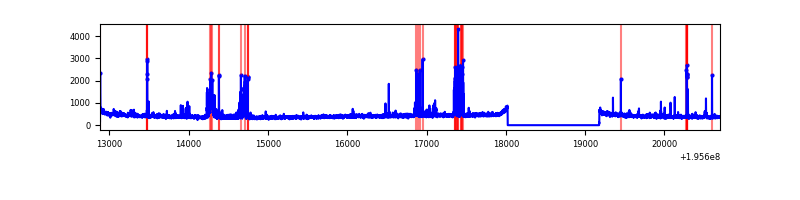 |
Top three noisy pixels from each quadrant. If the there are fewer than three noisy pixels in the level2.evt file, extra rows are filled as -1
| Pixel properties | Quadrant properties | ||||||
|---|---|---|---|---|---|---|---|
| Quadrant | DetID | PixID | Counts | Sigma | Mean | Median | Sigma |
| A | 8 | 15 | 21126 | 135.68 | 739 | 723 | 150.4 |
| A | 14 | 63 | 13643 | 85.92 | 739 | 723 | 150.4 |
| A | 12 | 194 | 8324 | 50.55 | 739 | 723 | 150.4 |
| B | 0 | 87 | 28924 | 194.6 | 756 | 737 | 144.8 |
| B | 5 | 6 | 23244 | 155.38 | 756 | 737 | 144.8 |
| B | 4 | 200 | 17034 | 112.51 | 756 | 737 | 144.8 |
| C | 12 | 4 | 81436 | 480.11 | 722 | 725 | 168.1 |
| C | 10 | 65 | 20281 | 116.33 | 722 | 725 | 168.1 |
| C | 13 | 61 | 6568 | 34.76 | 722 | 725 | 168.1 |
| D | 2 | 184 | 116973 | 698.43 | 704 | 686 | 166.5 |
| D | 10 | 199 | 80121 | 477.09 | 704 | 686 | 166.5 |
| D | 1 | 31 | 53778 | 318.87 | 704 | 686 | 166.5 |
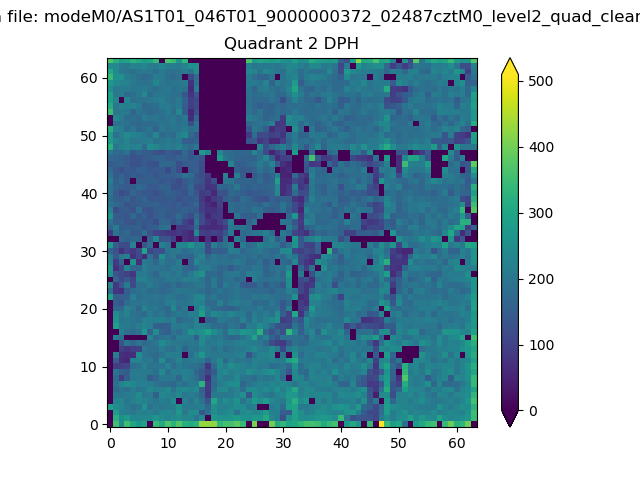
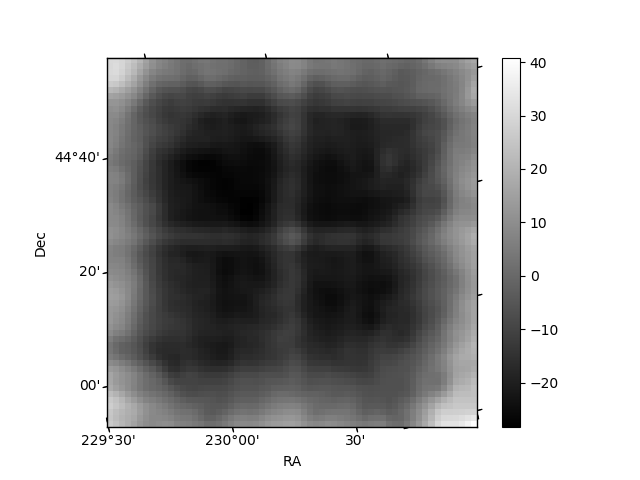
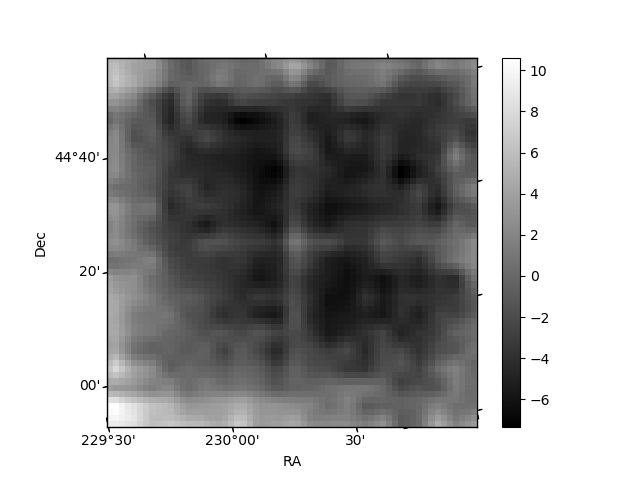
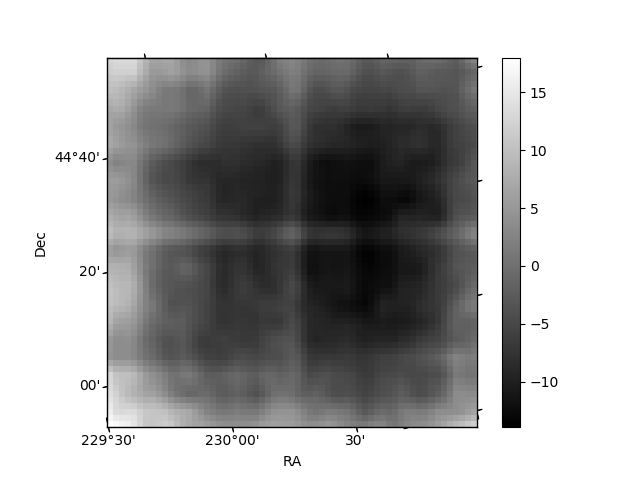
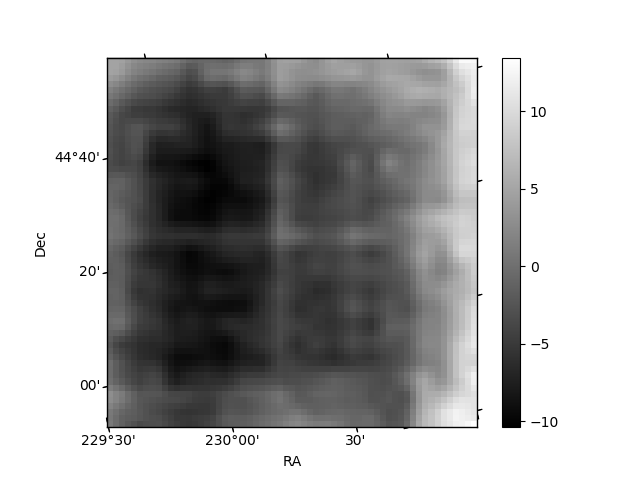
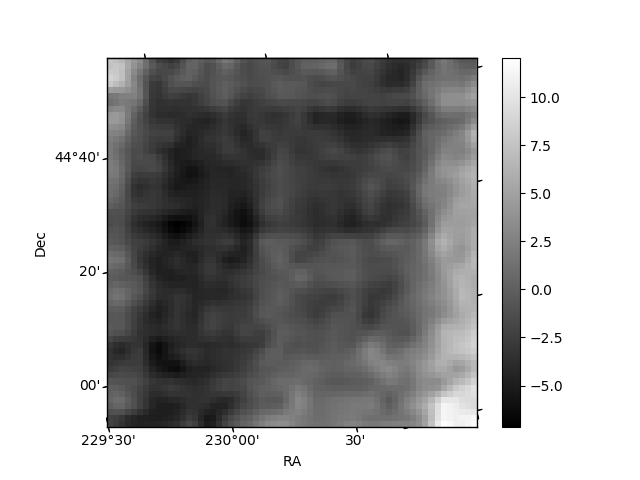
Histogram calculated using DETX and DETY for each event in the final _common_clean file
| Quadrant A | 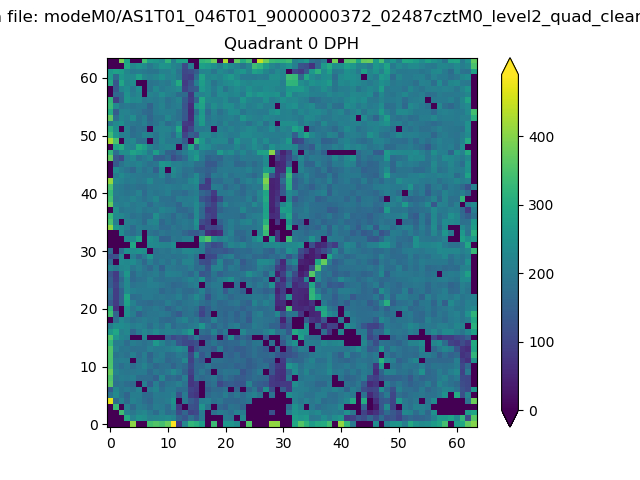 |
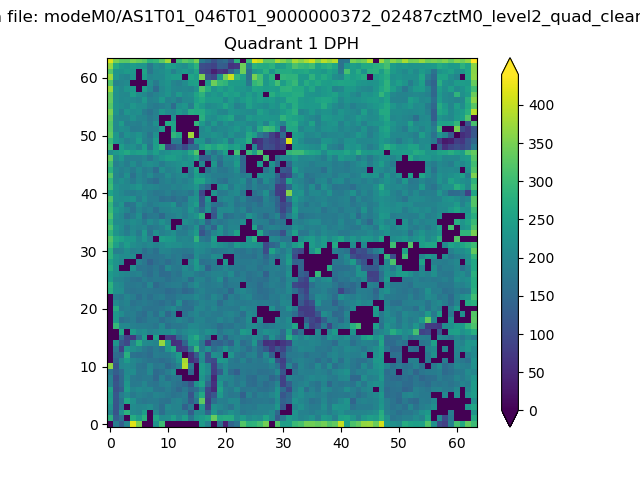 |
Quadrant B |
|---|---|---|---|
| Quadrant D | 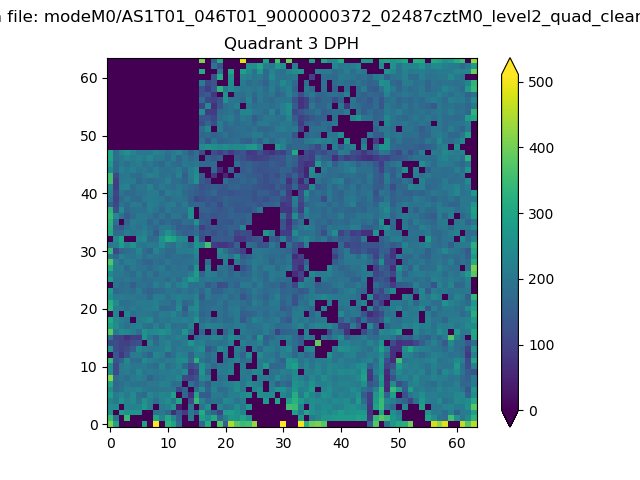 |
 |
Quadrant C |
| Plot type | Count rate plots | Images |
|---|---|---|
| Comparison with Poisson distribution Blue bars denote a histogram of data divided into 1 sec bins. Red curve is a Poisson curve with rate = median count rate of data. |
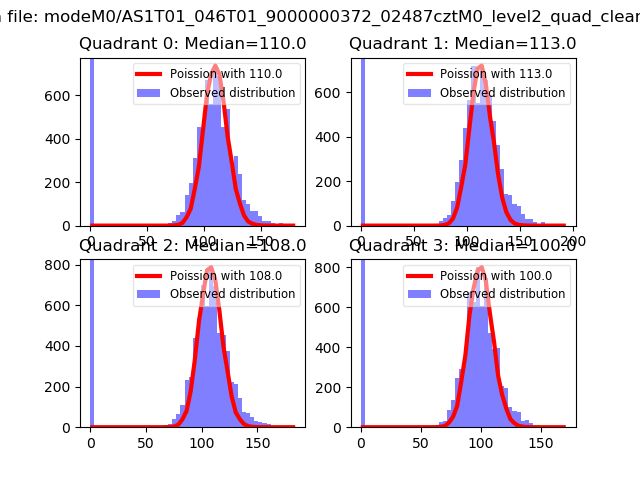 |
 |
| Quadrant-wise count rates Data is divided into 100 sec bins |
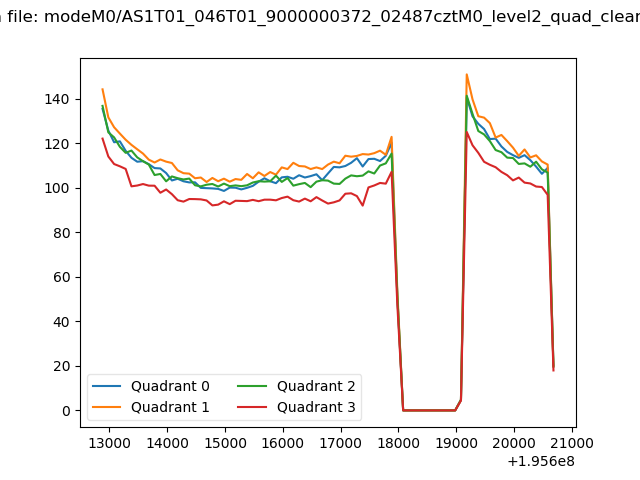 |
|
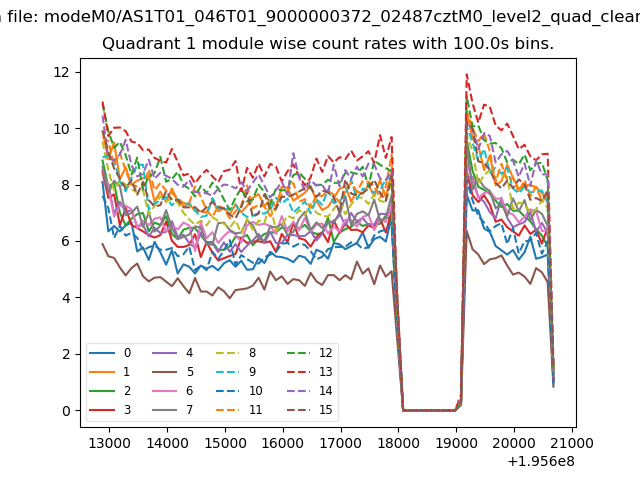
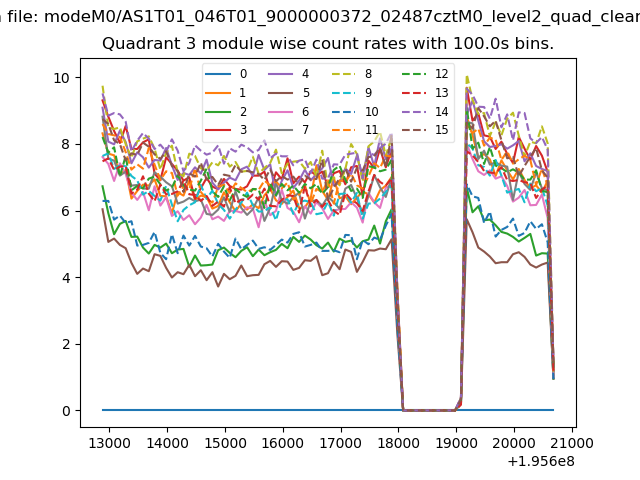
| Module-wise count rates for Quadrant A Data is divided into 100 sec bins |
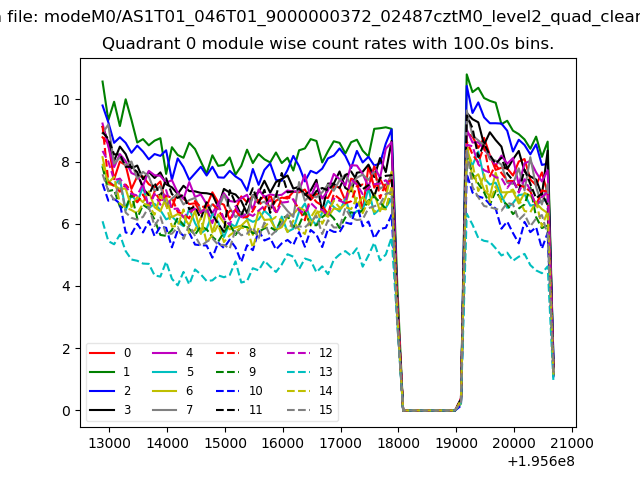 |
 |
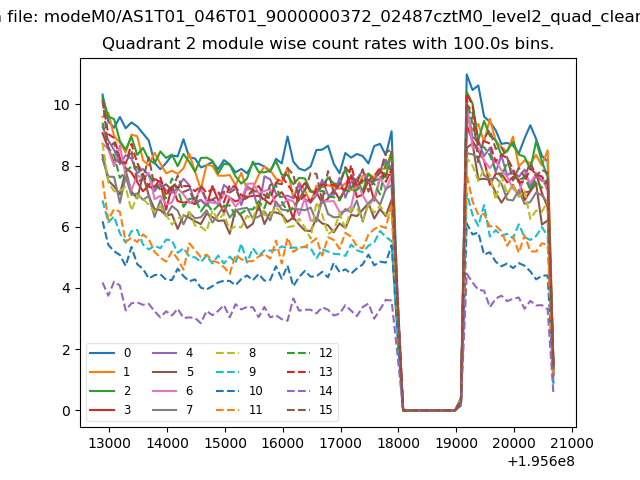
| Module-wise count rates for Quadrant B Data is divided into 100 sec bins |
 |
 |
| Module-wise count rates for Quadrant C Data is divided into 100 sec bins |
 |
 |
| Module-wise count rates for Quadrant D Data is divided into 100 sec bins |
 |
 |
| Parameter | Plot |
|---|---|
| CZT HV Monitor |  |
| D_VDD | 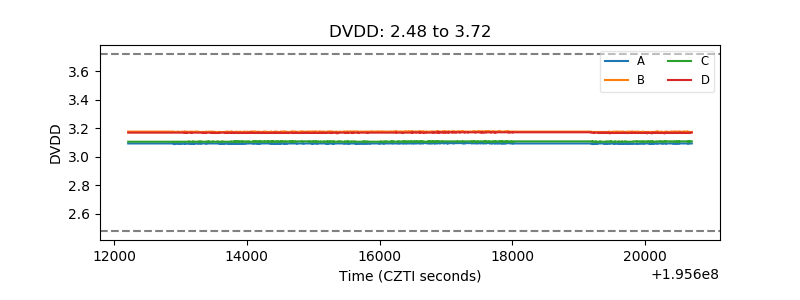 |
| Temperature 1 | 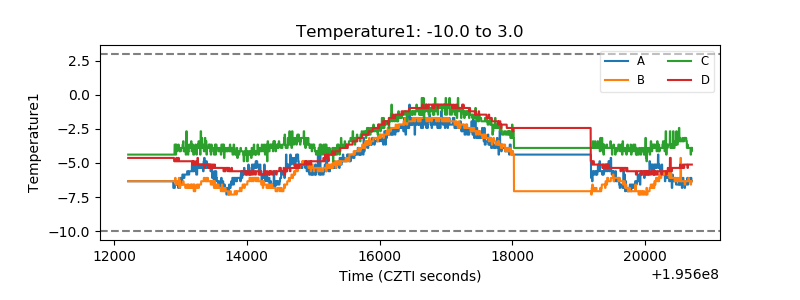 |
| Veto HV Monitor | 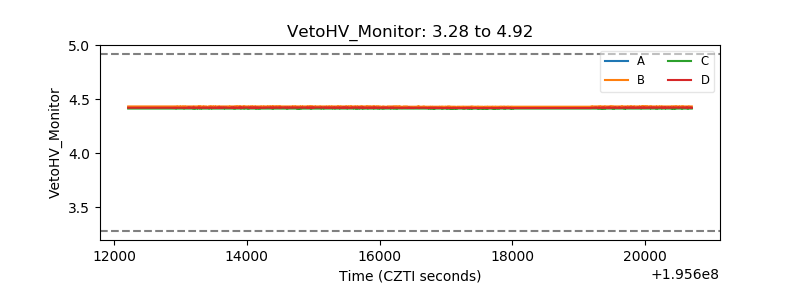 |
| Veto LLD | 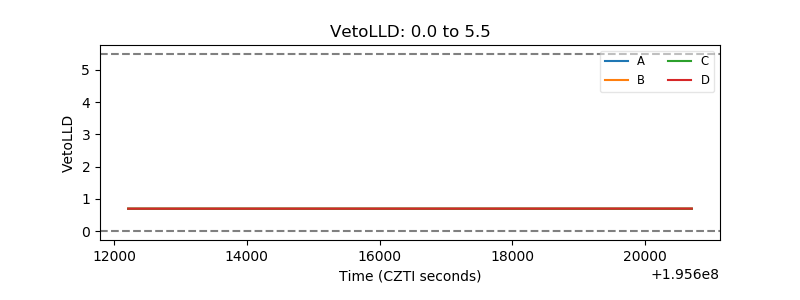 |
| Alpha Counter | 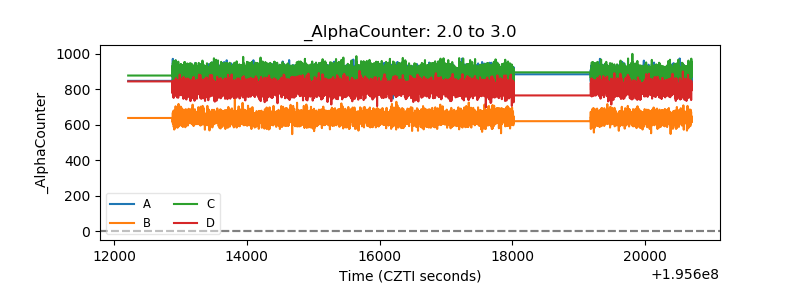 |
| _CPM_Rate | 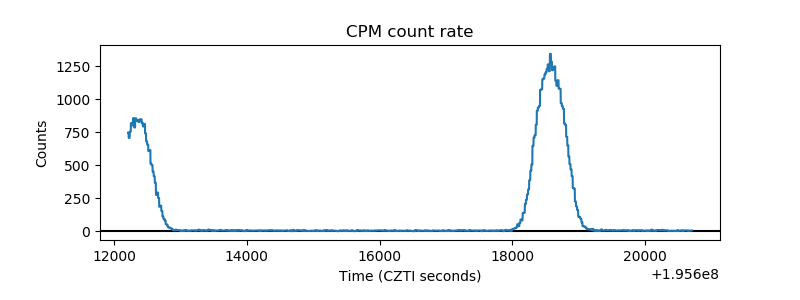 |
| CZT Counter | 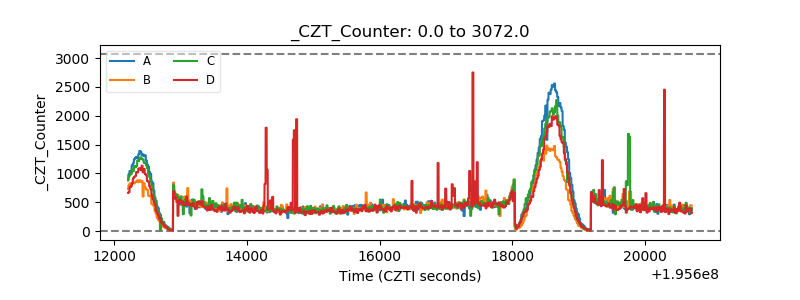 |
| +2.5 Volts monitor |  |
| +5 Volts monitor |  |
| _ROLL_ROT | 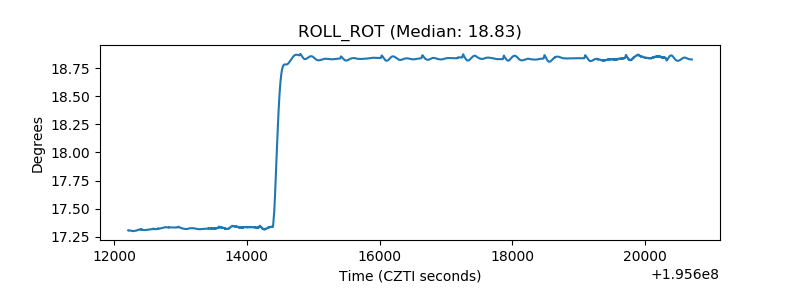 |
| _Roll_DEC | 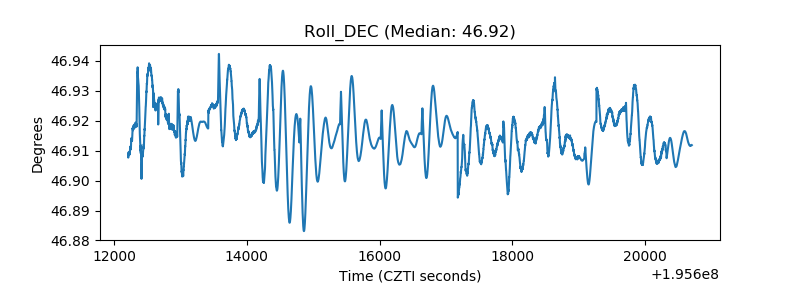 |
| _Roll_RA | 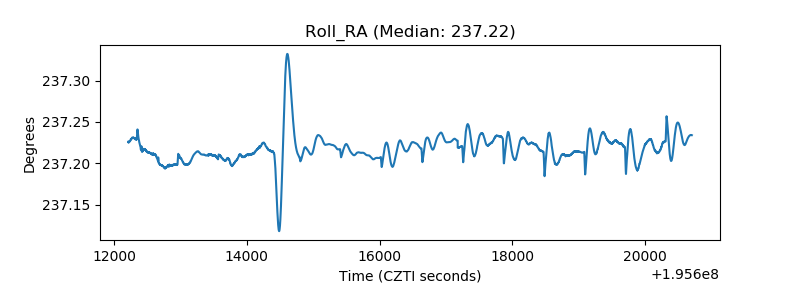 |
| Veto Counter | 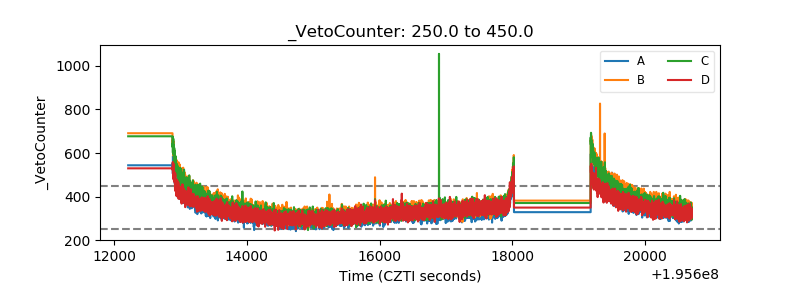 |