| Param | Original file | Final file |
|---|---|---|
| Filename | modeM0/AS1T01_046T01_9000000372_02488cztM0_level2.fits | modeM0/AS1T01_046T01_9000000372_02488cztM0_level2_quad_clean.evt |
| Size (bytes) | 117,564,480 | 39,525,120 |
| Size | 112.1 MB | 37.7 MB |
| Events in quadrant A | 1,059,557 | 266,561 |
| Events in quadrant B | 1,059,463 | 273,148 |
| Events in quadrant C | 1,027,264 | 259,502 |
| Events in quadrant D | 1,031,618 | 238,629 |
| Mode M0 | |||
|---|---|---|---|
| Quadrant | BADHDUFLAG | Total packets | Discarded packets |
| A | 0 | 5294 | 650 |
| B | 0 | 5242 | 662 |
| C | 0 | 5227 | 655 |
| D | 0 | 5607 | 946 |
| Mode M9 | |||
|---|---|---|---|
| Quadrant | BADHDUFLAG | Total packets | Discarded packets |
| A | 0 | 12 | 0 |
| B | 0 | 12 | 0 |
| C | 0 | 12 | 0 |
| D | 0 | 12 | 0 |
| Mode SS | |||
|---|---|---|---|
| Quadrant | BADHDUFLAG | Total packets | Discarded packets |
| A | 0 | 52 | 6 |
| B | 0 | 52 | 6 |
| C | 0 | 52 | 6 |
| D | 0 | 52 | 4 |
| Quadrant | Total seconds | Saturated seconds | Saturation percentage |
|---|---|---|---|
| A | 2205 | 32 | 1.451247% |
| B | 2202 | 29 | 1.316985% |
| C | 2202 | 15 | 0.681199% |
| D | 2185 | 13 | 0.594966% |
Noise dominated data is calculated using 1-second bins in cleaned event files. If a bin has >2000 counts, and if more than 50% of those come from <1% of pixels, then it is considered to be noise-dominated and hence unusable.
| Quadrant | # 1 sec bins | Bins with >0 counts | Bins with >2000 counts | High rate bins dominated by noise | Noise dominated (total time) | Noise dominated (detector-on time) | Marked lightcurve |
|---|---|---|---|---|---|---|---|
| A | 3616 | 2272 | 9 | 9 | 0.25% | 0.40% | 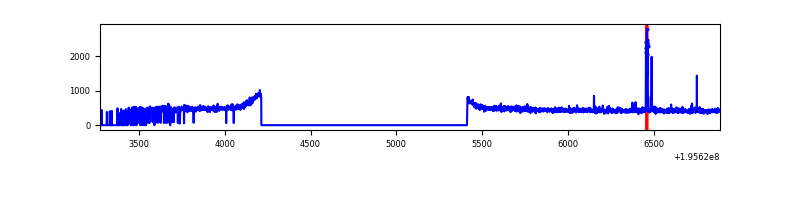 |
| B | 3580 | 2268 | 0 | 0 | 0.00% | 0.00% | 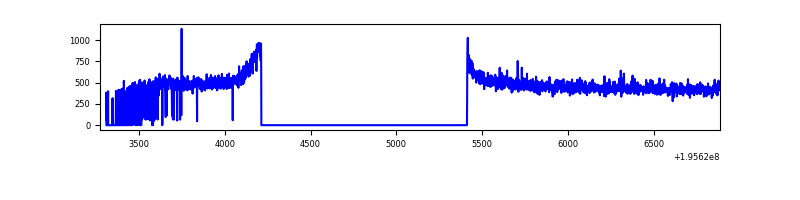 |
| C | 3547 | 2264 | 0 | 0 | 0.00% | 0.00% | 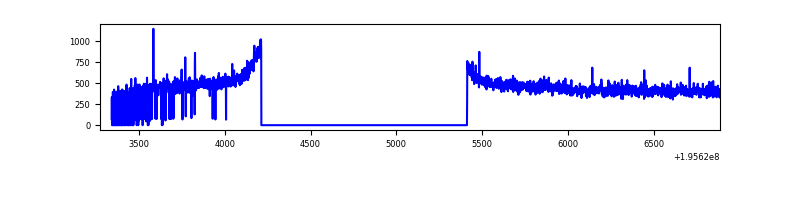 |
| D | 3555 | 2248 | 5 | 5 | 0.14% | 0.22% | 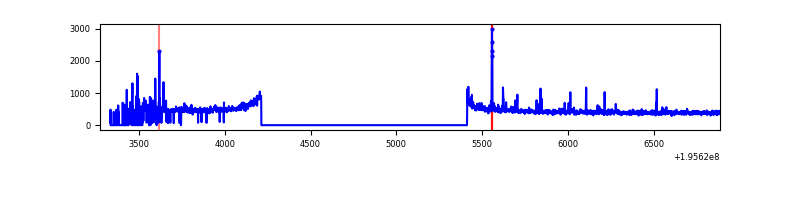 |
Top three noisy pixels from each quadrant. If the there are fewer than three noisy pixels in the level2.evt file, extra rows are filled as -1
| Pixel properties | Quadrant properties | ||||||
|---|---|---|---|---|---|---|---|
| Quadrant | DetID | PixID | Counts | Sigma | Mean | Median | Sigma |
| A | 0 | 199 | 24199 | 427.83 | 267 | 261 | 56.0 |
| A | 0 | 226 | 5178 | 87.88 | 267 | 261 | 56.0 |
| A | 14 | 63 | 3752 | 62.39 | 267 | 261 | 56.0 |
| B | 5 | 6 | 5657 | 99.1 | 273 | 267 | 54.4 |
| B | 12 | 111 | 3848 | 65.84 | 273 | 267 | 54.4 |
| B | 11 | 111 | 3033 | 50.85 | 273 | 267 | 54.4 |
| C | 13 | 61 | 2401 | 34.62 | 260 | 261 | 61.8 |
| C | 10 | 65 | 2319 | 33.3 | 260 | 261 | 61.8 |
| C | 12 | 4 | 1960 | 27.49 | 260 | 261 | 61.8 |
| D | 7 | 67 | 33892 | 551.88 | 253 | 246 | 61.0 |
| D | 2 | 14 | 19711 | 319.28 | 253 | 246 | 61.0 |
| D | 2 | 184 | 10021 | 160.34 | 253 | 246 | 61.0 |
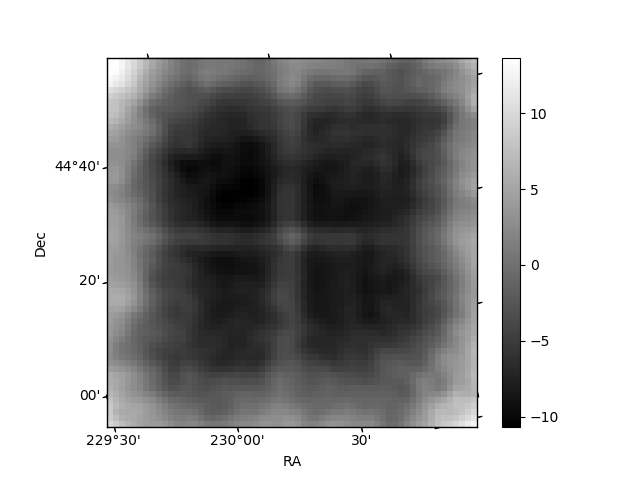
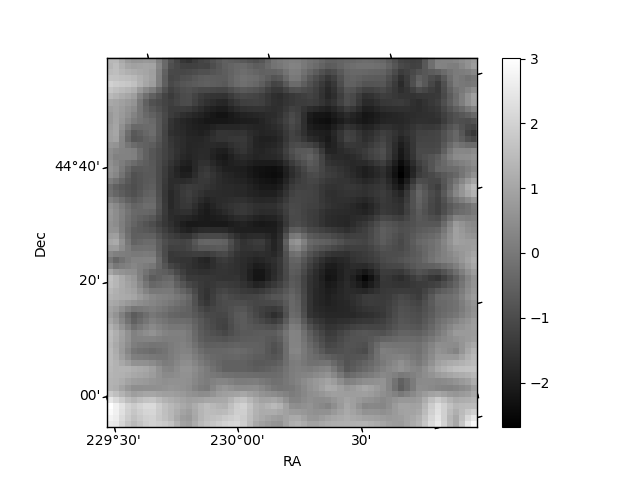
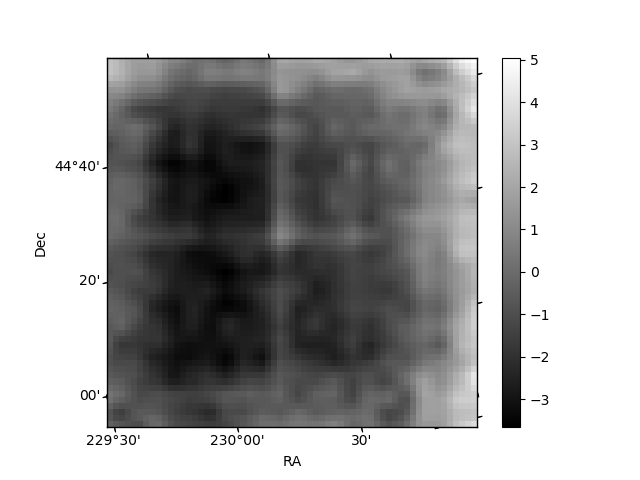
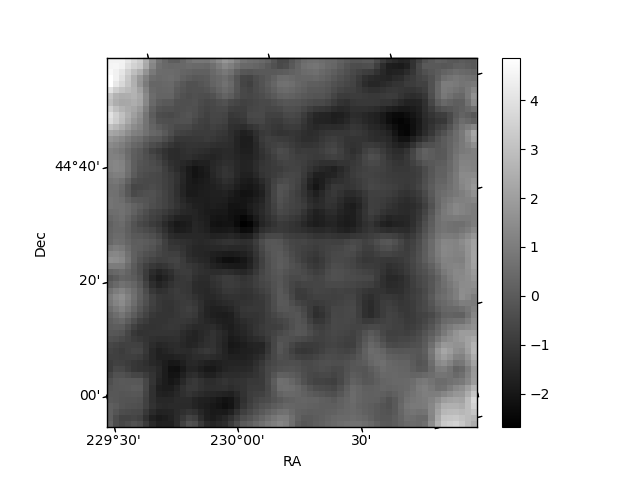
Histogram calculated using DETX and DETY for each event in the final _common_clean file
| Quadrant A | 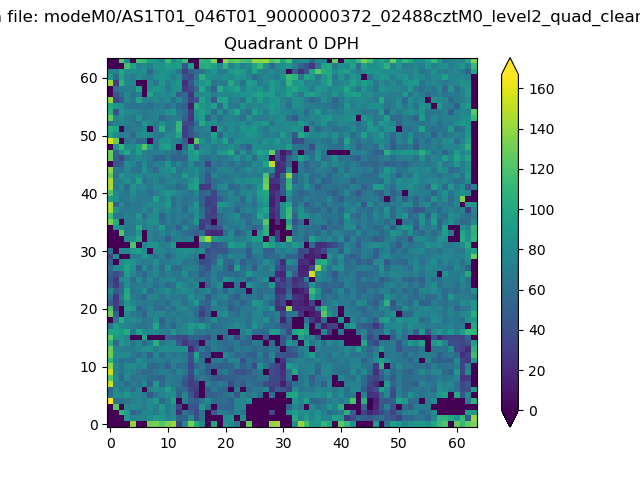 |
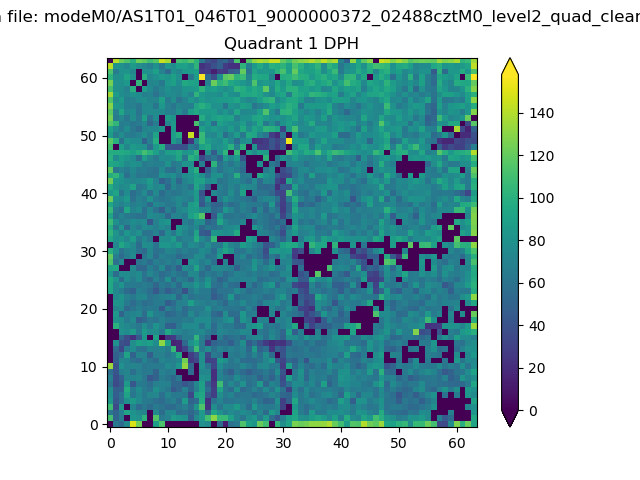 |
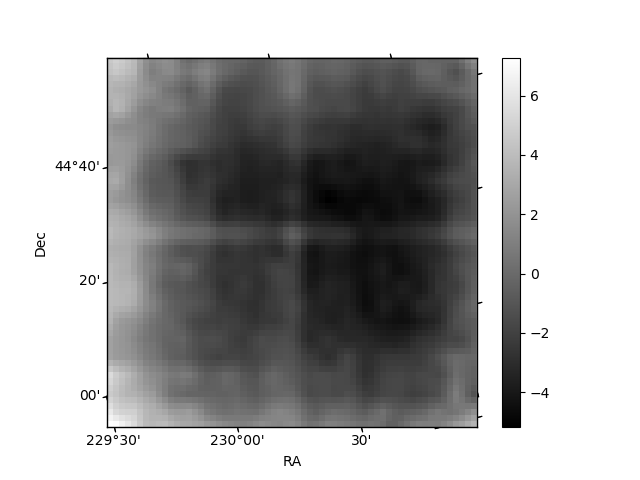
Quadrant B |
|---|---|---|---|
| Quadrant D | 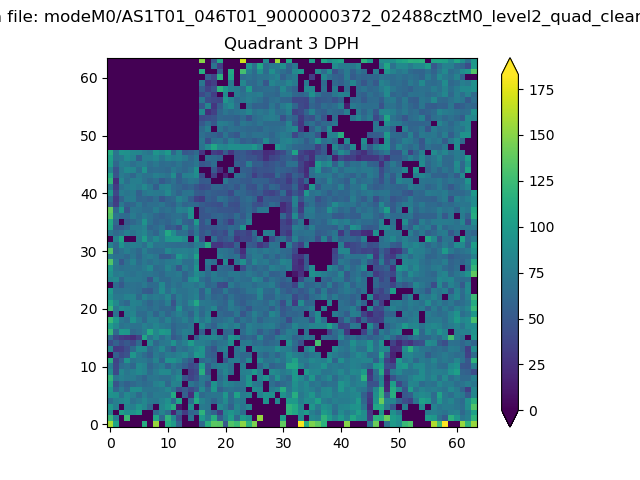 |
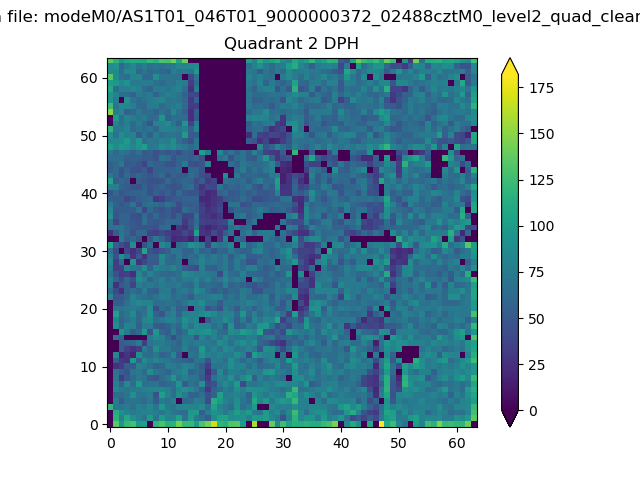 |
Quadrant C |
| Plot type | Count rate plots | Images |
|---|---|---|
| Comparison with Poisson distribution Blue bars denote a histogram of data divided into 1 sec bins. Red curve is a Poisson curve with rate = median count rate of data. |
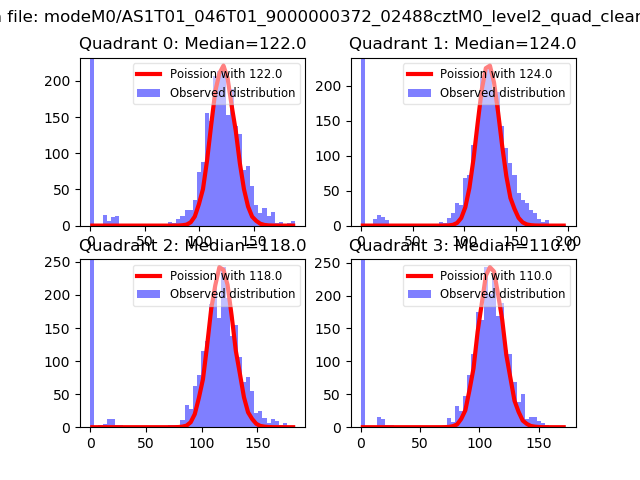 |
 |
| Quadrant-wise count rates Data is divided into 100 sec bins |
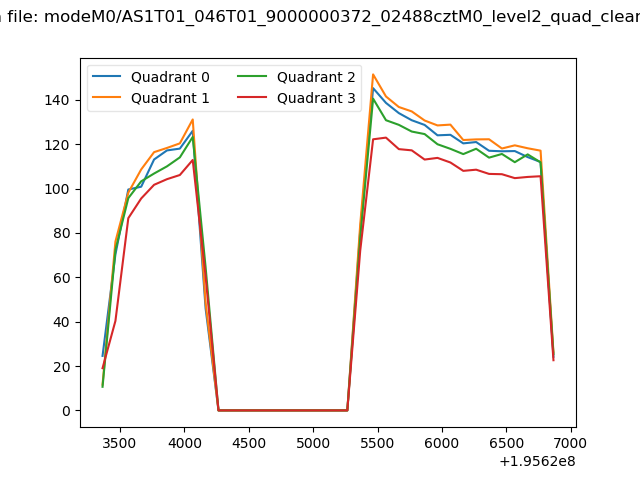 |
|
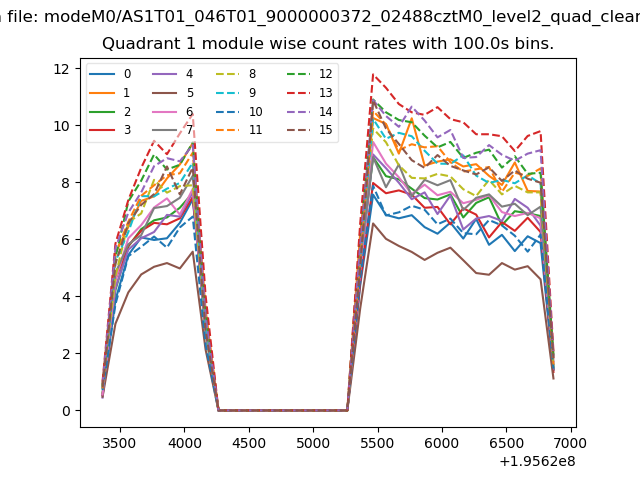
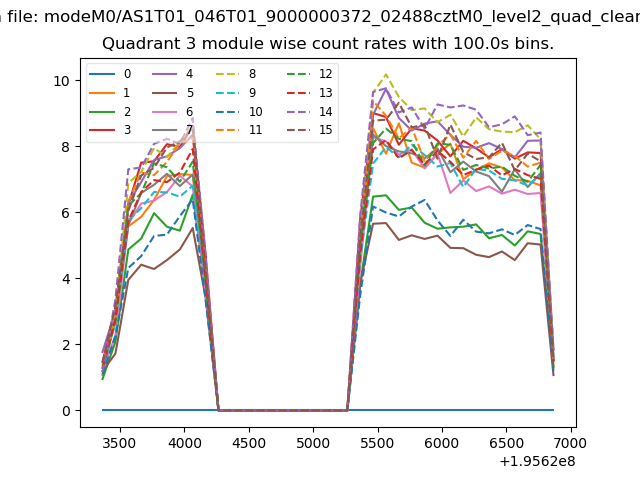
| Module-wise count rates for Quadrant A Data is divided into 100 sec bins |
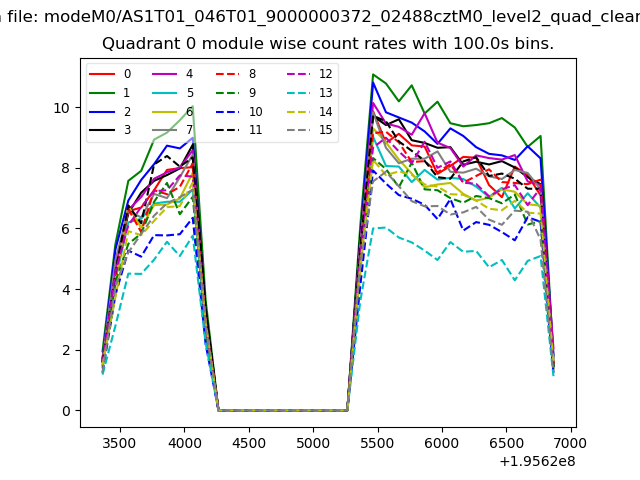 |
 |
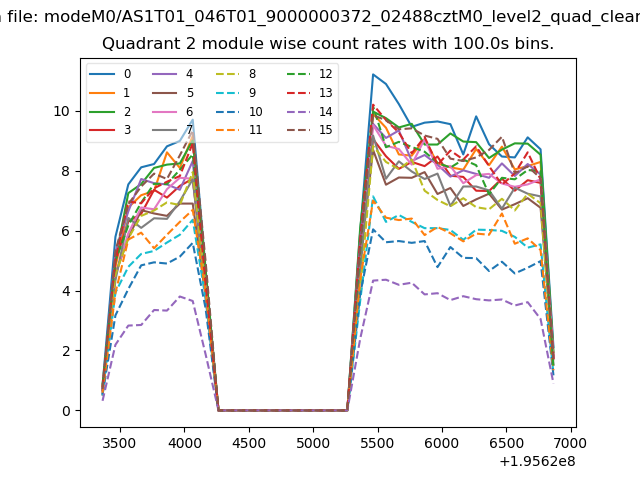
| Module-wise count rates for Quadrant B Data is divided into 100 sec bins |
 |
 |
| Module-wise count rates for Quadrant C Data is divided into 100 sec bins |
 |
 |
| Module-wise count rates for Quadrant D Data is divided into 100 sec bins |
 |
 |
| Parameter | Plot |
|---|---|
| CZT HV Monitor | 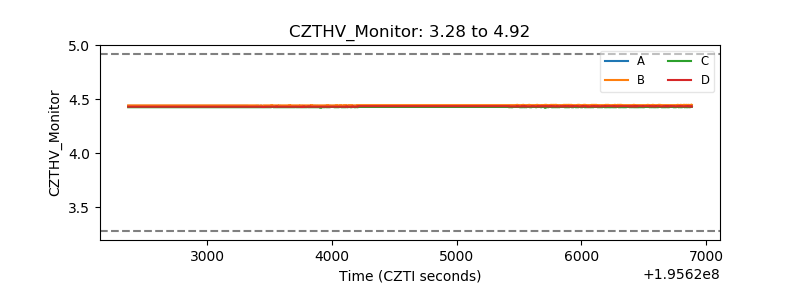 |
| D_VDD | 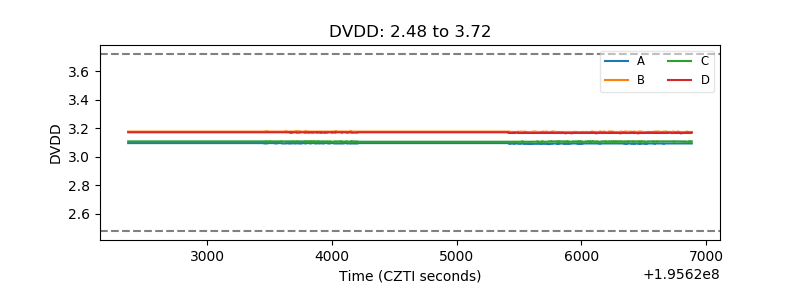 |
| Temperature 1 | 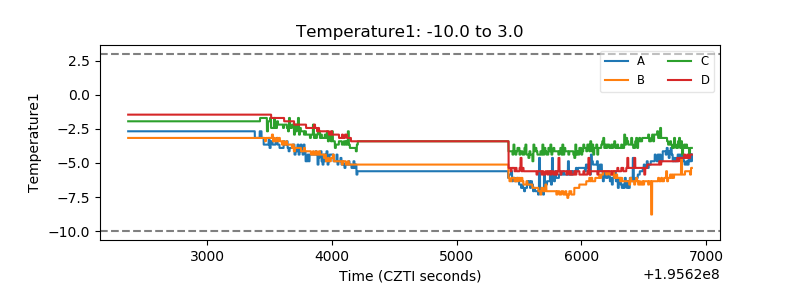 |
| Veto HV Monitor | 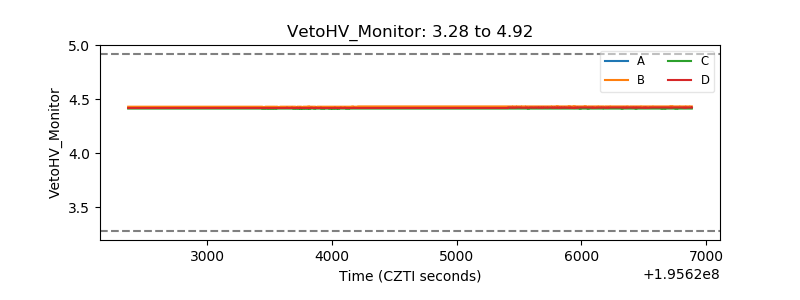 |
| Veto LLD | 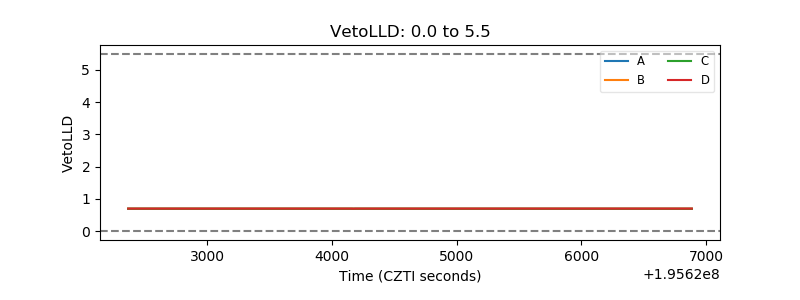 |
| Alpha Counter | 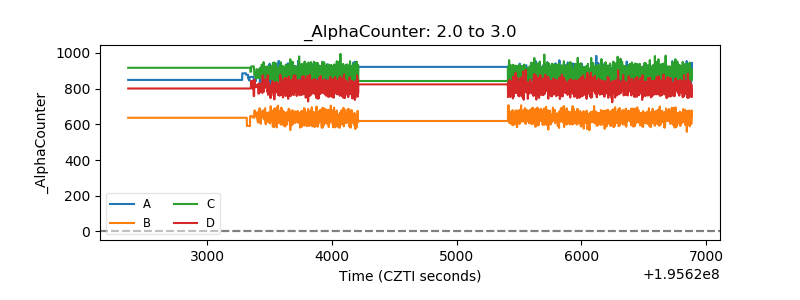 |
| _CPM_Rate | 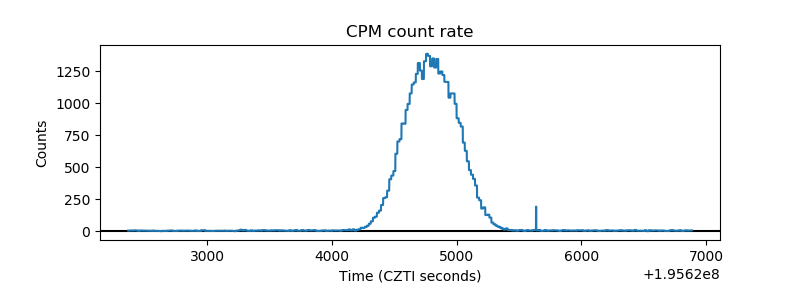 |
| CZT Counter | 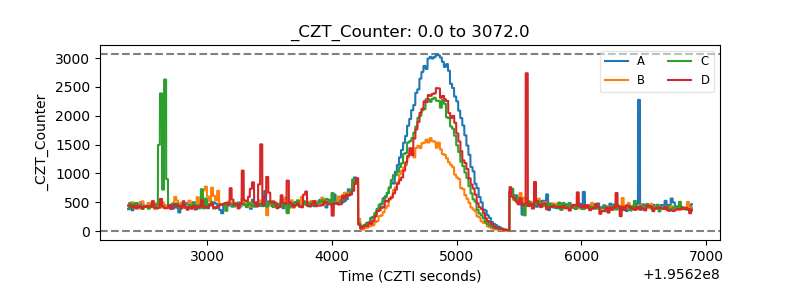 |
| +2.5 Volts monitor |  |
| +5 Volts monitor | 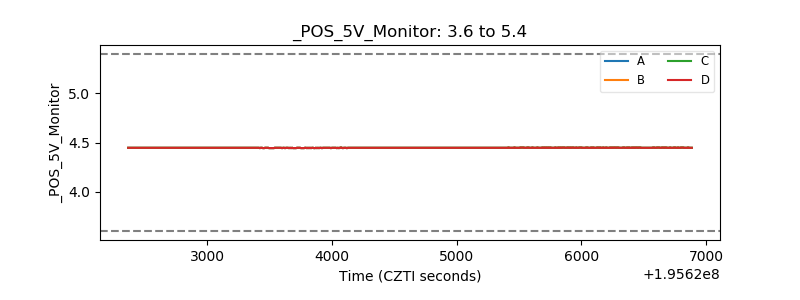 |
| _ROLL_ROT | 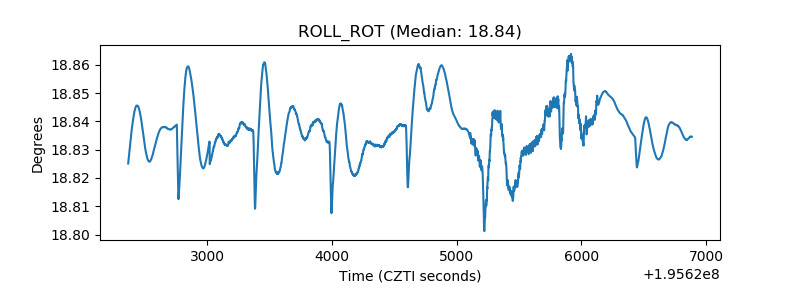 |
| _Roll_DEC | 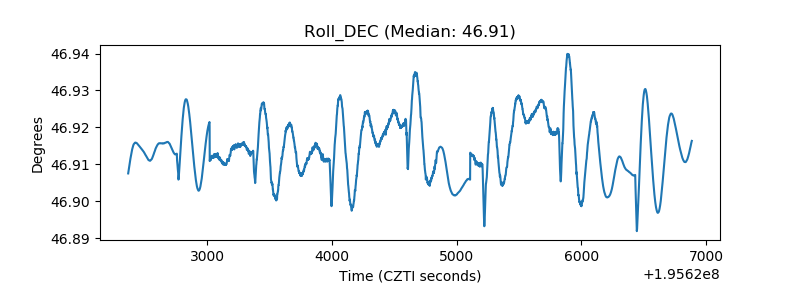 |
| _Roll_RA | 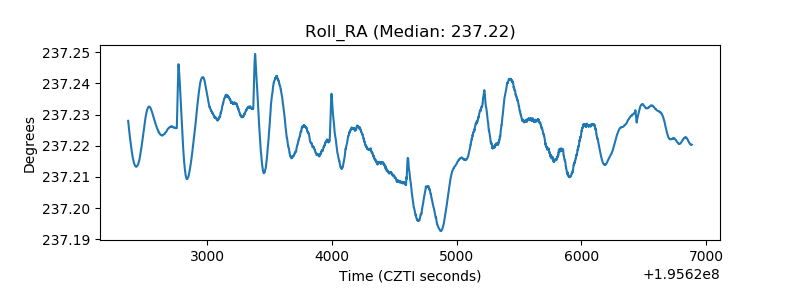 |
| Veto Counter | 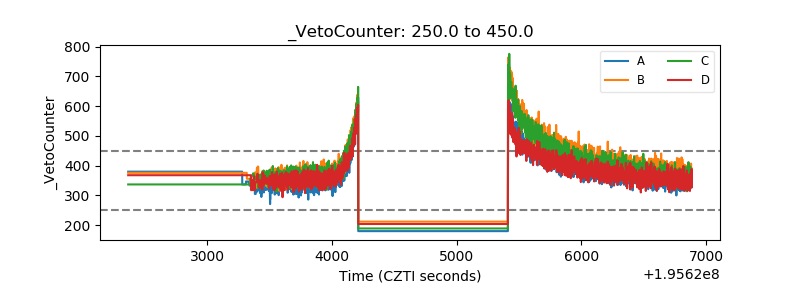 |