| Param | Original file | Final file |
|---|---|---|
| Filename | modeM0/AS1T01_046T01_9000000372_02489cztM0_level2.evt | modeM0/AS1T01_046T01_9000000372_02489cztM0_level2_quad_clean.evt |
| Size (bytes) | 651,139,200 | 135,521,280 |
| Size | 621.0 MB | 129.2 MB |
| Events in quadrant A | 4,712,842 | 840,600 |
| Events in quadrant B | 4,825,821 | 864,901 |
| Events in quadrant C | 4,697,897 | 848,406 |
| Events in quadrant D | 4,766,596 | 819,177 |
| Mode M0 | |||
|---|---|---|---|
| Quadrant | BADHDUFLAG | Total packets | Discarded packets |
| A | 0 | 21512 | 3 |
| B | 0 | 21667 | 2 |
| C | 0 | 21773 | 2 |
| D | 0 | 22286 | 2 |
| Mode M9 | |||
|---|---|---|---|
| Quadrant | BADHDUFLAG | Total packets | Discarded packets |
| A | 0 | 25 | 0 |
| B | 0 | 25 | 0 |
| C | 0 | 25 | 0 |
| D | 0 | 25 | 0 |
| Mode SS | |||
|---|---|---|---|
| Quadrant | BADHDUFLAG | Total packets | Discarded packets |
| A | 0 | 216 | 0 |
| B | 0 | 216 | 0 |
| C | 0 | 216 | 0 |
| D | 0 | 216 | 0 |
| Quadrant | Total seconds | Saturated seconds | Saturation percentage |
|---|---|---|---|
| A | 10559 | 46 | 0.435647% |
| B | 10559 | 50 | 0.473530% |
| C | 10559 | 58 | 0.549294% |
| D | 10559 | 48 | 0.454589% |
Noise dominated data is calculated using 1-second bins in cleaned event files. If a bin has >2000 counts, and if more than 50% of those come from <1% of pixels, then it is considered to be noise-dominated and hence unusable.
| Quadrant | # 1 sec bins | Bins with >0 counts | Bins with >2000 counts | High rate bins dominated by noise | Noise dominated (total time) | Noise dominated (detector-on time) | Marked lightcurve |
|---|---|---|---|---|---|---|---|
| A | 13035 | 10561 | 9 | 9 | 0.07% | 0.09% |  |
| B | 13034 | 10560 | 2 | 2 | 0.02% | 0.02% | 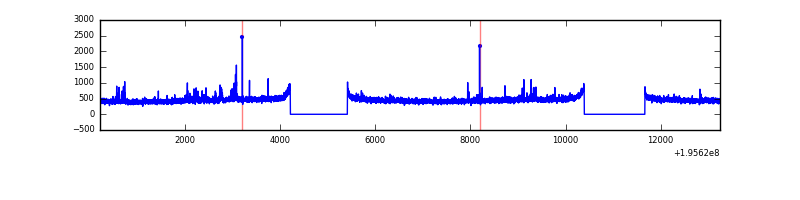 |
| C | 13034 | 10560 | 23 | 23 | 0.18% | 0.22% | 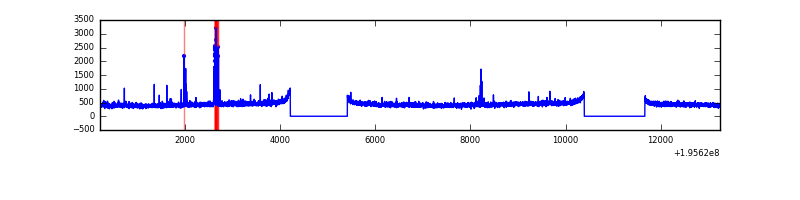 |
| D | 13034 | 10560 | 28 | 28 | 0.21% | 0.27% | 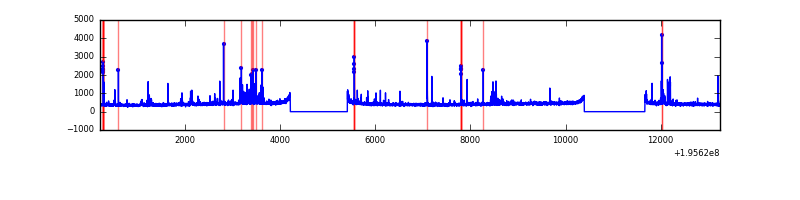 |
Top three noisy pixels from each quadrant. If the there are fewer than three noisy pixels in the level2.evt file, extra rows are filled as -1
| Pixel properties | Quadrant properties | ||||||
|---|---|---|---|---|---|---|---|
| Quadrant | DetID | PixID | Counts | Sigma | Mean | Median | Sigma |
| A | 0 | 199 | 38053 | 151.29 | 1210 | 1185 | 243.7 |
| A | 0 | 226 | 16790 | 64.04 | 1210 | 1185 | 243.7 |
| A | 12 | 194 | 13704 | 51.37 | 1210 | 1185 | 243.7 |
| B | 5 | 6 | 46158 | 195.55 | 1223 | 1193 | 229.9 |
| B | 5 | 172 | 29588 | 123.49 | 1223 | 1193 | 229.9 |
| B | 4 | 200 | 17653 | 71.58 | 1223 | 1193 | 229.9 |
| C | 10 | 65 | 113185 | 420.52 | 1160 | 1166 | 266.4 |
| C | 0 | 207 | 18782 | 66.13 | 1160 | 1166 | 266.4 |
| C | 12 | 4 | 17176 | 60.1 | 1160 | 1166 | 266.4 |
| D | 7 | 67 | 162785 | 594.59 | 1154 | 1127 | 271.9 |
| D | 2 | 14 | 89336 | 324.44 | 1154 | 1127 | 271.9 |
| D | 10 | 102 | 53894 | 194.08 | 1154 | 1127 | 271.9 |
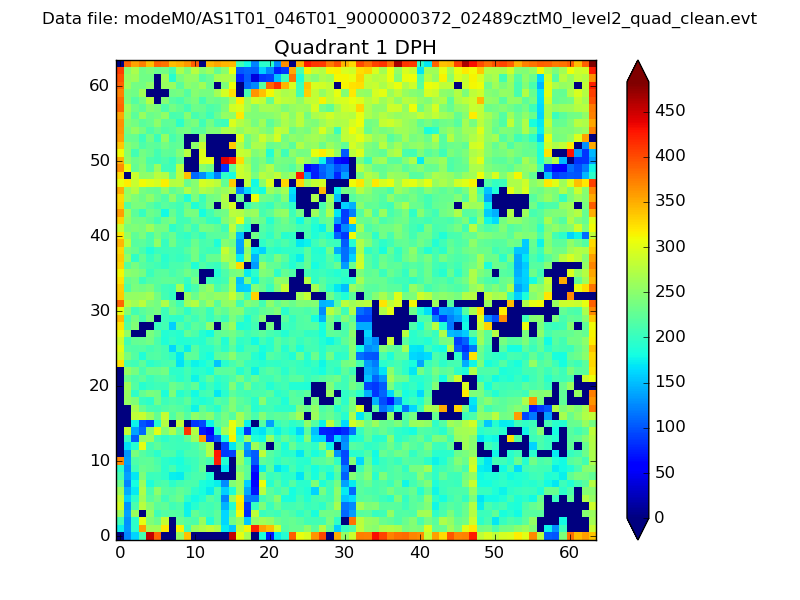
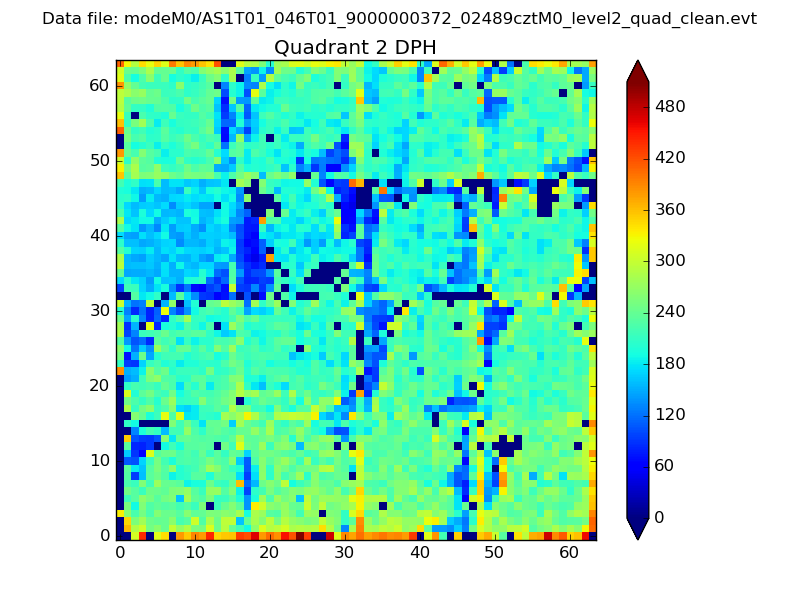
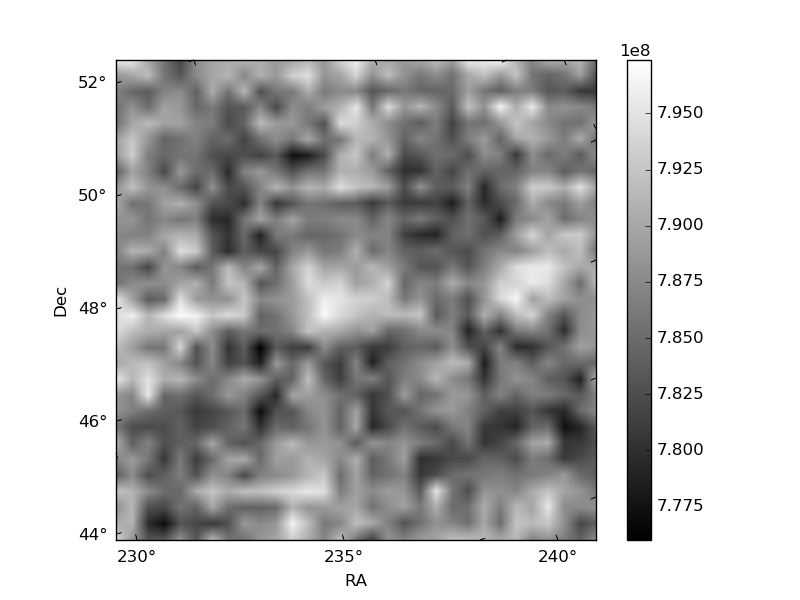
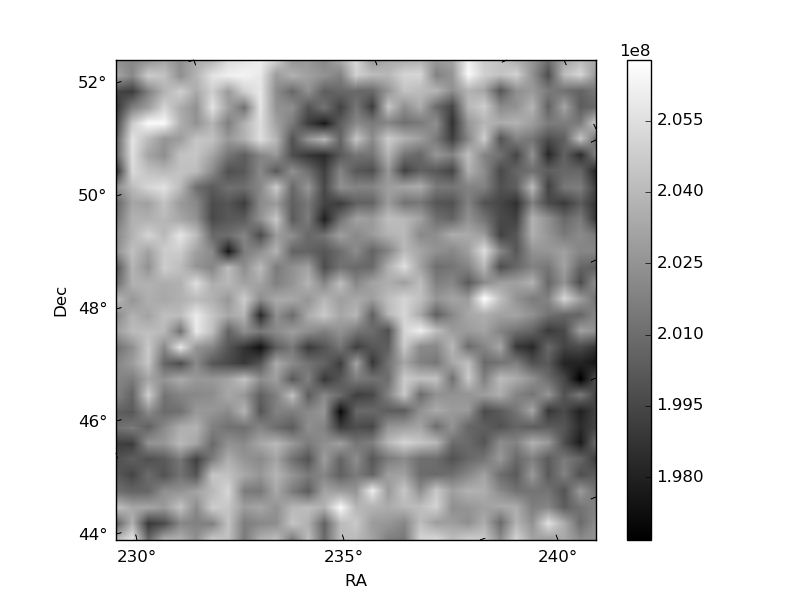
Histogram calculated using DETX and DETY for each event in the final _common_clean file
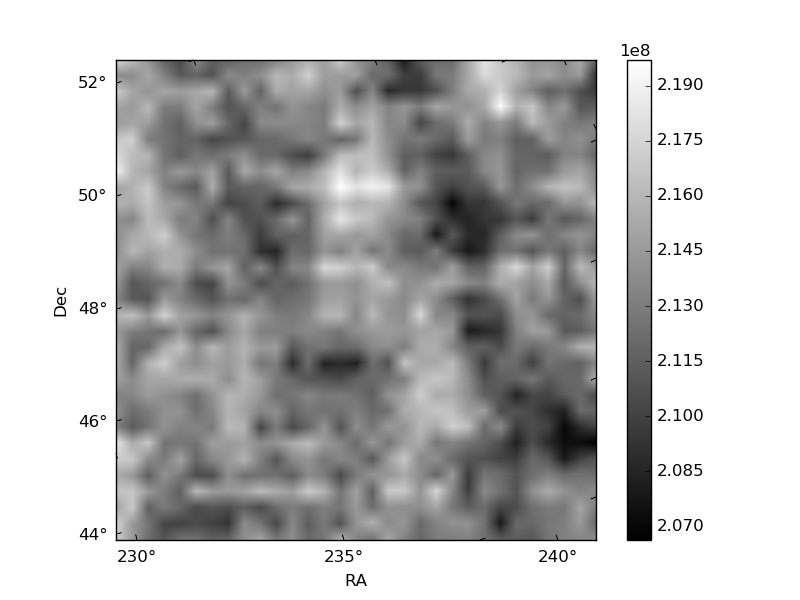
| Quadrant A | 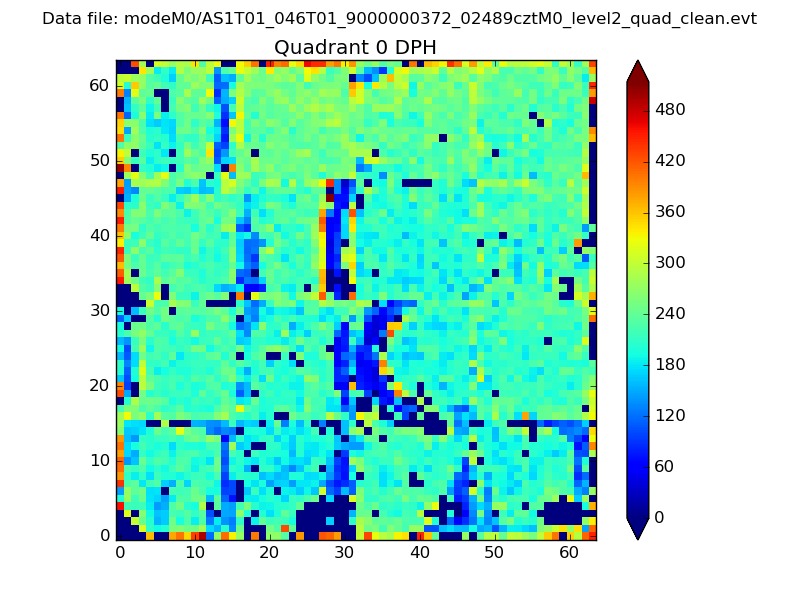 |
 |
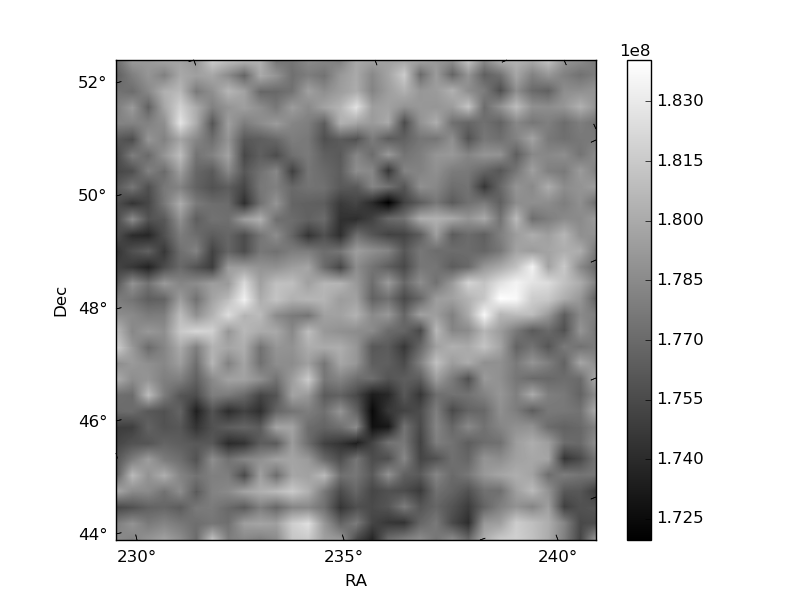
Quadrant B |
|---|---|---|---|
| Quadrant D | 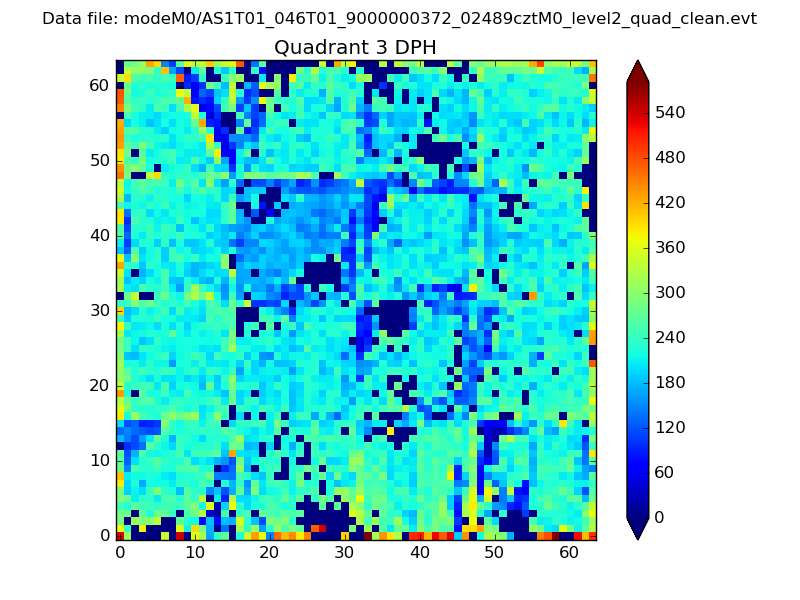 |
 |
Quadrant C |
| Plot type | Count rate plots | Images |
|---|---|---|
| Comparison with Poisson distribution Blue bars denote a histogram of data divided into 1 sec bins. Red curve is a Poisson curve with rate = median count rate of data. |
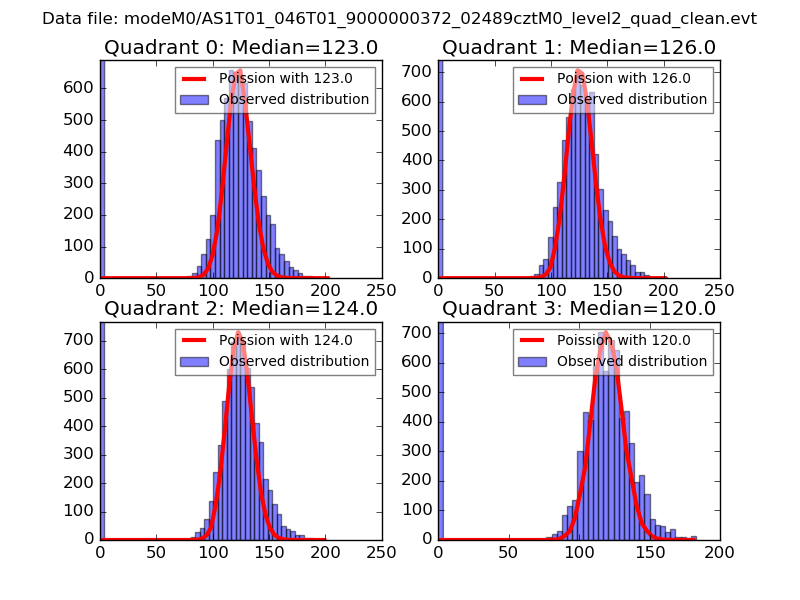 |
 |
| Quadrant-wise count rates Data is divided into 100 sec bins |
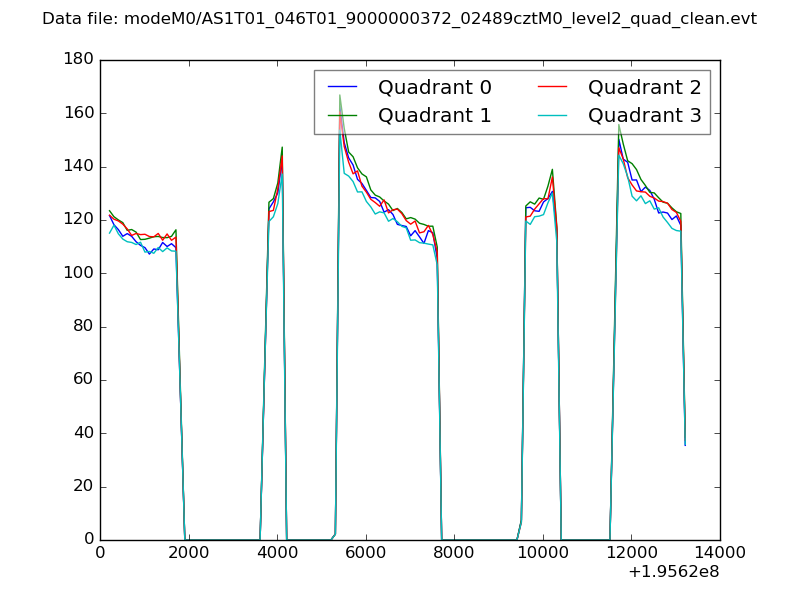 |
|
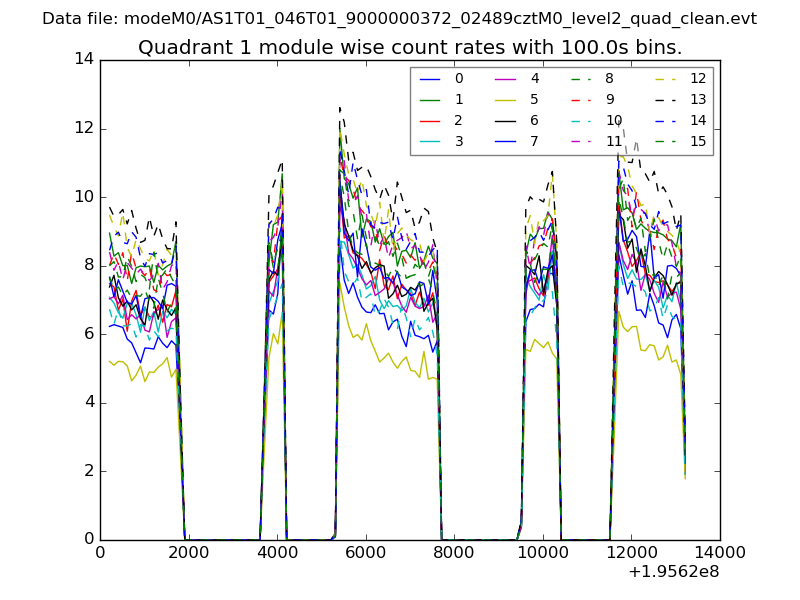
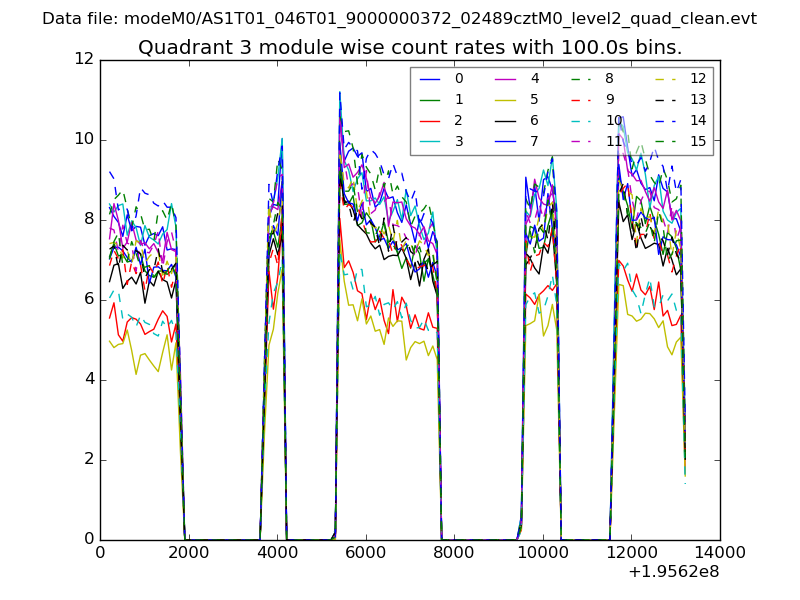
| Module-wise count rates for Quadrant A Data is divided into 100 sec bins |
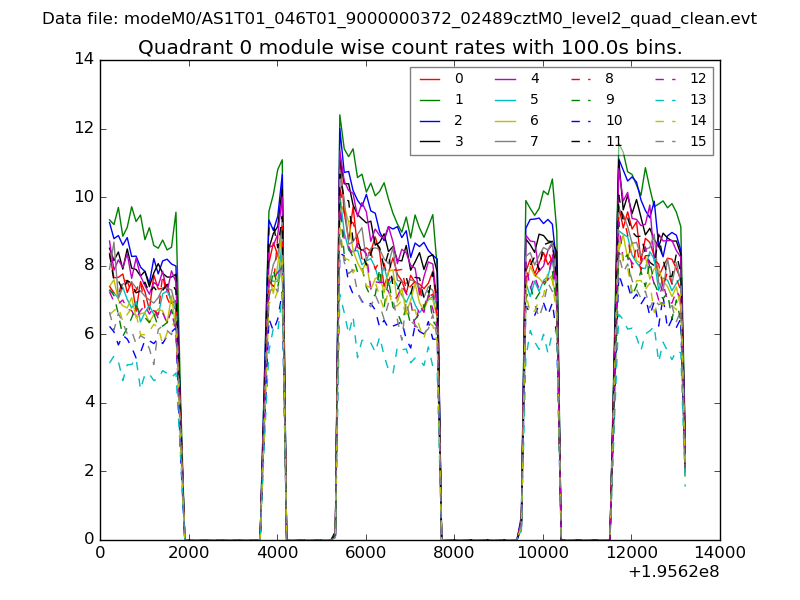 |
 |
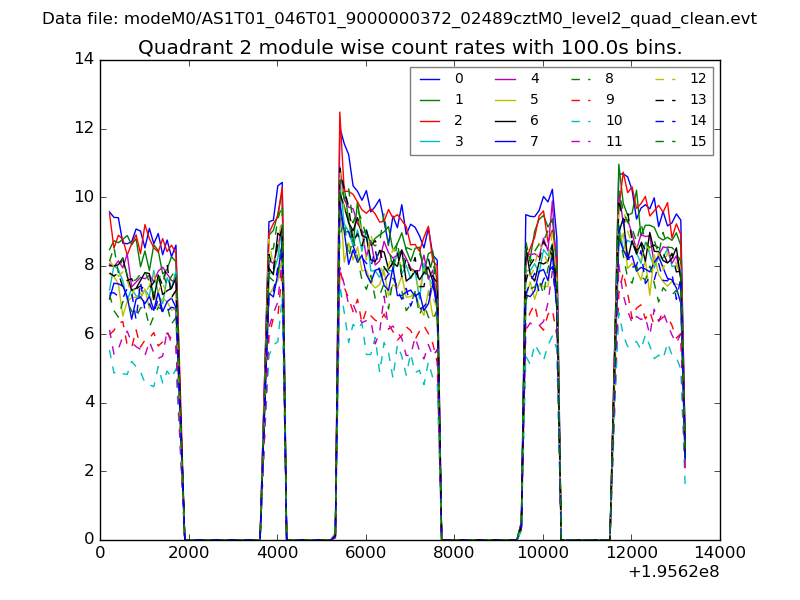
| Module-wise count rates for Quadrant B Data is divided into 100 sec bins |
 |
 |
| Module-wise count rates for Quadrant C Data is divided into 100 sec bins |
 |
 |
| Module-wise count rates for Quadrant D Data is divided into 100 sec bins |
 |
 |
| Parameter | Plot |
|---|---|
| CZT HV Monitor | 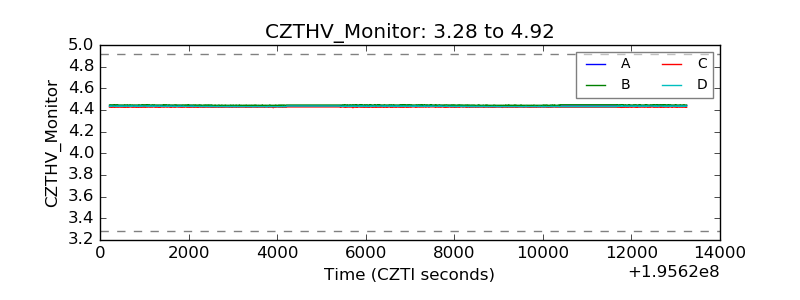 |
| D_VDD |  |
| Temperature 1 | 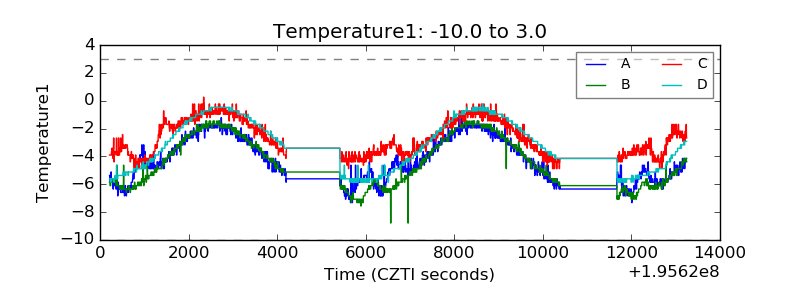 |
| Veto HV Monitor | 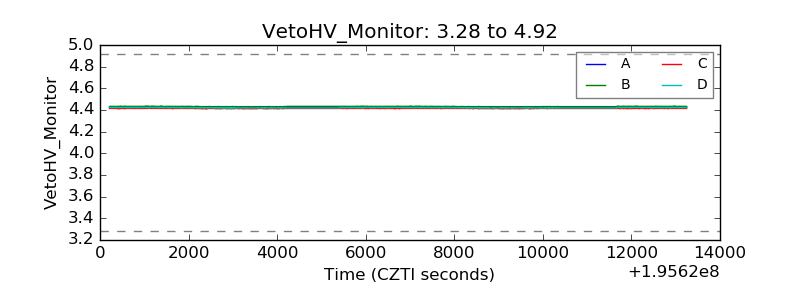 |
| Veto LLD | 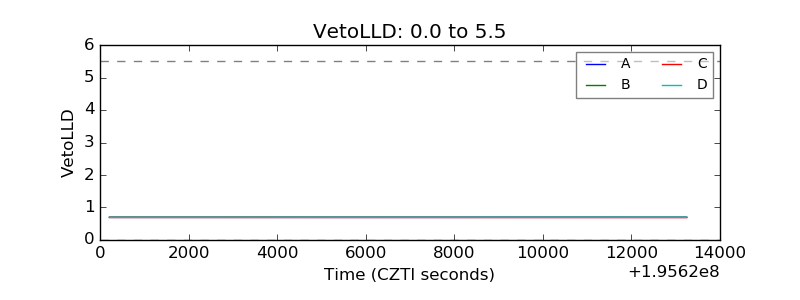 |
| Alpha Counter | 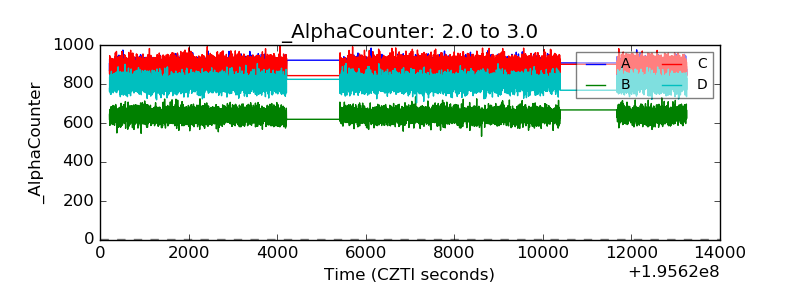 |
| _CPM_Rate | 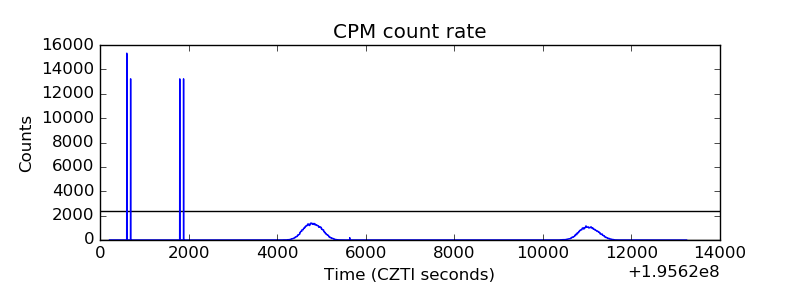 |
| CZT Counter | 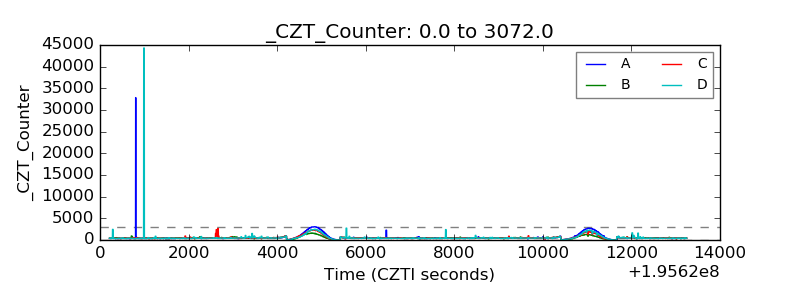 |
| +2.5 Volts monitor |  |
| +5 Volts monitor | 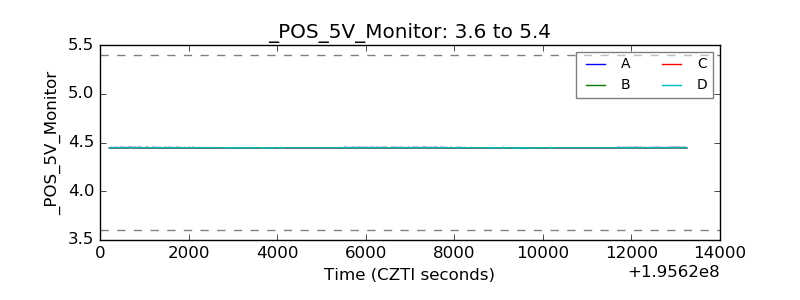 |
| _ROLL_ROT | 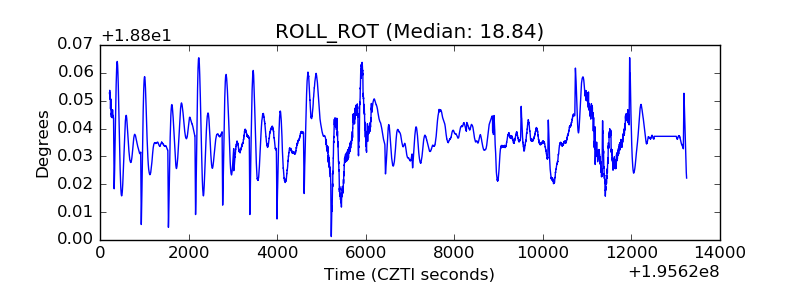 |
| _Roll_DEC | 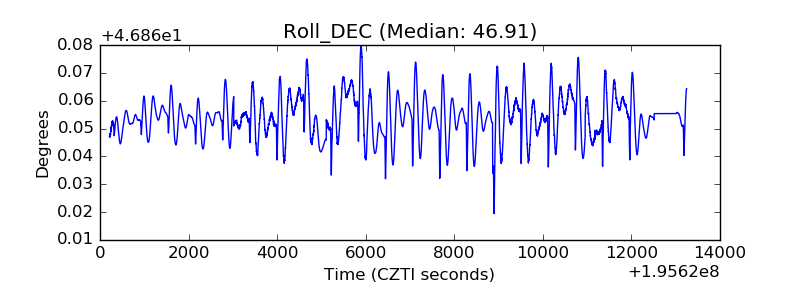 |
| _Roll_RA | 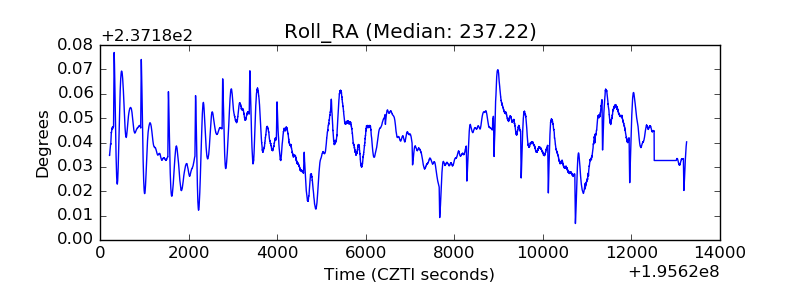 |
| Veto Counter | 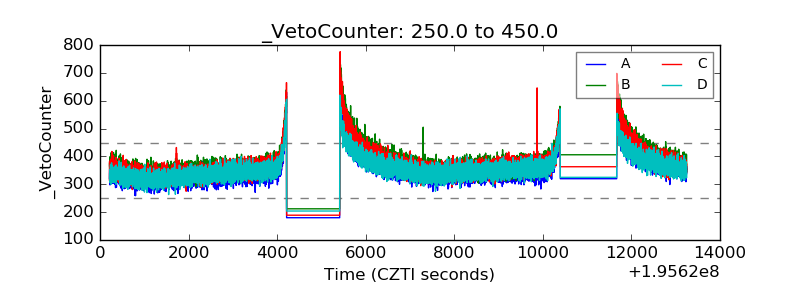 |