| Param | Original file | Final file |
|---|---|---|
| Filename | modeM0/AS1T01_046T01_9000000372_02490cztM0_level2.fits | modeM0/AS1T01_046T01_9000000372_02490cztM0_level2_quad_clean.evt |
| Size (bytes) | 302,904,000 | 99,970,560 |
| Size | 288.9 MB | 95.3 MB |
| Events in quadrant A | 2,660,146 | 670,882 |
| Events in quadrant B | 2,760,051 | 687,166 |
| Events in quadrant C | 2,590,878 | 653,420 |
| Events in quadrant D | 2,742,734 | 604,576 |
| Mode M0 | |||
|---|---|---|---|
| Quadrant | BADHDUFLAG | Total packets | Discarded packets |
| A | 0 | 12048 | 2 |
| B | 0 | 12164 | 1 |
| C | 0 | 12002 | 1 |
| D | 0 | 12555 | 1 |
| Mode M9 | |||
|---|---|---|---|
| Quadrant | BADHDUFLAG | Total packets | Discarded packets |
| A | 0 | 12 | 0 |
| B | 0 | 12 | 0 |
| C | 0 | 12 | 0 |
| D | 0 | 12 | 0 |
| Mode SS | |||
|---|---|---|---|
| Quadrant | BADHDUFLAG | Total packets | Discarded packets |
| A | 0 | 120 | 0 |
| B | 0 | 120 | 0 |
| C | 0 | 120 | 0 |
| D | 0 | 120 | 0 |
| Quadrant | Total seconds | Saturated seconds | Saturation percentage |
|---|---|---|---|
| A | 5879 | 95 | 1.615921% |
| B | 5879 | 104 | 1.769008% |
| C | 5879 | 54 | 0.918524% |
| D | 5879 | 68 | 1.156659% |
Noise dominated data is calculated using 1-second bins in cleaned event files. If a bin has >2000 counts, and if more than 50% of those come from <1% of pixels, then it is considered to be noise-dominated and hence unusable.
| Quadrant | # 1 sec bins | Bins with >0 counts | Bins with >2000 counts | High rate bins dominated by noise | Noise dominated (total time) | Noise dominated (detector-on time) | Marked lightcurve |
|---|---|---|---|---|---|---|---|
| A | 7059 | 5880 | 1 | 1 | 0.01% | 0.02% | 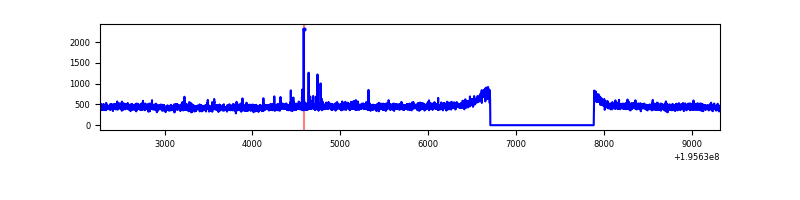 |
| B | 7059 | 5880 | 4 | 4 | 0.06% | 0.07% |  |
| C | 7059 | 5880 | 0 | 0 | 0.00% | 0.00% | 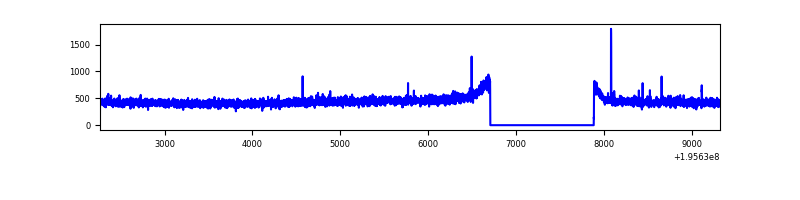 |
| D | 7059 | 5880 | 8 | 8 | 0.11% | 0.14% | 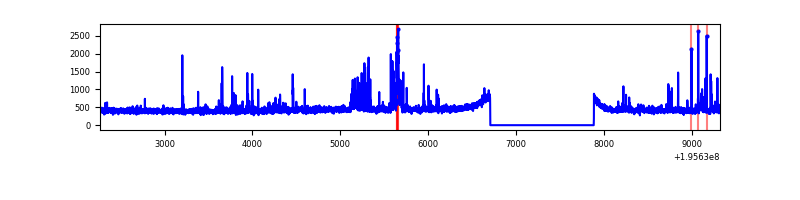 |
Top three noisy pixels from each quadrant. If the there are fewer than three noisy pixels in the level2.evt file, extra rows are filled as -1
| Pixel properties | Quadrant properties | ||||||
|---|---|---|---|---|---|---|---|
| Quadrant | DetID | PixID | Counts | Sigma | Mean | Median | Sigma |
| A | 14 | 235 | 14920 | 101.99 | 686 | 671 | 139.7 |
| A | 12 | 194 | 7889 | 51.67 | 686 | 671 | 139.7 |
| A | 0 | 226 | 7508 | 48.94 | 686 | 671 | 139.7 |
| B | 4 | 200 | 57838 | 437.41 | 690 | 673 | 130.7 |
| B | 15 | 85 | 25382 | 189.07 | 690 | 673 | 130.7 |
| B | 15 | 186 | 9421 | 66.94 | 690 | 673 | 130.7 |
| C | 10 | 65 | 10666 | 65.83 | 657 | 660 | 152.0 |
| C | 13 | 61 | 5843 | 34.1 | 657 | 660 | 152.0 |
| C | 12 | 4 | 3916 | 21.42 | 657 | 660 | 152.0 |
| D | 7 | 67 | 110298 | 707.58 | 655 | 639 | 155.0 |
| D | 2 | 184 | 58555 | 373.7 | 655 | 639 | 155.0 |
| D | 13 | 53 | 49645 | 316.21 | 655 | 639 | 155.0 |
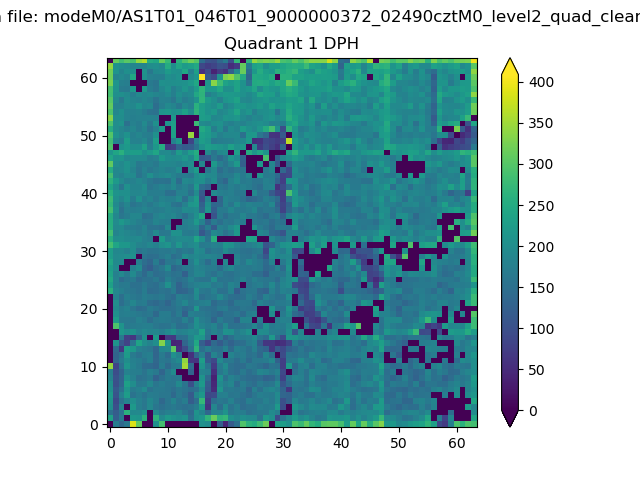
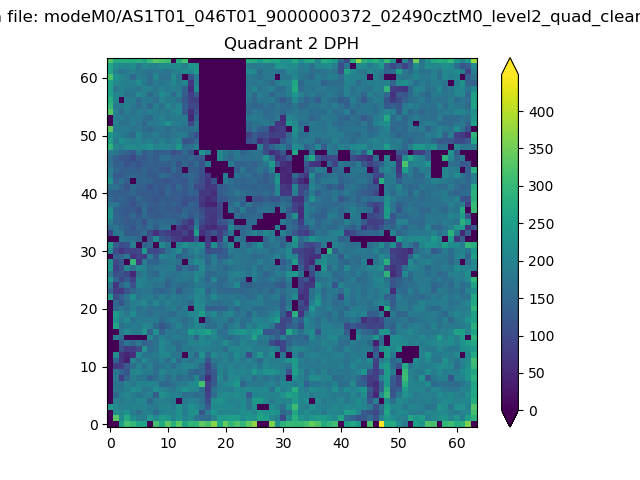
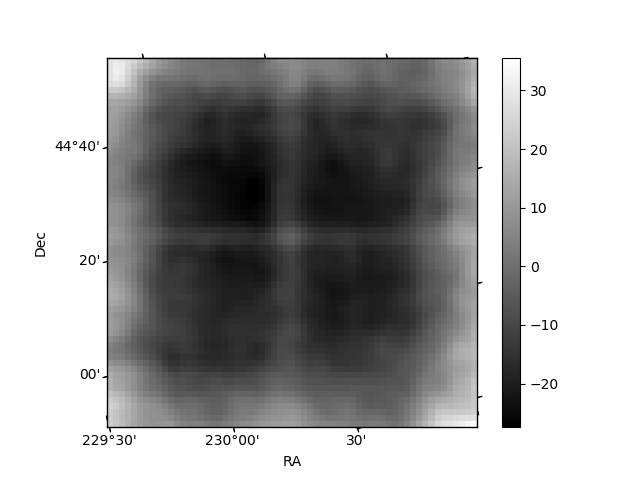
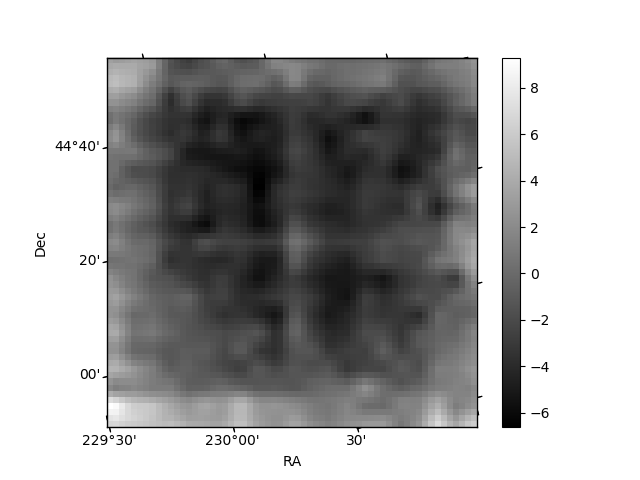
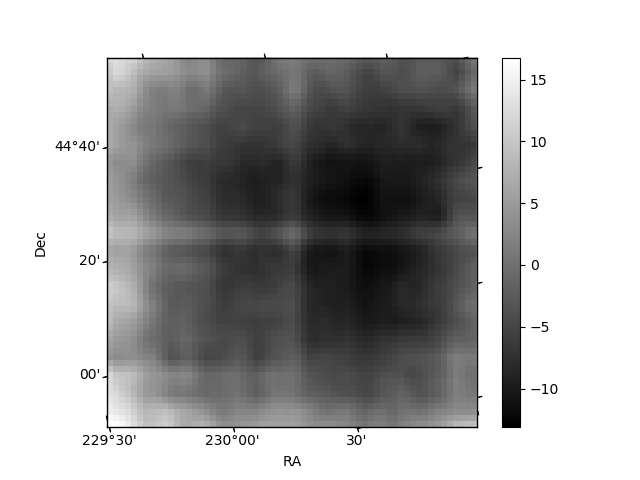
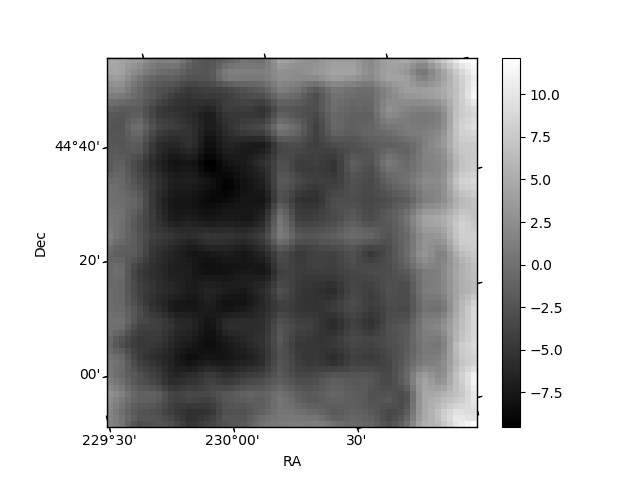
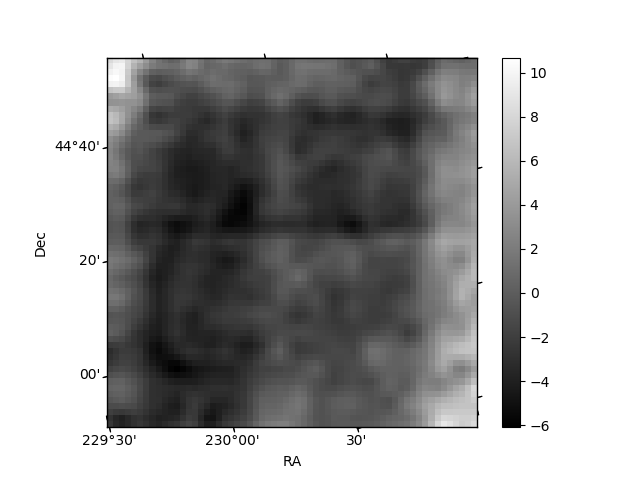
Histogram calculated using DETX and DETY for each event in the final _common_clean file
| Quadrant A | 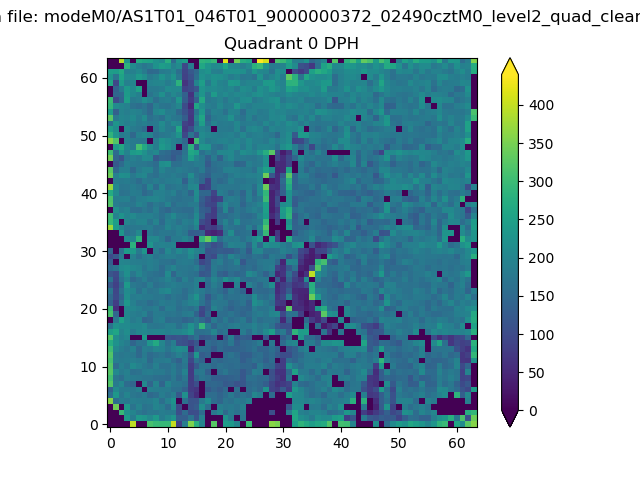 |
 |
Quadrant B |
|---|---|---|---|
| Quadrant D | 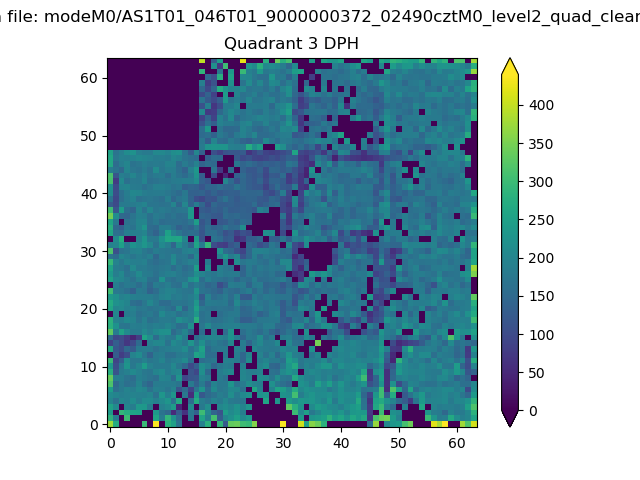 |
 |
Quadrant C |
| Plot type | Count rate plots | Images |
|---|---|---|
| Comparison with Poisson distribution Blue bars denote a histogram of data divided into 1 sec bins. Red curve is a Poisson curve with rate = median count rate of data. |
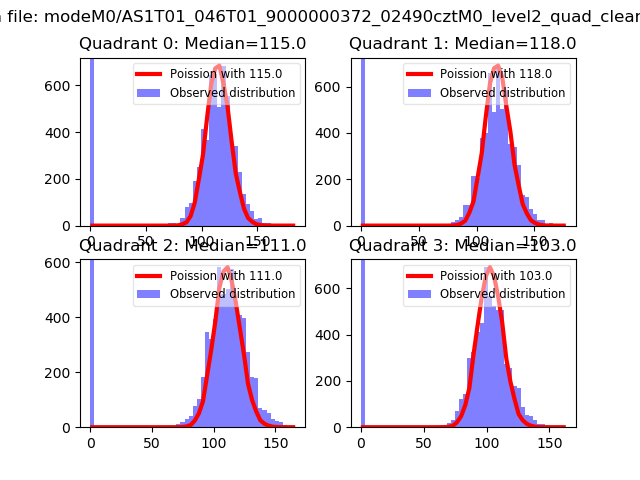 |
 |
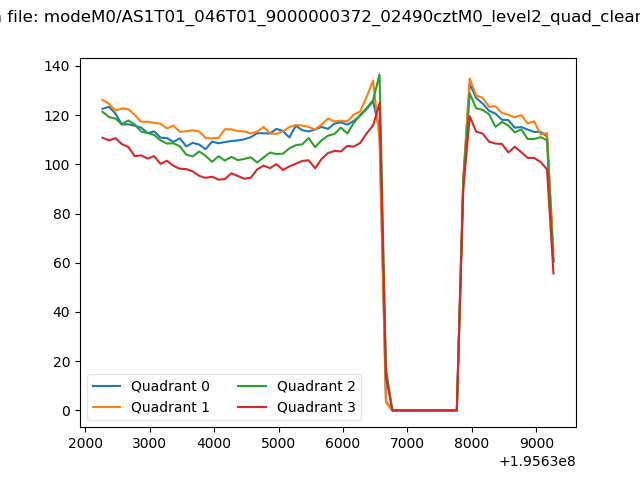
| Quadrant-wise count rates Data is divided into 100 sec bins |
 |
|
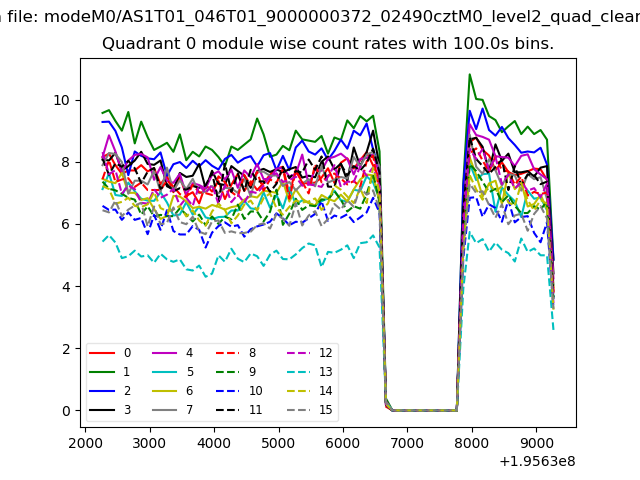
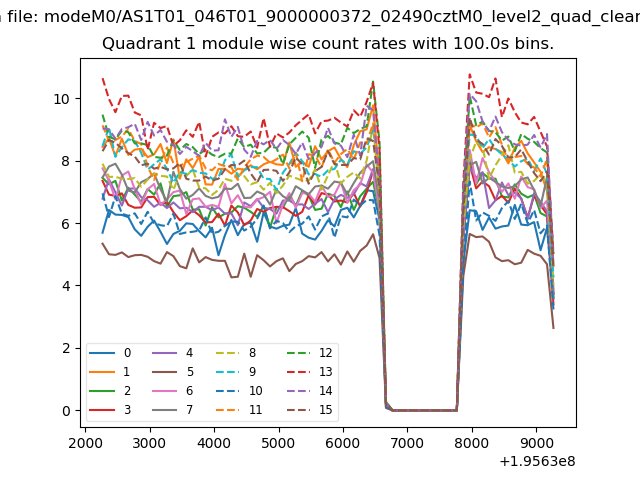
| Module-wise count rates for Quadrant A Data is divided into 100 sec bins |
 |
 |
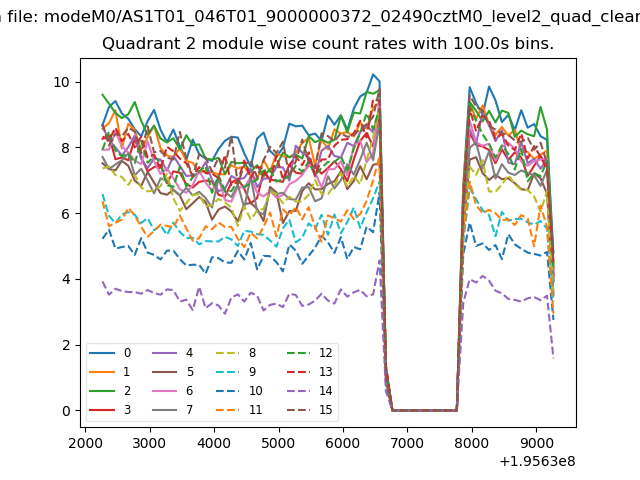
| Module-wise count rates for Quadrant B Data is divided into 100 sec bins |
 |
 |
| Module-wise count rates for Quadrant C Data is divided into 100 sec bins |
 |
 |
| Module-wise count rates for Quadrant D Data is divided into 100 sec bins |
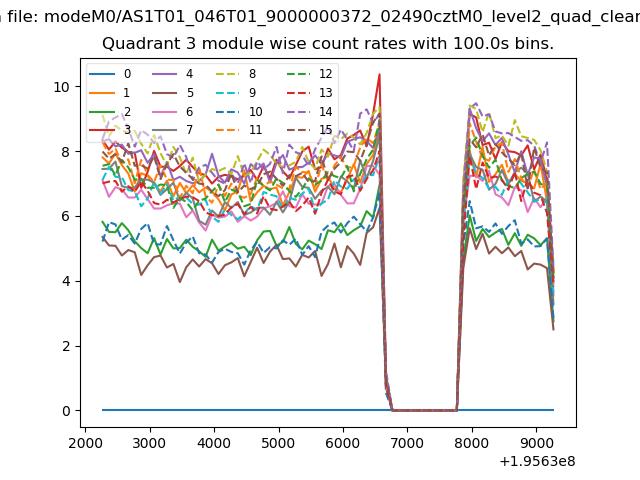 |
 |
| Parameter | Plot |
|---|---|
| CZT HV Monitor | 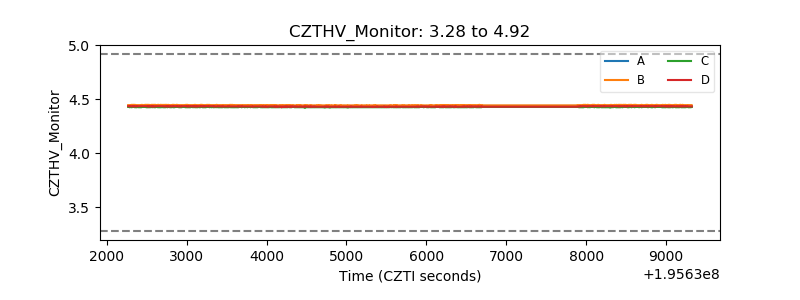 |
| D_VDD | 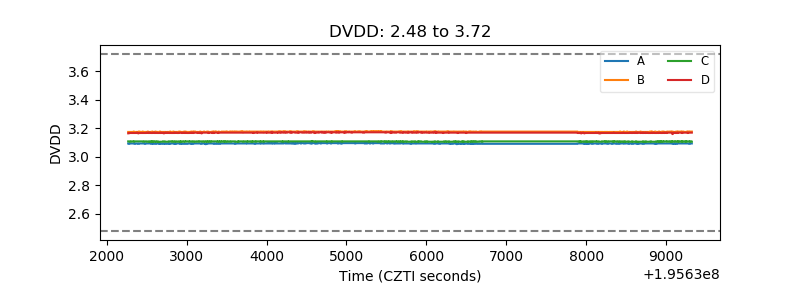 |
| Temperature 1 | 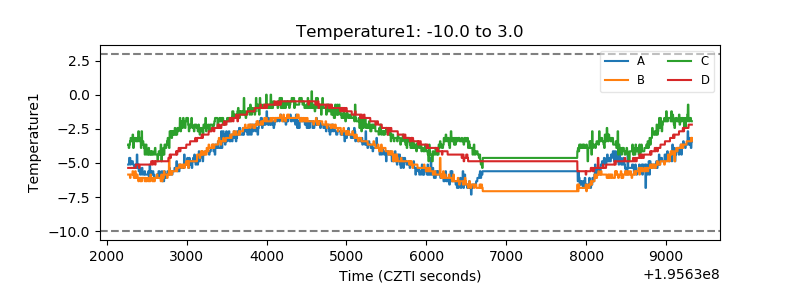 |
| Veto HV Monitor | 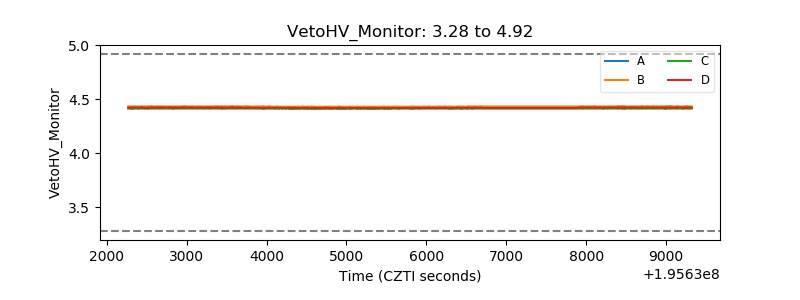 |
| Veto LLD | 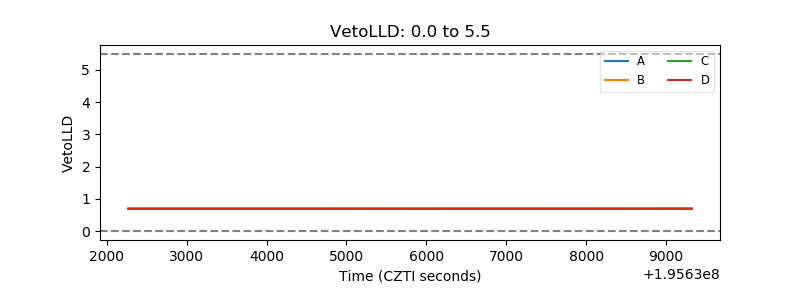 |
| Alpha Counter | 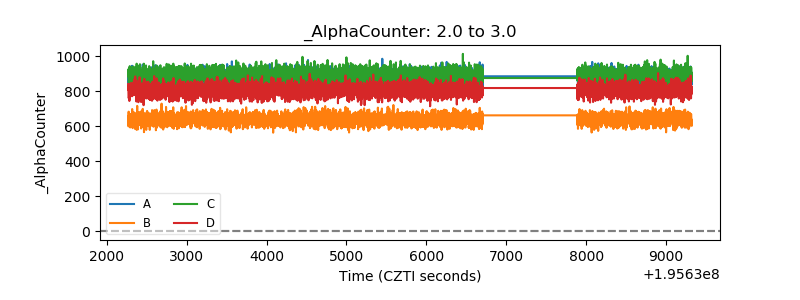 |
| _CPM_Rate | 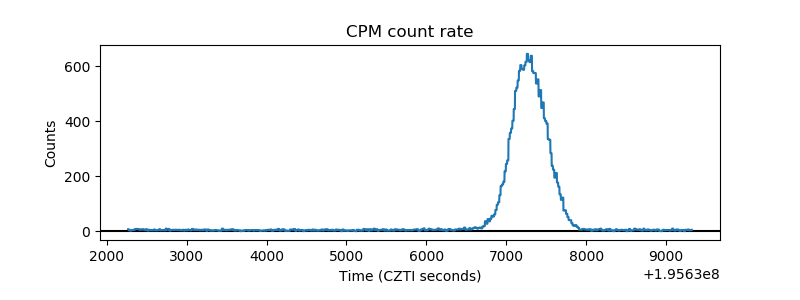 |
| CZT Counter | 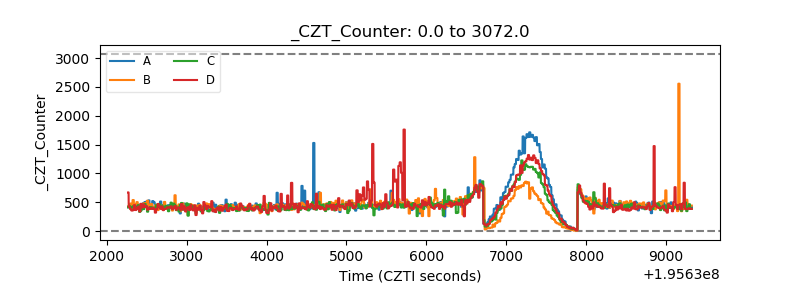 |
| +2.5 Volts monitor | 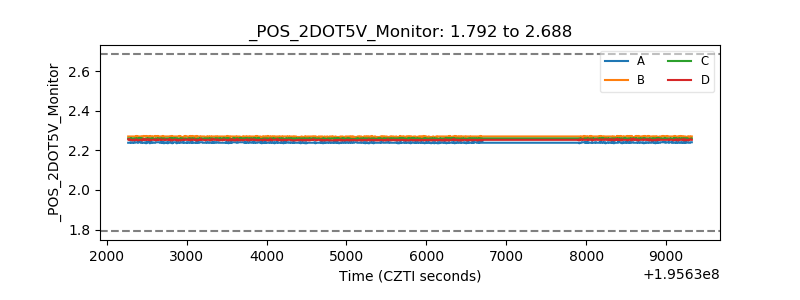 |
| +5 Volts monitor | 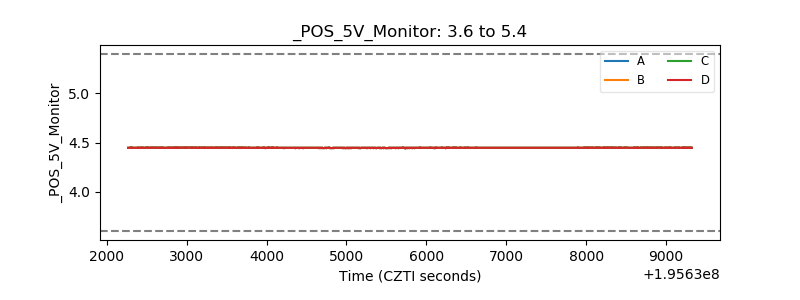 |
| _ROLL_ROT | 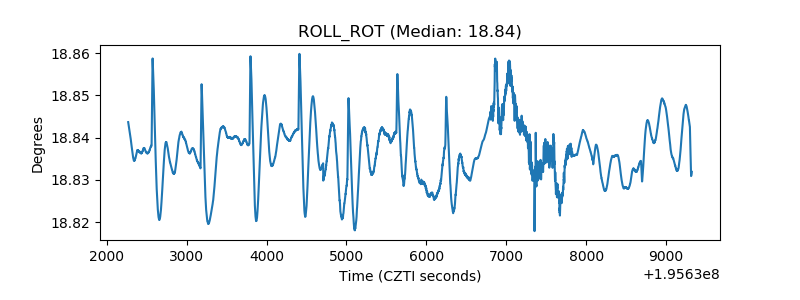 |
| _Roll_DEC | 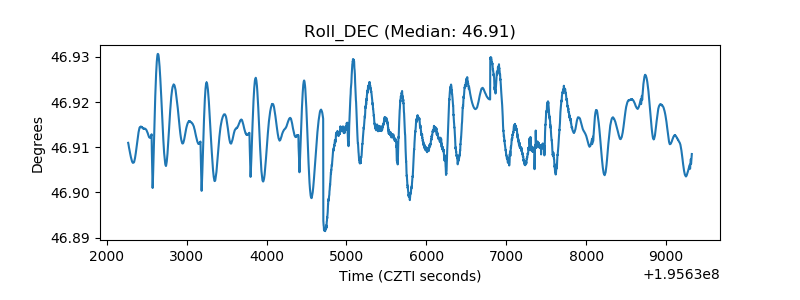 |
| _Roll_RA | 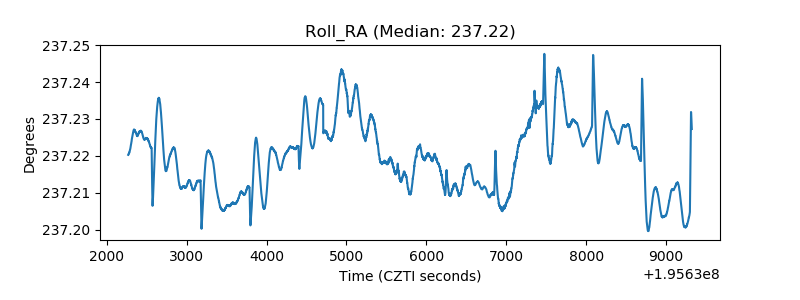 |
| Veto Counter | 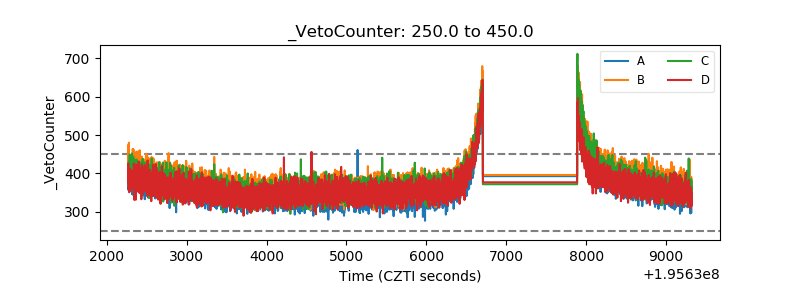 |