| Param | Original file | Final file |
|---|---|---|
| Filename | modeM0/AS1T01_046T01_9000000372_02491cztM0_level2.fits | modeM0/AS1T01_046T01_9000000372_02491cztM0_level2_quad_clean.evt |
| Size (bytes) | 299,462,400 | 95,993,280 |
| Size | 285.6 MB | 91.5 MB |
| Events in quadrant A | 2,543,862 | 643,266 |
| Events in quadrant B | 2,645,590 | 659,525 |
| Events in quadrant C | 2,523,230 | 624,282 |
| Events in quadrant D | 2,922,433 | 576,130 |
| Mode M0 | |||
|---|---|---|---|
| Quadrant | BADHDUFLAG | Total packets | Discarded packets |
| A | 0 | 11690 | 2 |
| B | 0 | 11798 | 1 |
| C | 0 | 11685 | 1 |
| D | 0 | 12866 | 1 |
| Mode M9 | |||
|---|---|---|---|
| Quadrant | BADHDUFLAG | Total packets | Discarded packets |
| A | 0 | 11 | 0 |
| B | 0 | 11 | 0 |
| C | 0 | 11 | 0 |
| D | 0 | 11 | 0 |
| Mode SS | |||
|---|---|---|---|
| Quadrant | BADHDUFLAG | Total packets | Discarded packets |
| A | 0 | 118 | 0 |
| B | 0 | 118 | 0 |
| C | 0 | 118 | 0 |
| D | 0 | 118 | 0 |
| Quadrant | Total seconds | Saturated seconds | Saturation percentage |
|---|---|---|---|
| A | 5767 | 38 | 0.658921% |
| B | 5767 | 37 | 0.641581% |
| C | 5767 | 17 | 0.294781% |
| D | 5767 | 85 | 1.473903% |
Noise dominated data is calculated using 1-second bins in cleaned event files. If a bin has >2000 counts, and if more than 50% of those come from <1% of pixels, then it is considered to be noise-dominated and hence unusable.
| Quadrant | # 1 sec bins | Bins with >0 counts | Bins with >2000 counts | High rate bins dominated by noise | Noise dominated (total time) | Noise dominated (detector-on time) | Marked lightcurve |
|---|---|---|---|---|---|---|---|
| A | 6912 | 5768 | 0 | 0 | 0.00% | 0.00% |  |
| B | 6912 | 5768 | 3 | 3 | 0.04% | 0.05% | 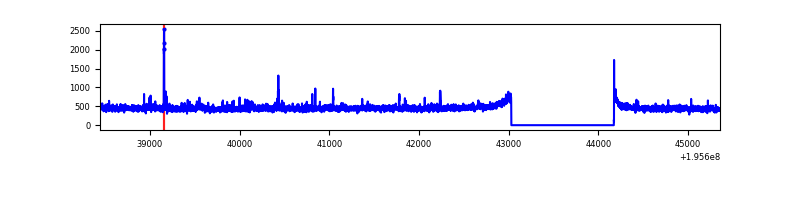 |
| C | 6912 | 5768 | 0 | 0 | 0.00% | 0.00% | 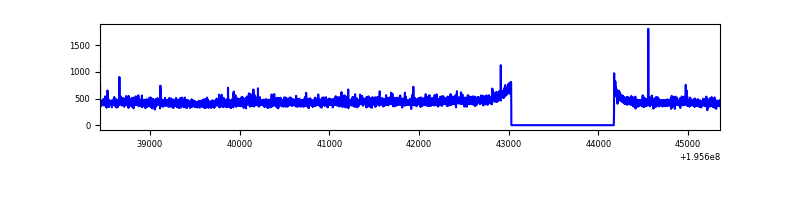 |
| D | 6912 | 5768 | 67 | 67 | 0.97% | 1.16% | 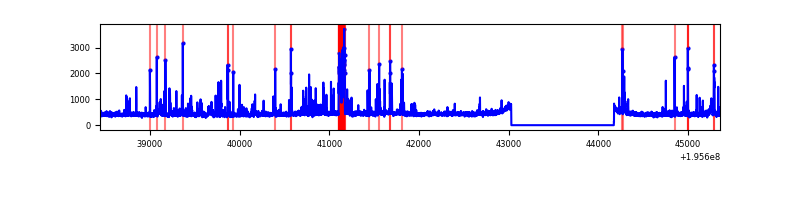 |
Top three noisy pixels from each quadrant. If the there are fewer than three noisy pixels in the level2.evt file, extra rows are filled as -1
| Pixel properties | Quadrant properties | ||||||
|---|---|---|---|---|---|---|---|
| Quadrant | DetID | PixID | Counts | Sigma | Mean | Median | Sigma |
| A | 12 | 194 | 7396 | 49.43 | 660 | 644 | 136.6 |
| A | 0 | 226 | 7389 | 49.37 | 660 | 644 | 136.6 |
| A | 0 | 5 | 2088 | 10.57 | 660 | 644 | 136.6 |
| B | 4 | 200 | 25877 | 196.09 | 664 | 647 | 128.7 |
| B | 5 | 6 | 24265 | 183.56 | 664 | 647 | 128.7 |
| B | 15 | 85 | 14521 | 107.83 | 664 | 647 | 128.7 |
| C | 7 | 255 | 20639 | 136.03 | 634 | 634 | 147.1 |
| C | 10 | 65 | 8335 | 52.36 | 634 | 634 | 147.1 |
| C | 13 | 61 | 5713 | 34.53 | 634 | 634 | 147.1 |
| D | 13 | 223 | 268398 | 1804.53 | 630 | 613 | 148.4 |
| D | 7 | 67 | 120128 | 805.38 | 630 | 613 | 148.4 |
| D | 2 | 184 | 72939 | 487.38 | 630 | 613 | 148.4 |
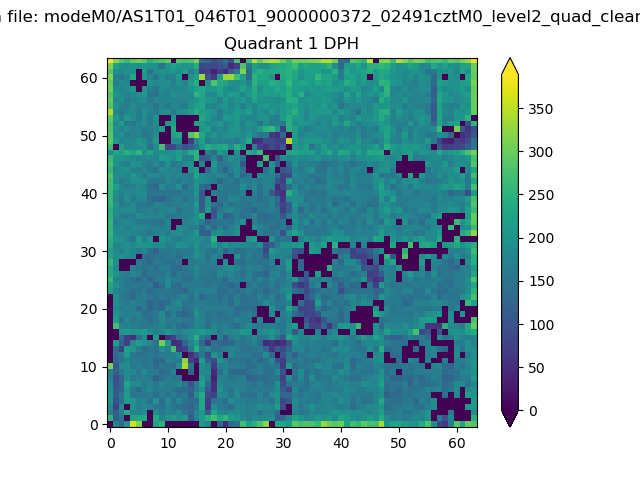
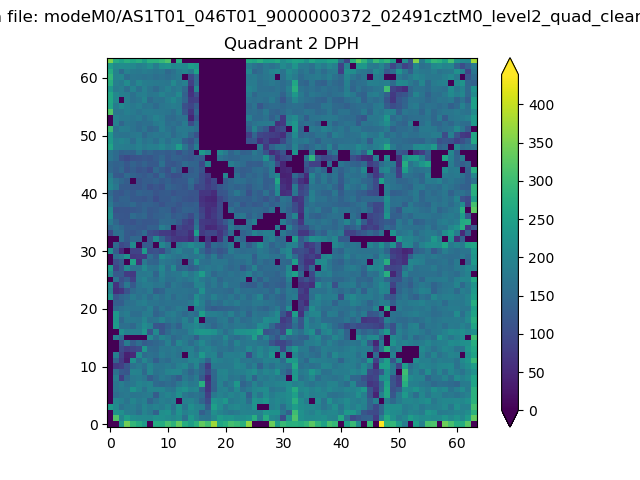
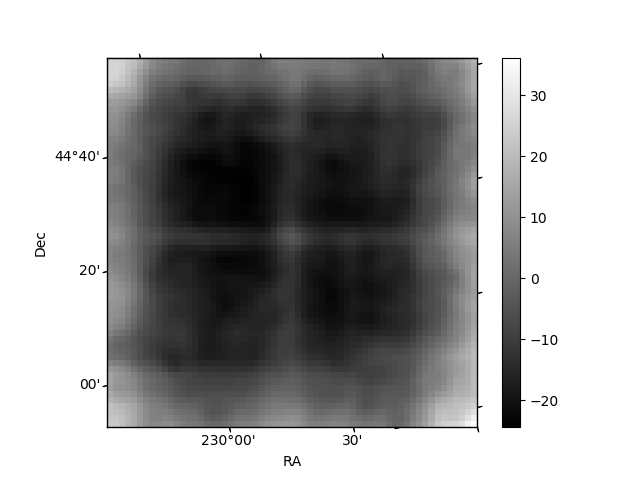
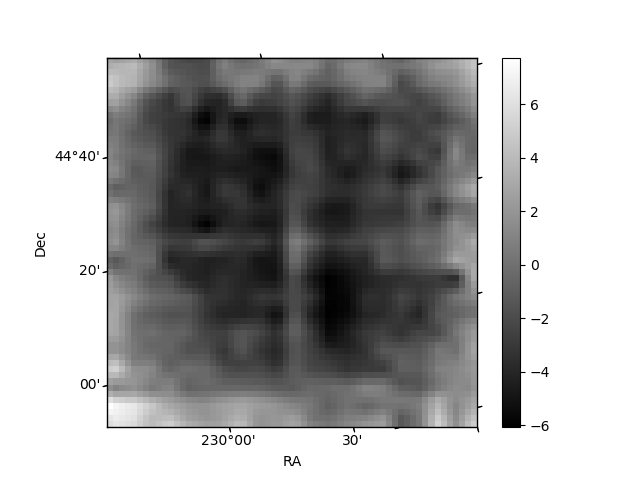
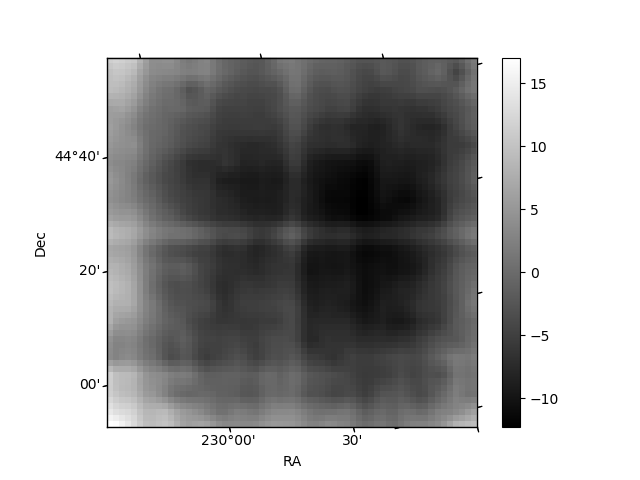
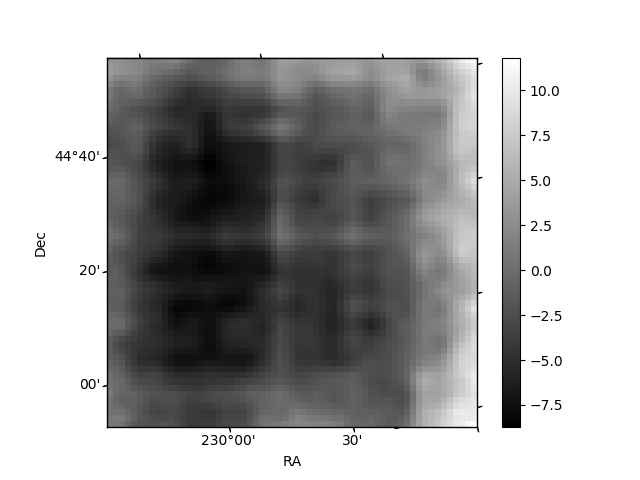
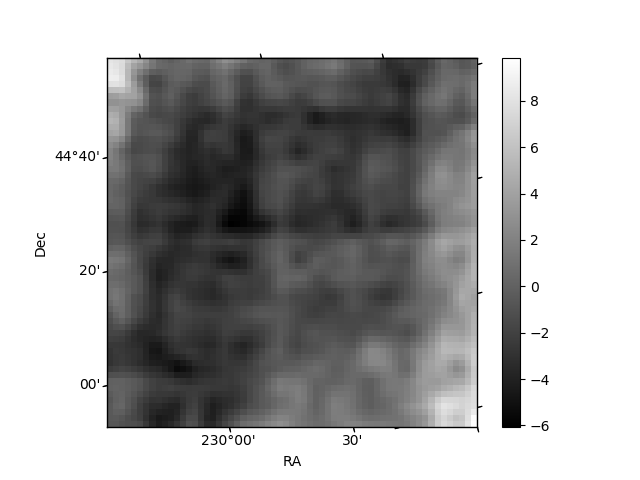
Histogram calculated using DETX and DETY for each event in the final _common_clean file
| Quadrant A | 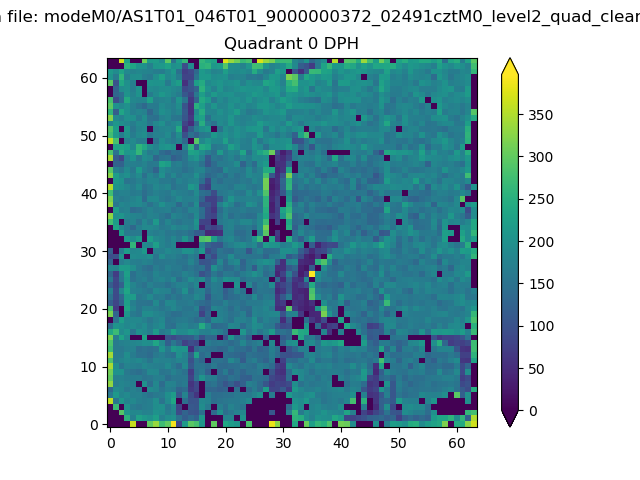 |
 |
Quadrant B |
|---|---|---|---|
| Quadrant D | 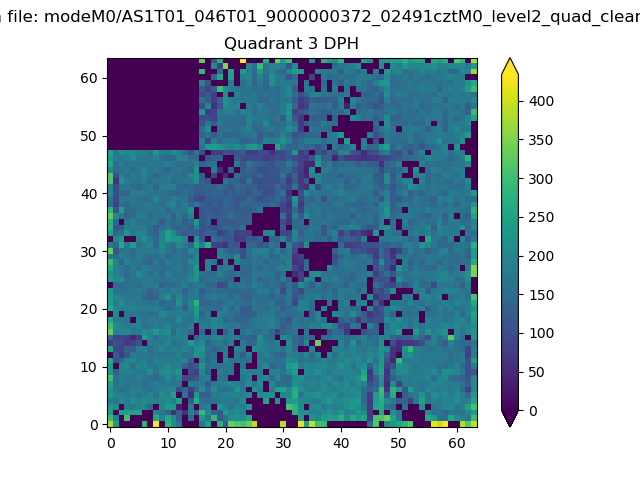 |
 |
Quadrant C |
| Plot type | Count rate plots | Images |
|---|---|---|
| Comparison with Poisson distribution Blue bars denote a histogram of data divided into 1 sec bins. Red curve is a Poisson curve with rate = median count rate of data. |
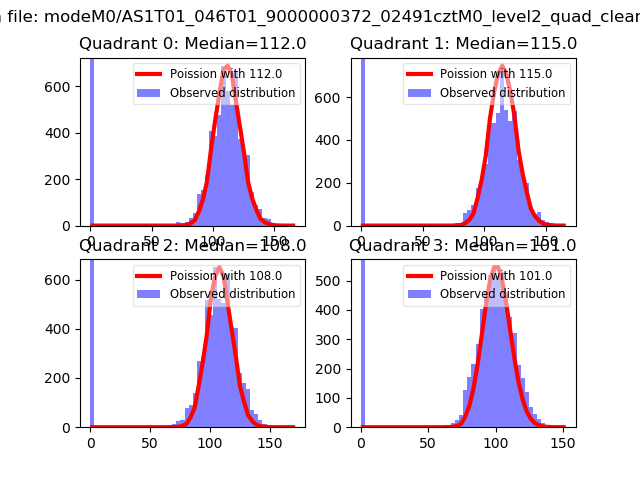 |
 |
| Quadrant-wise count rates Data is divided into 100 sec bins |
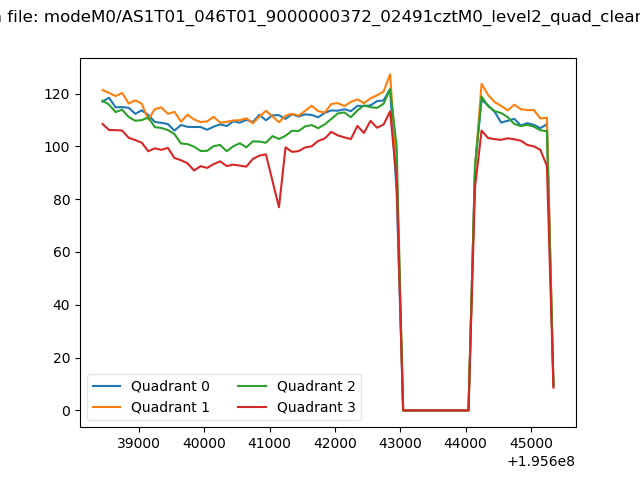 |
|
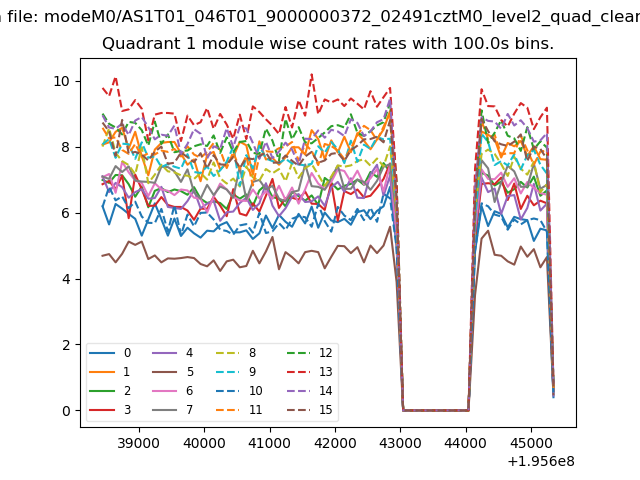
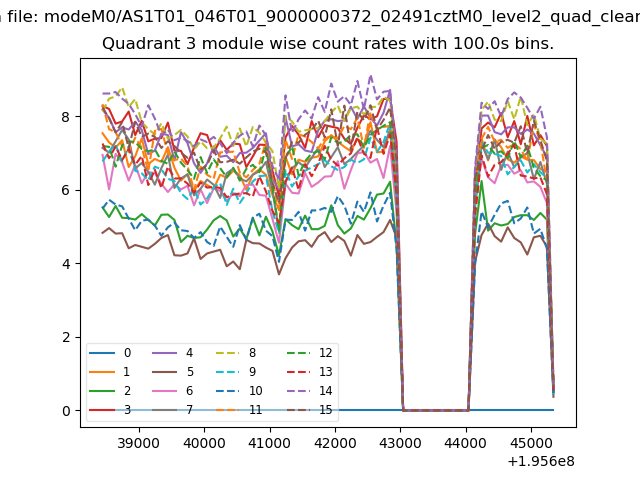
| Module-wise count rates for Quadrant A Data is divided into 100 sec bins |
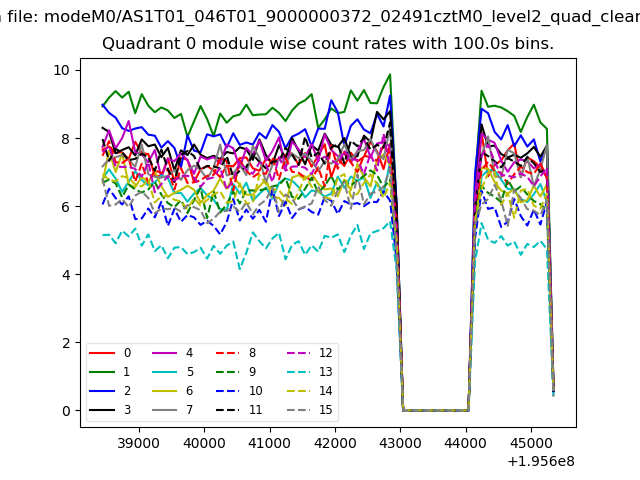 |
 |
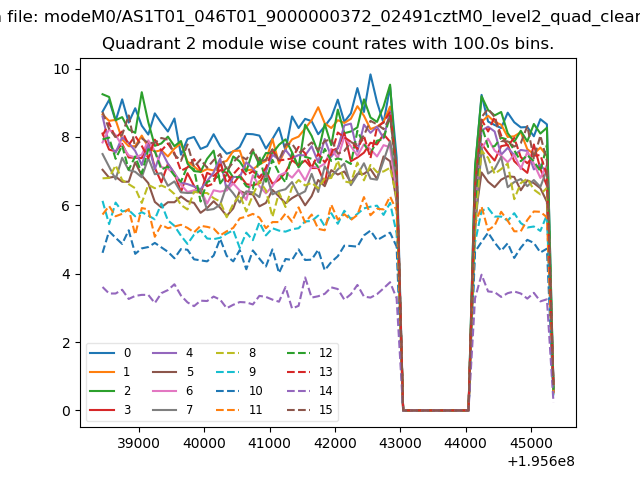
| Module-wise count rates for Quadrant B Data is divided into 100 sec bins |
 |
 |
| Module-wise count rates for Quadrant C Data is divided into 100 sec bins |
 |
 |
| Module-wise count rates for Quadrant D Data is divided into 100 sec bins |
 |
 |
| Parameter | Plot |
|---|---|
| CZT HV Monitor | 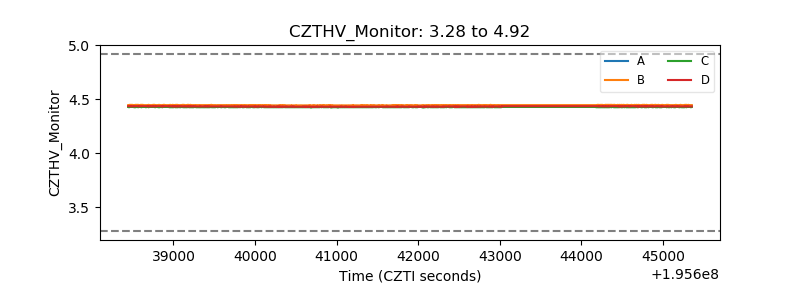 |
| D_VDD |  |
| Temperature 1 | 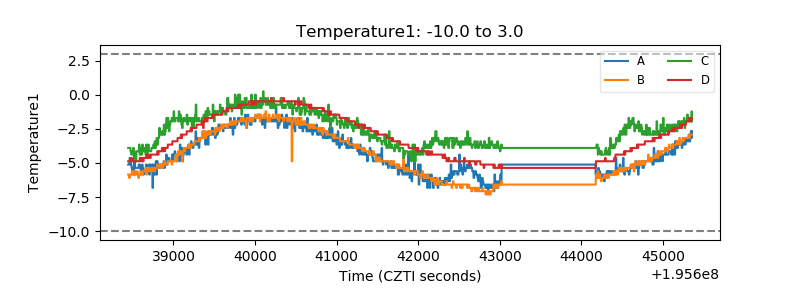 |
| Veto HV Monitor | 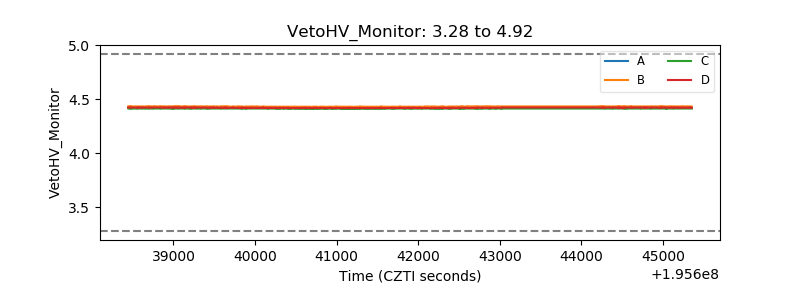 |
| Veto LLD | 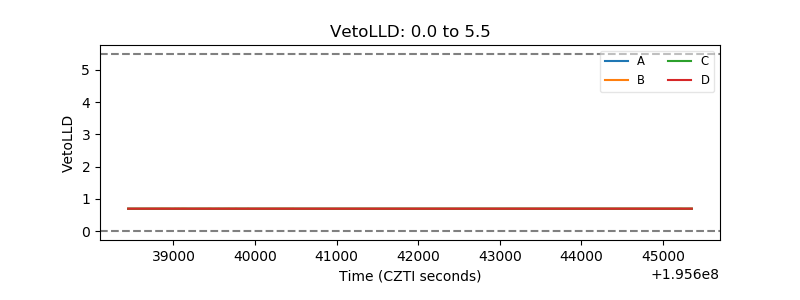 |
| Alpha Counter | 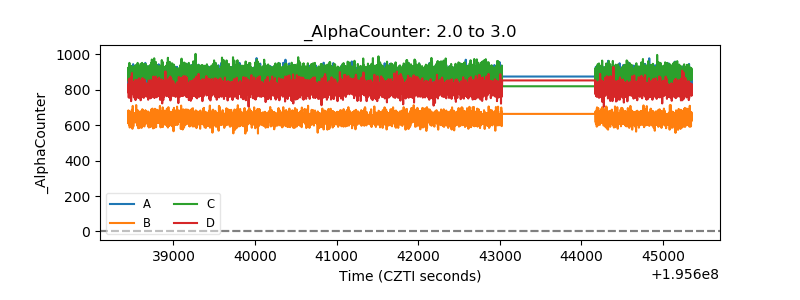 |
| _CPM_Rate | 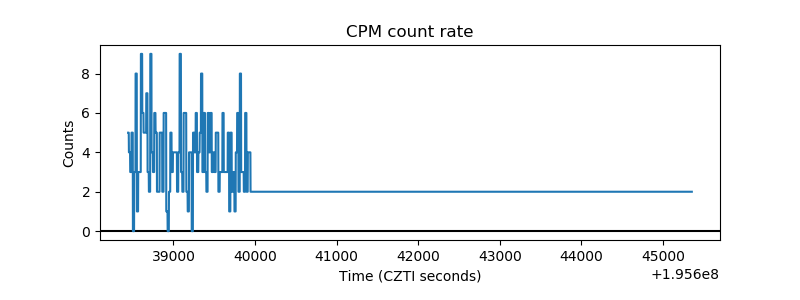 |
| CZT Counter | 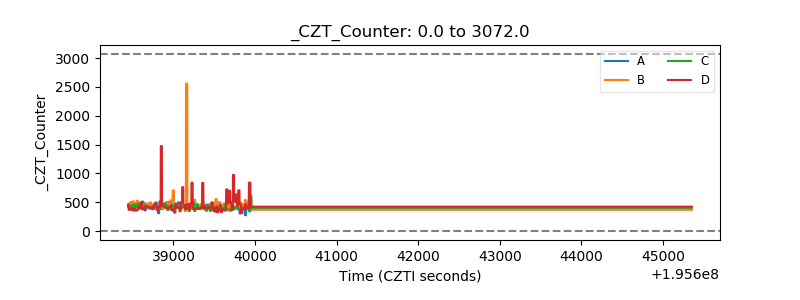 |
| +2.5 Volts monitor |  |
| +5 Volts monitor | 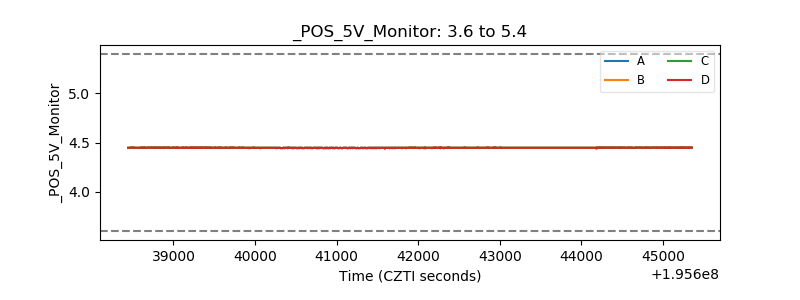 |
| _ROLL_ROT | 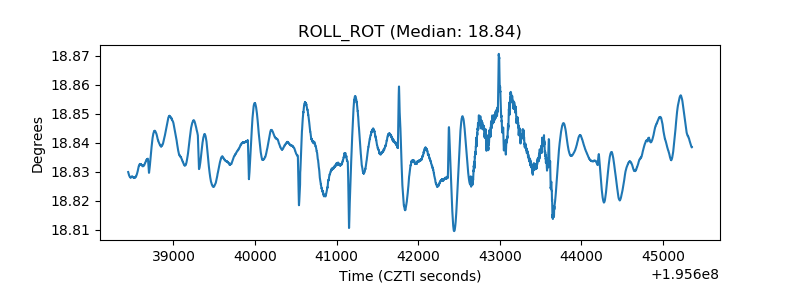 |
| _Roll_DEC | 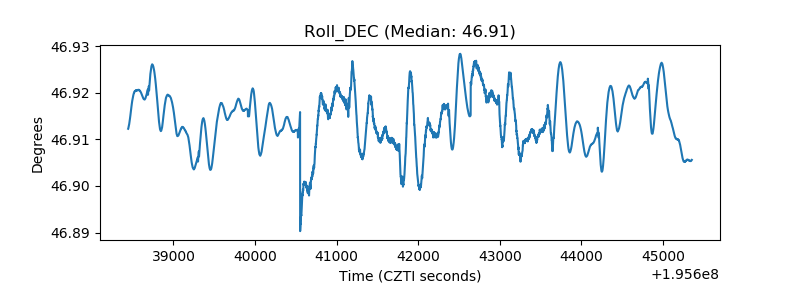 |
| _Roll_RA | 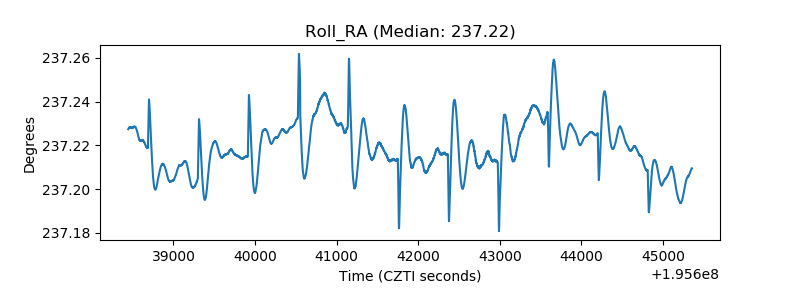 |
| Veto Counter | 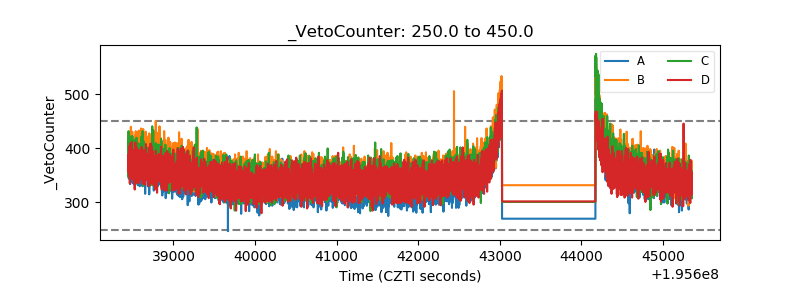 |