| Param | Original file | Final file |
|---|---|---|
| Filename | modeM0/AS1T01_046T01_9000000372_02493cztM0_level2.fits | modeM0/AS1T01_046T01_9000000372_02493cztM0_level2_quad_clean.evt |
| Size (bytes) | 386,438,400 | 120,386,880 |
| Size | 368.5 MB | 114.8 MB |
| Events in quadrant A | 3,367,852 | 795,850 |
| Events in quadrant B | 3,429,361 | 822,524 |
| Events in quadrant C | 3,438,772 | 776,253 |
| Events in quadrant D | 3,477,098 | 721,524 |
| Mode M0 | |||
|---|---|---|---|
| Quadrant | BADHDUFLAG | Total packets | Discarded packets |
| A | 0 | 15624 | 4 |
| B | 0 | 15670 | 3 |
| C | 0 | 15788 | 3 |
| D | 0 | 16075 | 3 |
| Mode M9 | |||
|---|---|---|---|
| Quadrant | BADHDUFLAG | Total packets | Discarded packets |
| A | 0 | 3 | 0 |
| B | 0 | 3 | 0 |
| C | 0 | 3 | 0 |
| D | 0 | 4 | 0 |
| Mode SS | |||
|---|---|---|---|
| Quadrant | BADHDUFLAG | Total packets | Discarded packets |
| A | 0 | 156 | 0 |
| B | 0 | 156 | 0 |
| C | 0 | 156 | 0 |
| D | 0 | 156 | 0 |
| Quadrant | Total seconds | Saturated seconds | Saturation percentage |
|---|---|---|---|
| A | 7591 | 153 | 2.015545% |
| B | 7591 | 142 | 1.870636% |
| C | 7591 | 130 | 1.712554% |
| D | 7591 | 113 | 1.488605% |
Noise dominated data is calculated using 1-second bins in cleaned event files. If a bin has >2000 counts, and if more than 50% of those come from <1% of pixels, then it is considered to be noise-dominated and hence unusable.
| Quadrant | # 1 sec bins | Bins with >0 counts | Bins with >2000 counts | High rate bins dominated by noise | Noise dominated (total time) | Noise dominated (detector-on time) | Marked lightcurve |
|---|---|---|---|---|---|---|---|
| A | 7966 | 7593 | 0 | 0 | 0.00% | 0.00% | 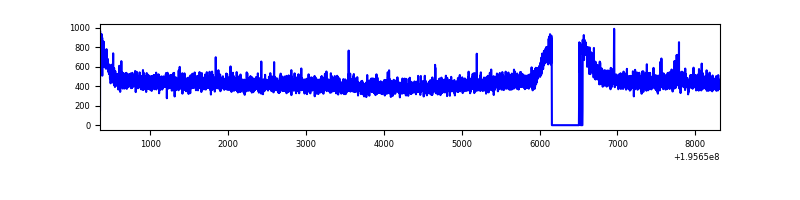 |
| B | 7966 | 7593 | 0 | 0 | 0.00% | 0.00% | 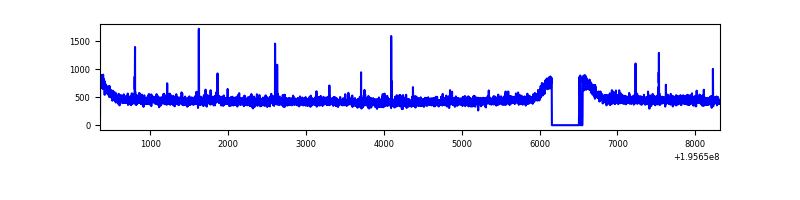 |
| C | 7966 | 7593 | 13 | 13 | 0.16% | 0.17% | 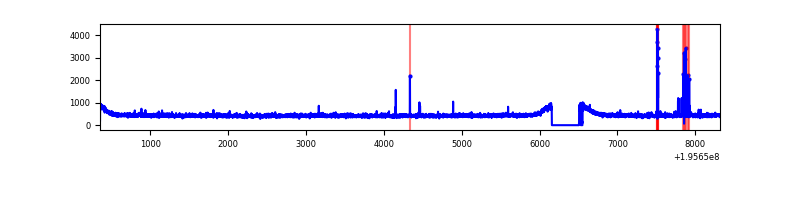 |
| D | 7966 | 7593 | 11 | 11 | 0.14% | 0.14% | 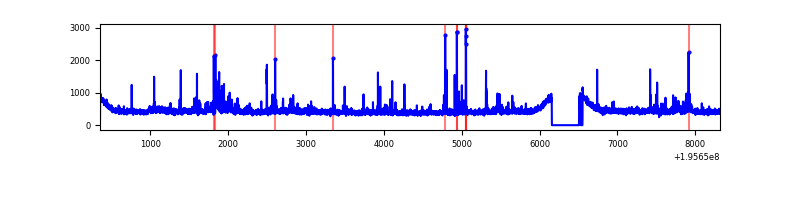 |
Top three noisy pixels from each quadrant. If the there are fewer than three noisy pixels in the level2.evt file, extra rows are filled as -1
| Pixel properties | Quadrant properties | ||||||
|---|---|---|---|---|---|---|---|
| Quadrant | DetID | PixID | Counts | Sigma | Mean | Median | Sigma |
| A | 12 | 194 | 9726 | 49.25 | 872 | 851 | 180.2 |
| A | 0 | 226 | 9503 | 48.01 | 872 | 851 | 180.2 |
| A | 8 | 15 | 8528 | 42.6 | 872 | 851 | 180.2 |
| B | 15 | 85 | 15970 | 88.2 | 882 | 859 | 171.3 |
| B | 12 | 111 | 12911 | 70.35 | 882 | 859 | 171.3 |
| B | 11 | 111 | 10777 | 57.89 | 882 | 859 | 171.3 |
| C | 9 | 144 | 70515 | 355.05 | 840 | 837 | 196.2 |
| C | 8 | 112 | 30959 | 153.49 | 840 | 837 | 196.2 |
| C | 10 | 65 | 23899 | 117.52 | 840 | 837 | 196.2 |
| D | 13 | 238 | 92784 | 463.06 | 838 | 814 | 198.6 |
| D | 2 | 184 | 50112 | 248.21 | 838 | 814 | 198.6 |
| D | 2 | 14 | 47301 | 234.06 | 838 | 814 | 198.6 |
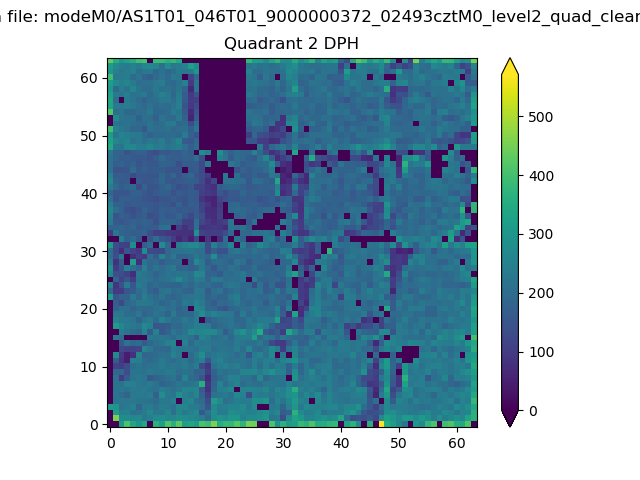
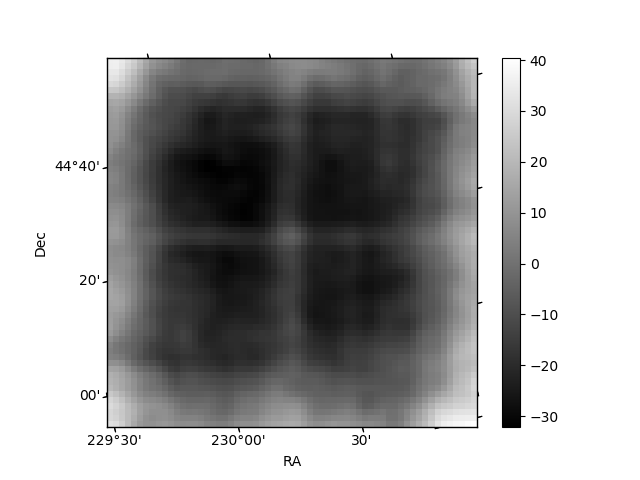
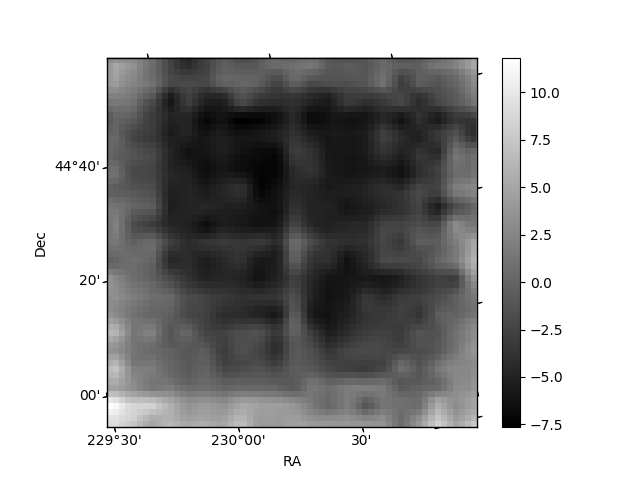
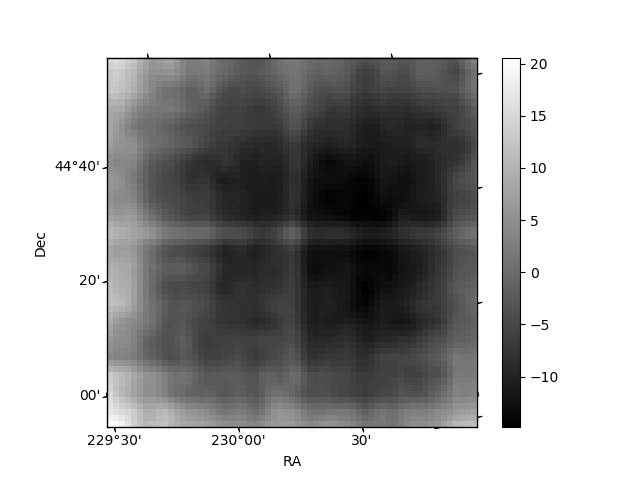
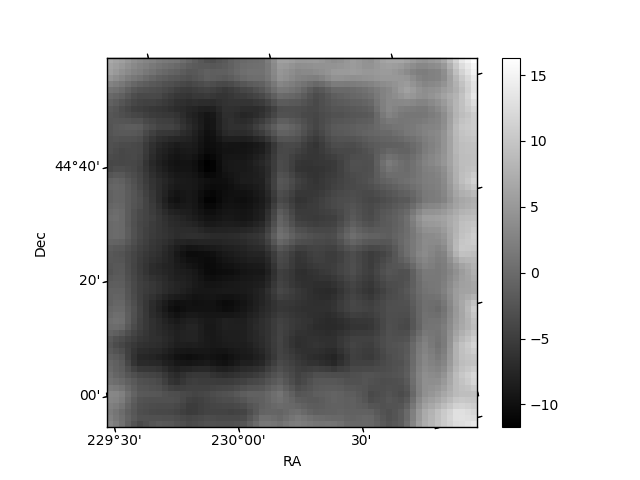
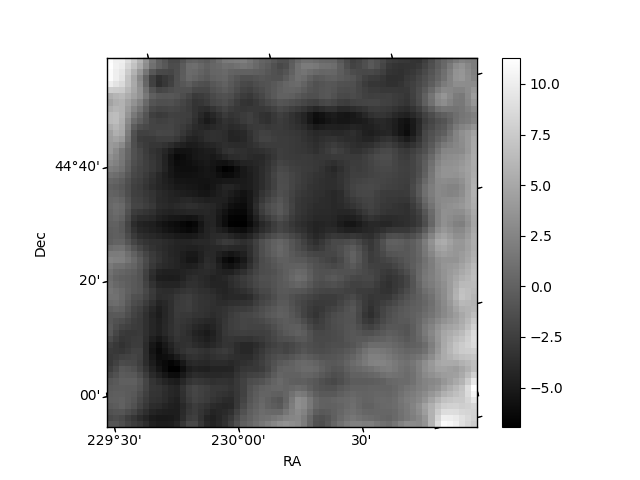
Histogram calculated using DETX and DETY for each event in the final _common_clean file
| Quadrant A | 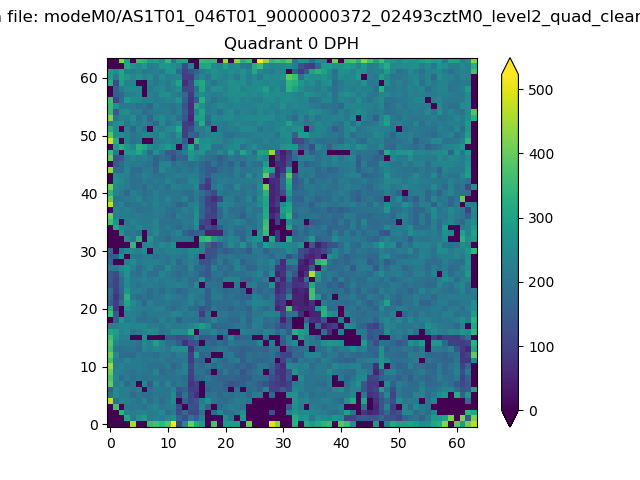 |
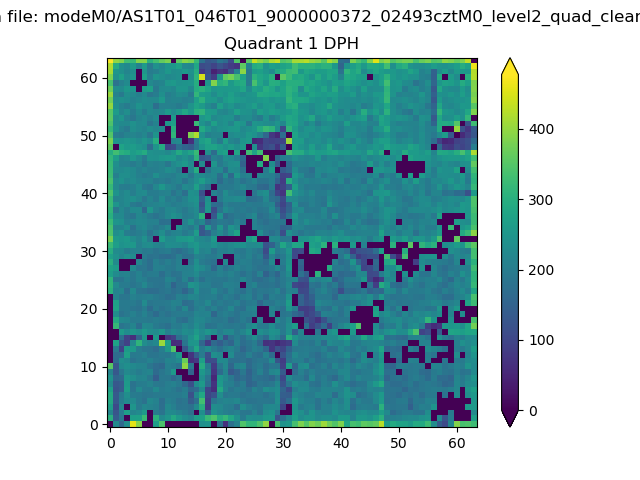 |
Quadrant B |
|---|---|---|---|
| Quadrant D | 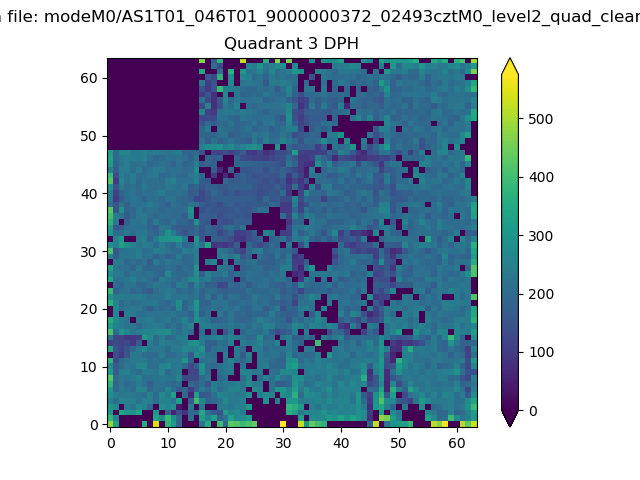 |
 |
Quadrant C |
| Plot type | Count rate plots | Images |
|---|---|---|
| Comparison with Poisson distribution Blue bars denote a histogram of data divided into 1 sec bins. Red curve is a Poisson curve with rate = median count rate of data. |
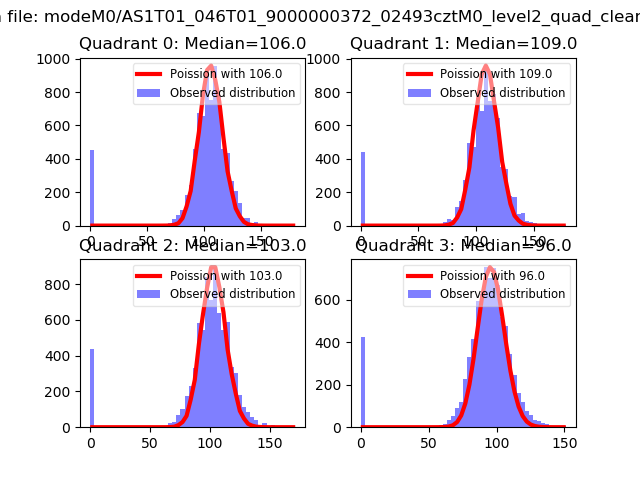 |
 |
| Quadrant-wise count rates Data is divided into 100 sec bins |
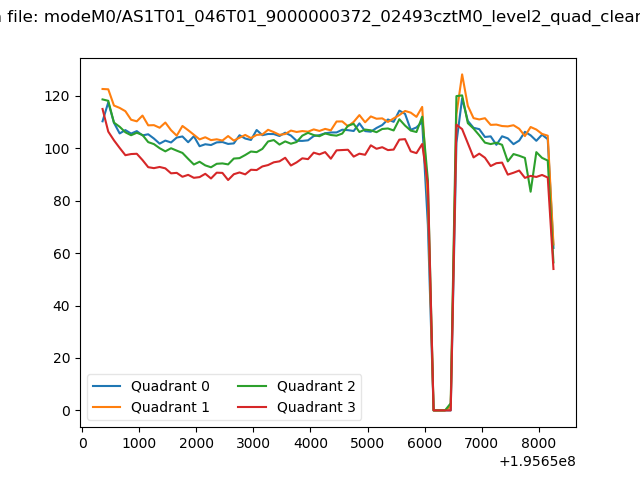 |
|
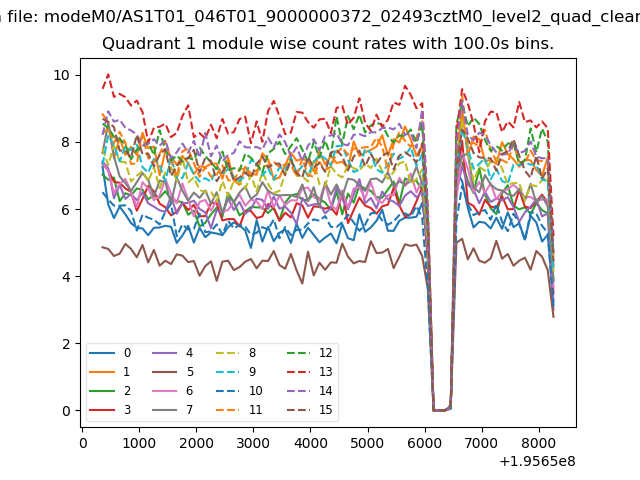
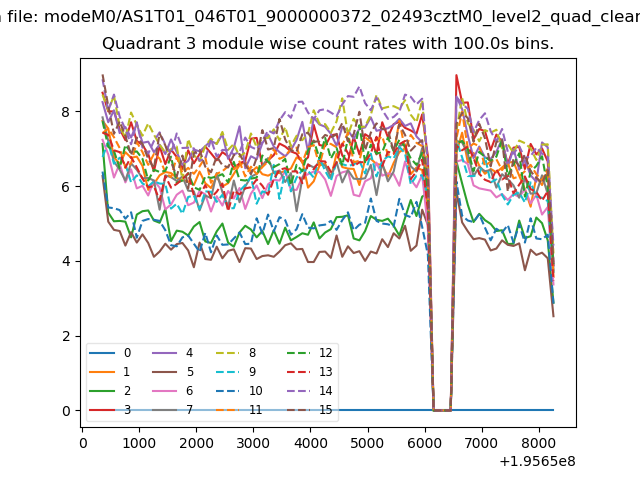
| Module-wise count rates for Quadrant A Data is divided into 100 sec bins |
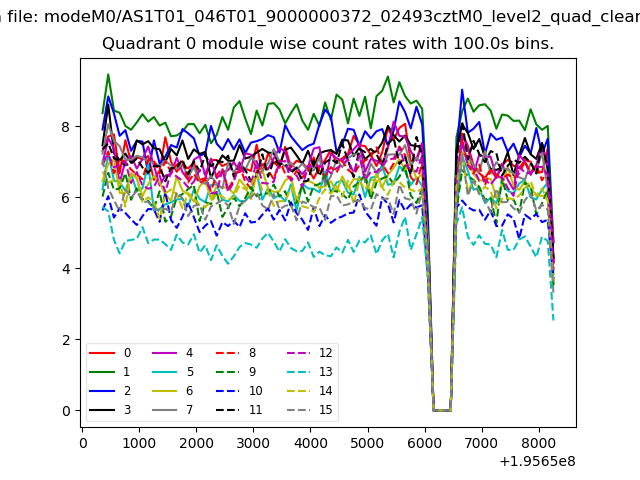 |
 |
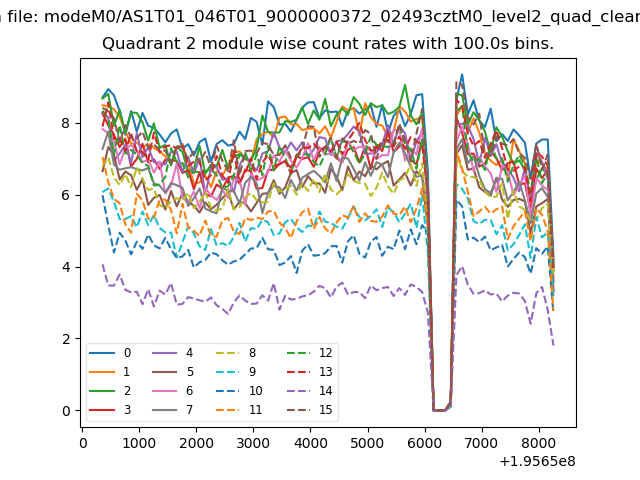
| Module-wise count rates for Quadrant B Data is divided into 100 sec bins |
 |
 |
| Module-wise count rates for Quadrant C Data is divided into 100 sec bins |
 |
 |
| Module-wise count rates for Quadrant D Data is divided into 100 sec bins |
 |
 |
| Parameter | Plot |
|---|---|
| CZT HV Monitor | 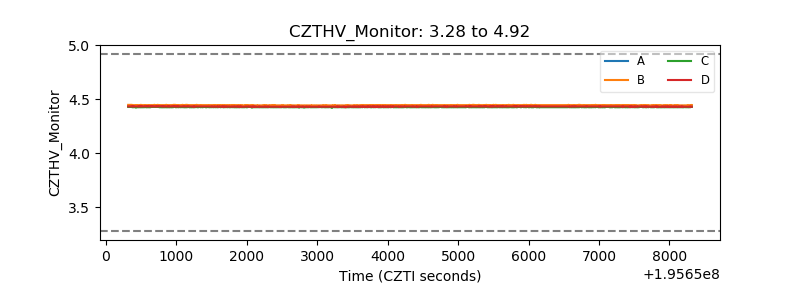 |
| D_VDD | 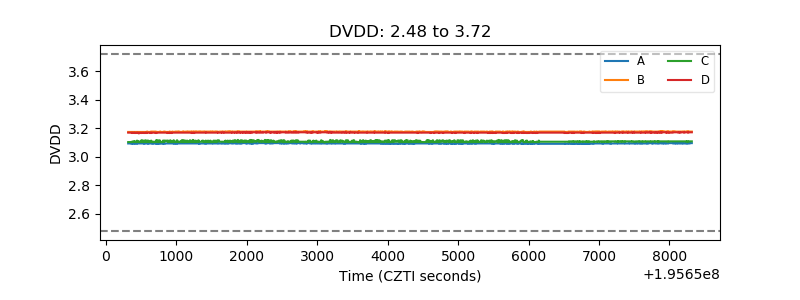 |
| Temperature 1 | 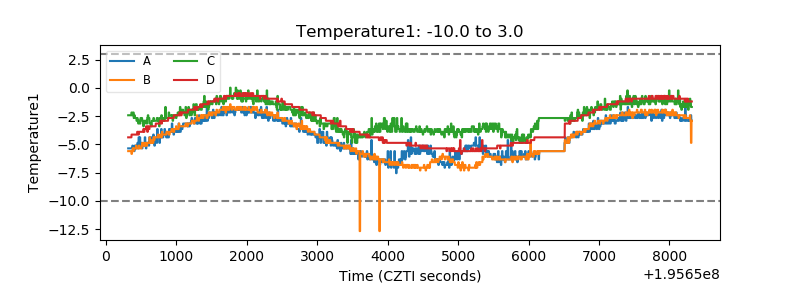 |
| Veto HV Monitor | 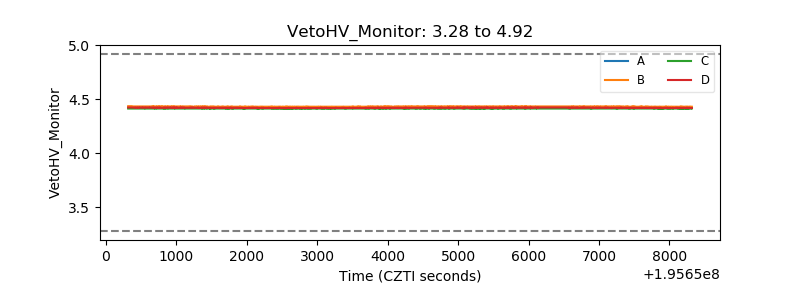 |
| Veto LLD | 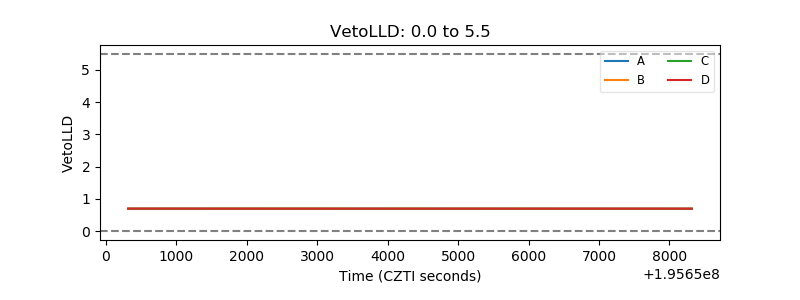 |
| Alpha Counter | 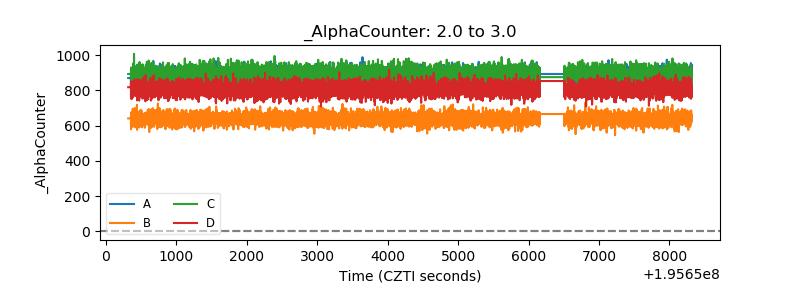 |
| _CPM_Rate | 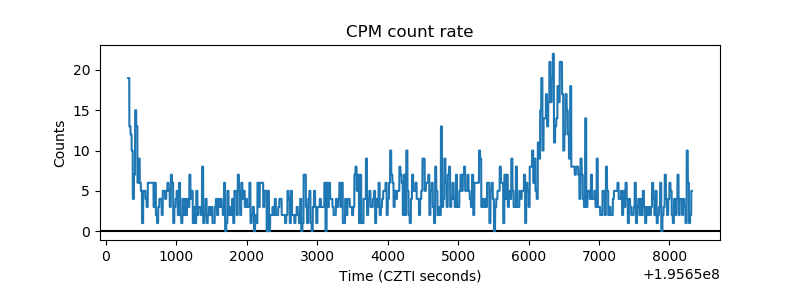 |
| CZT Counter | 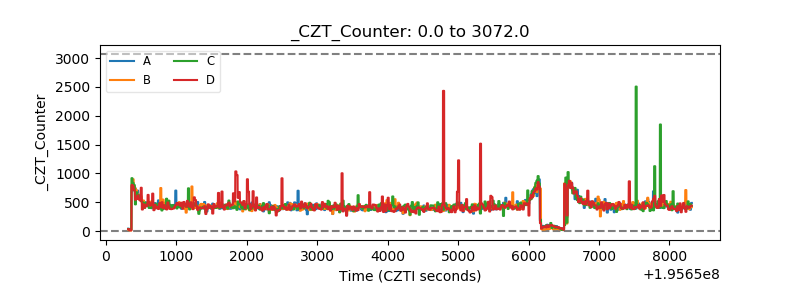 |
| +2.5 Volts monitor | 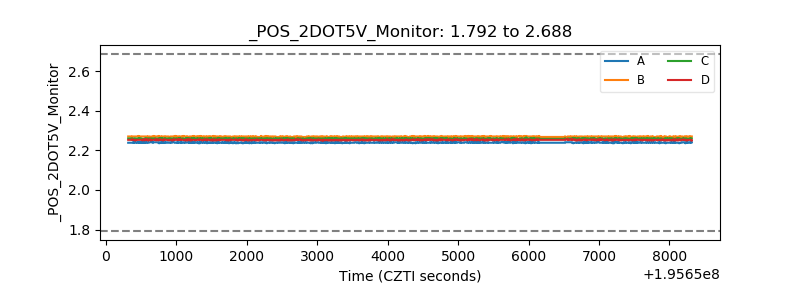 |
| +5 Volts monitor | 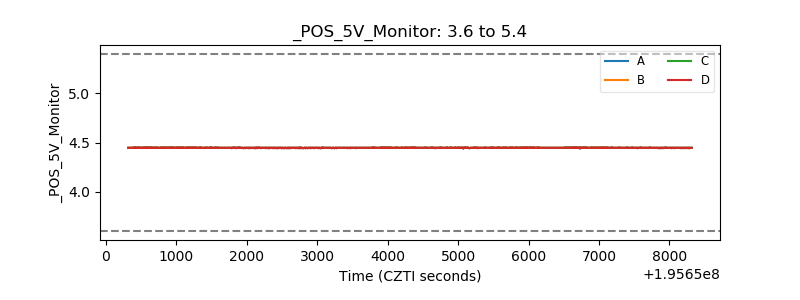 |
| _ROLL_ROT | 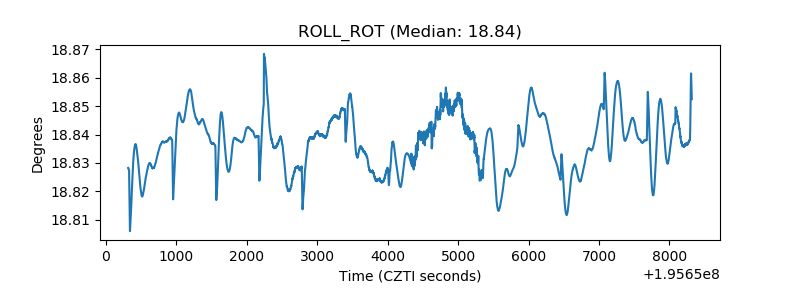 |
| _Roll_DEC | 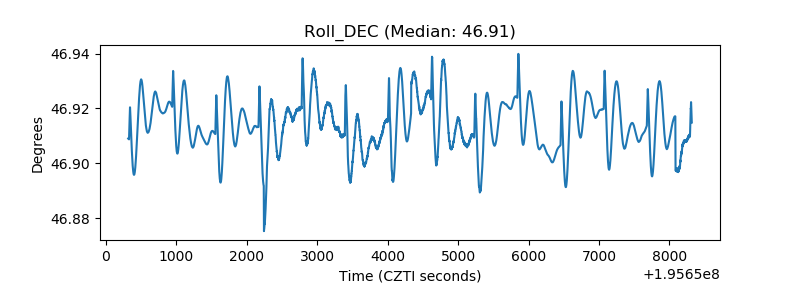 |
| _Roll_RA |  |
| Veto Counter | 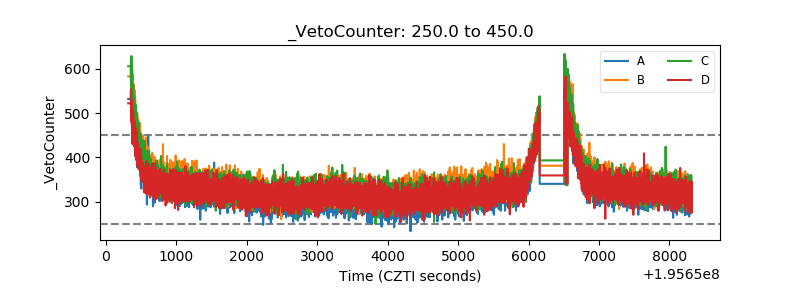 |