| Param | Original file | Final file |
|---|---|---|
| Filename | modeM0/AS1T01_046T01_9000000372_02494cztM0_level2.fits | modeM0/AS1T01_046T01_9000000372_02494cztM0_level2_quad_clean.evt |
| Size (bytes) | 472,057,920 | 118,183,680 |
| Size | 450.2 MB | 112.7 MB |
| Events in quadrant A | 3,510,054 | 798,526 |
| Events in quadrant B | 3,577,989 | 823,366 |
| Events in quadrant C | 6,112,034 | 689,492 |
| Events in quadrant D | 3,671,893 | 728,935 |
| Mode M0 | |||
|---|---|---|---|
| Quadrant | BADHDUFLAG | Total packets | Discarded packets |
| A | 0 | 16138 | 4 |
| B | 0 | 16224 | 3 |
| C | 0 | 23745 | 3 |
| D | 0 | 16777 | 3 |
| Mode M9 | |||
|---|---|---|---|
| Quadrant | BADHDUFLAG | Total packets | Discarded packets |
| A | 0 | 1 | 0 |
| B | 0 | 1 | 0 |
| C | 0 | 1 | 0 |
| D | 0 | 1 | 0 |
| Mode SS | |||
|---|---|---|---|
| Quadrant | BADHDUFLAG | Total packets | Discarded packets |
| A | 0 | 156 | 0 |
| B | 0 | 156 | 0 |
| C | 0 | 156 | 0 |
| D | 0 | 156 | 0 |
| Quadrant | Total seconds | Saturated seconds | Saturation percentage |
|---|---|---|---|
| A | 7732 | 274 | 3.543714% |
| B | 7732 | 275 | 3.556648% |
| C | 7732 | 1154 | 14.924987% |
| D | 7733 | 203 | 2.625113% |
Noise dominated data is calculated using 1-second bins in cleaned event files. If a bin has >2000 counts, and if more than 50% of those come from <1% of pixels, then it is considered to be noise-dominated and hence unusable.
| Quadrant | # 1 sec bins | Bins with >0 counts | Bins with >2000 counts | High rate bins dominated by noise | Noise dominated (total time) | Noise dominated (detector-on time) | Marked lightcurve |
|---|---|---|---|---|---|---|---|
| A | 7787 | 7734 | 0 | 0 | 0.00% | 0.00% | 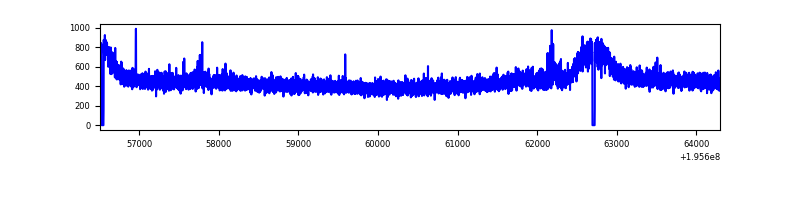 |
| B | 7787 | 7734 | 1 | 1 | 0.01% | 0.01% | 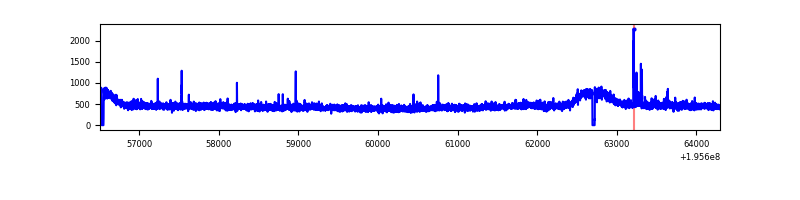 |
| C | 7787 | 7734 | 866 | 866 | 11.12% | 11.20% | 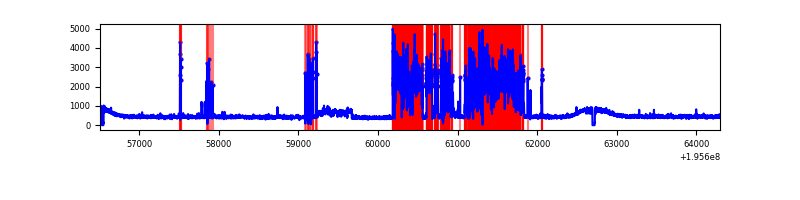 |
| D | 7788 | 7735 | 10 | 10 | 0.13% | 0.13% | 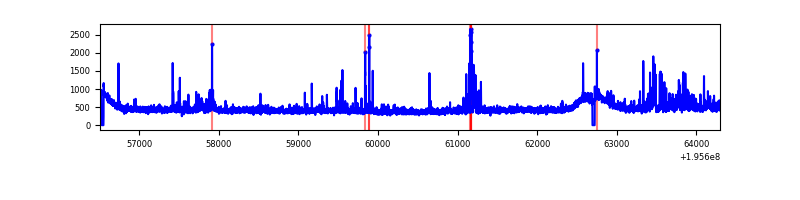 |
Top three noisy pixels from each quadrant. If the there are fewer than three noisy pixels in the level2.evt file, extra rows are filled as -1
| Pixel properties | Quadrant properties | ||||||
|---|---|---|---|---|---|---|---|
| Quadrant | DetID | PixID | Counts | Sigma | Mean | Median | Sigma |
| A | 8 | 15 | 35973 | 189.5 | 902 | 881 | 185.2 |
| A | 12 | 194 | 10223 | 50.45 | 902 | 881 | 185.2 |
| A | 0 | 226 | 9779 | 48.05 | 902 | 881 | 185.2 |
| B | 5 | 172 | 29278 | 160.54 | 913 | 887 | 176.8 |
| B | 12 | 111 | 13145 | 69.31 | 913 | 887 | 176.8 |
| B | 10 | 244 | 12485 | 65.58 | 913 | 887 | 176.8 |
| C | 9 | 144 | 2846869 | 14790.18 | 823 | 822 | 192.4 |
| C | 8 | 112 | 9011 | 42.56 | 823 | 822 | 192.4 |
| C | 10 | 65 | 8925 | 42.11 | 823 | 822 | 192.4 |
| D | 2 | 184 | 90917 | 435.09 | 872 | 848 | 207.0 |
| D | 5 | 172 | 85980 | 411.24 | 872 | 848 | 207.0 |
| D | 9 | 41 | 69360 | 330.96 | 872 | 848 | 207.0 |
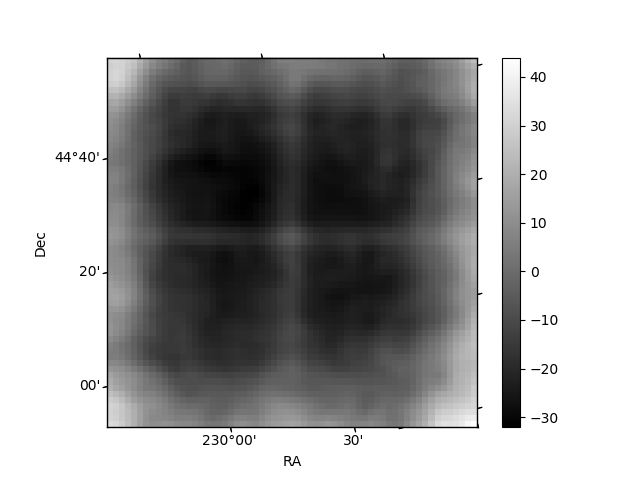
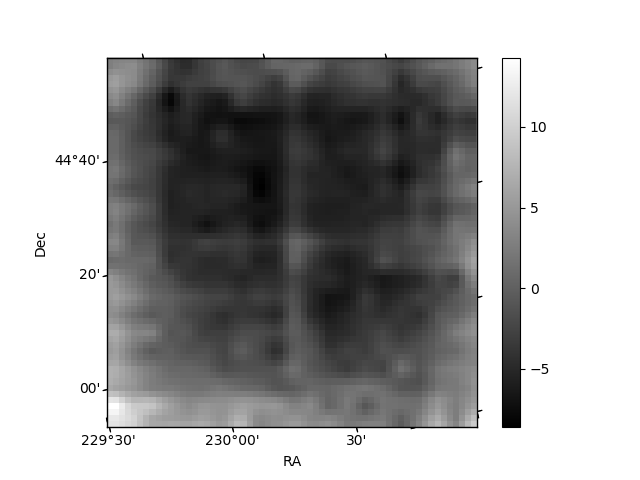
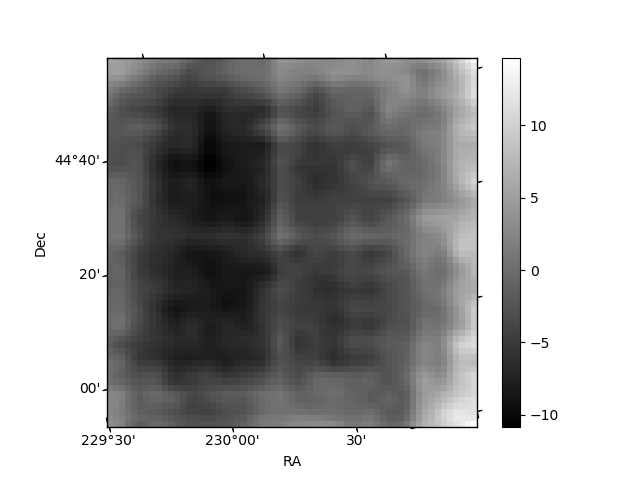
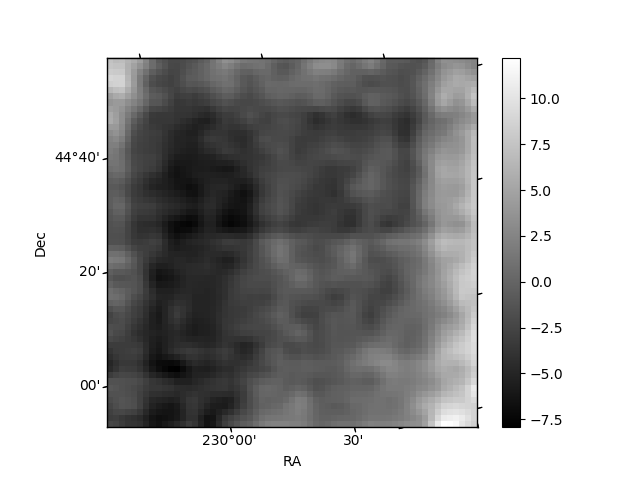
Histogram calculated using DETX and DETY for each event in the final _common_clean file
| Quadrant A | 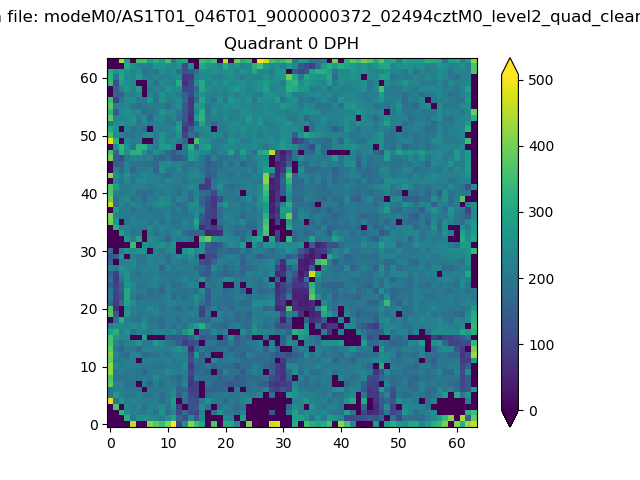 |
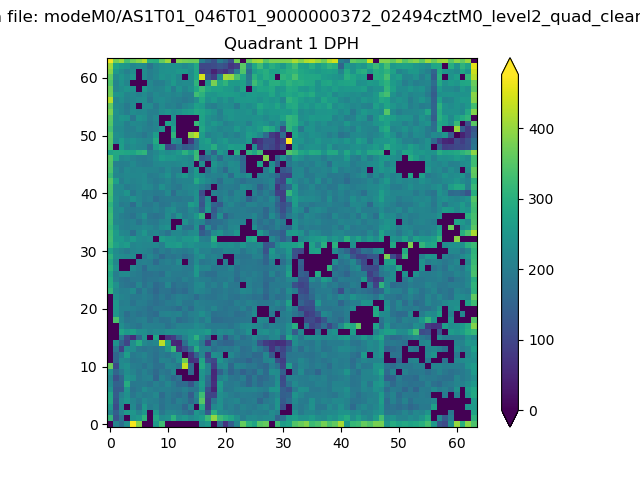 |
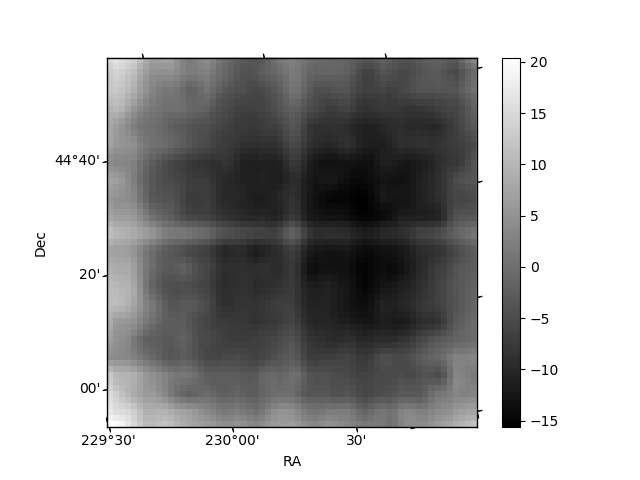
Quadrant B |
|---|---|---|---|
| Quadrant D | 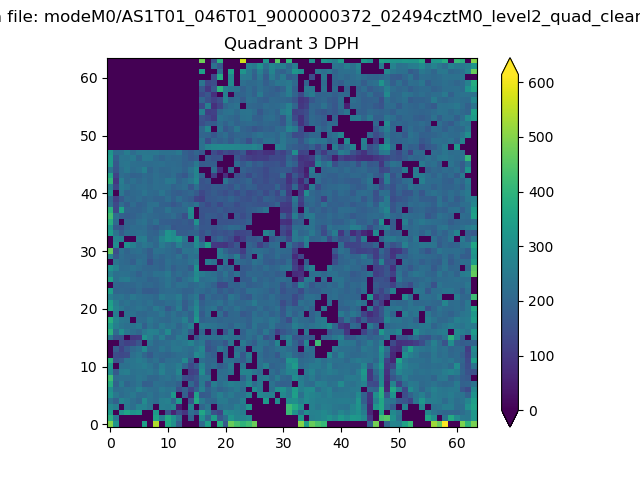 |
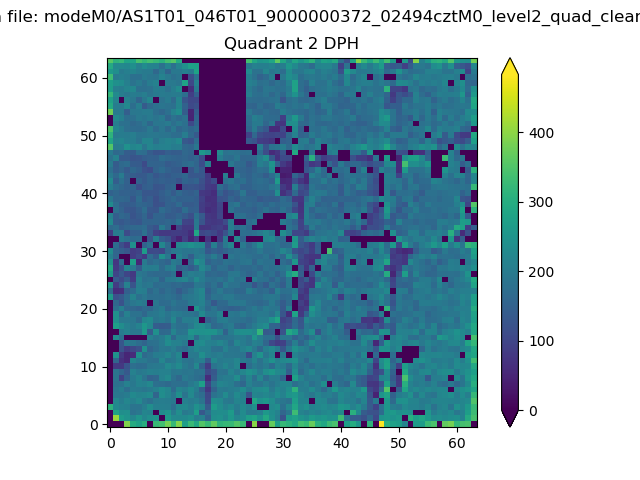 |
Quadrant C |
| Plot type | Count rate plots | Images |
|---|---|---|
| Comparison with Poisson distribution Blue bars denote a histogram of data divided into 1 sec bins. Red curve is a Poisson curve with rate = median count rate of data. |
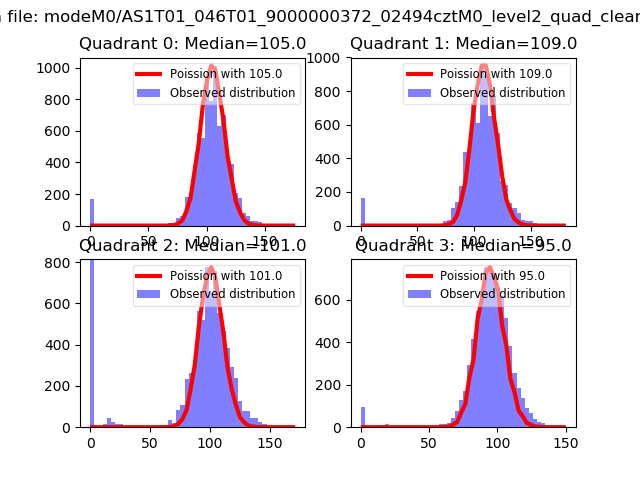 |
 |
| Quadrant-wise count rates Data is divided into 100 sec bins |
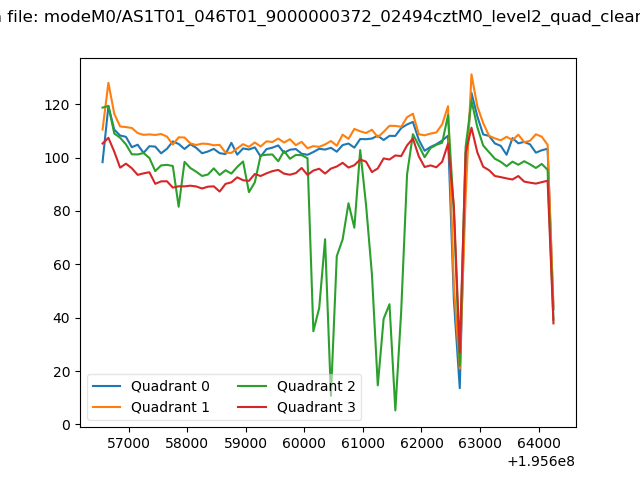 |
|
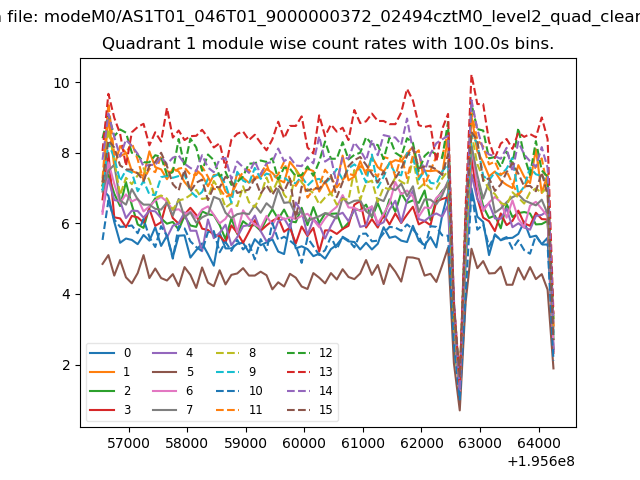
| Module-wise count rates for Quadrant A Data is divided into 100 sec bins |
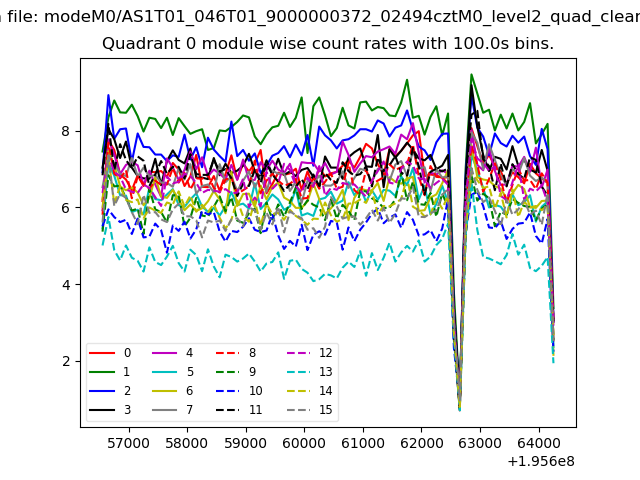 |
 |
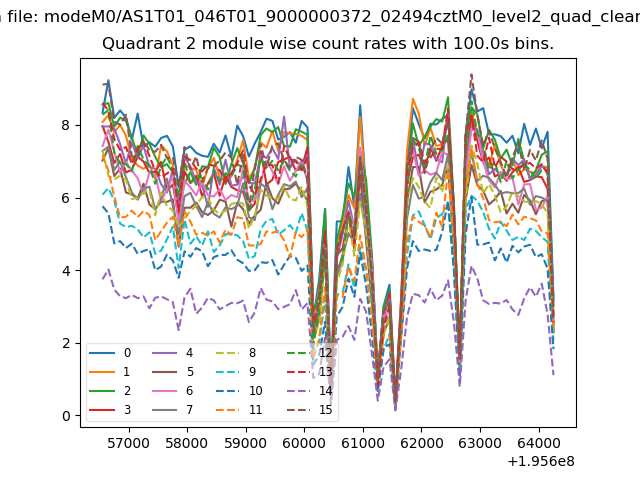
| Module-wise count rates for Quadrant B Data is divided into 100 sec bins |
 |
 |
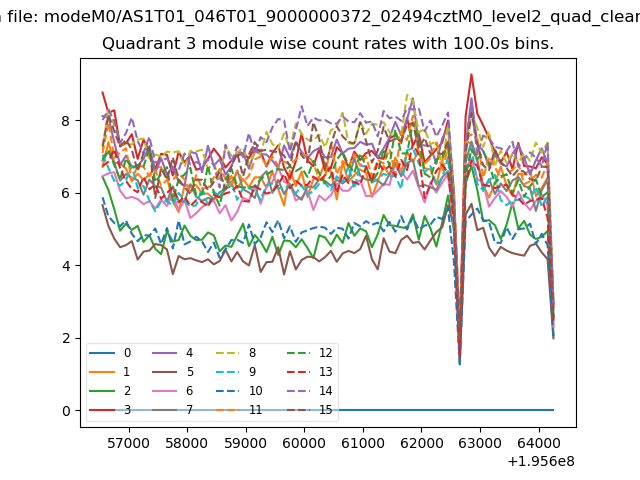
| Module-wise count rates for Quadrant C Data is divided into 100 sec bins |
 |
 |
| Module-wise count rates for Quadrant D Data is divided into 100 sec bins |
 |
 |
| Parameter | Plot |
|---|---|
| CZT HV Monitor | 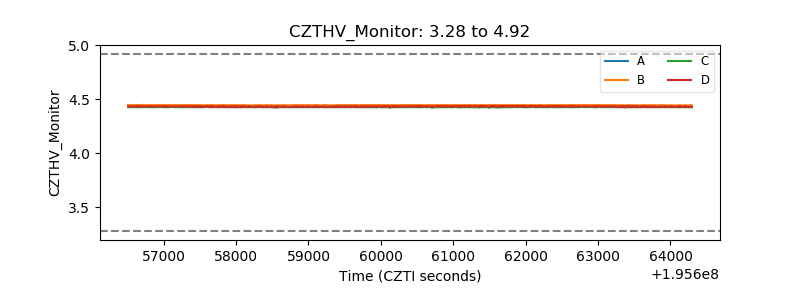 |
| D_VDD | 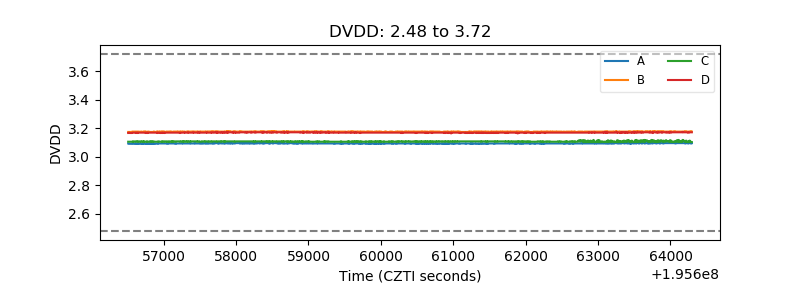 |
| Temperature 1 | 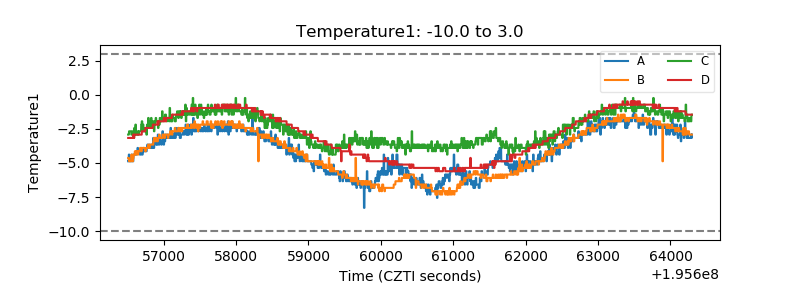 |
| Veto HV Monitor | 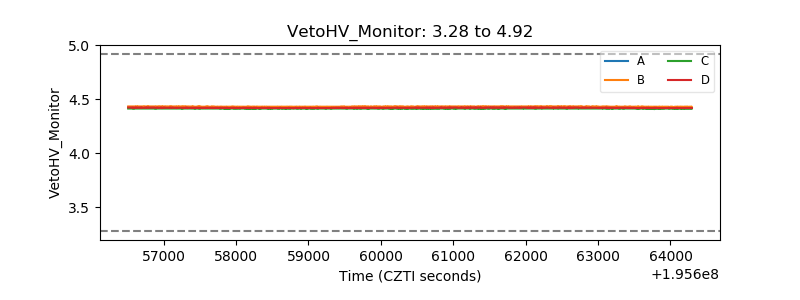 |
| Veto LLD |  |
| Alpha Counter | 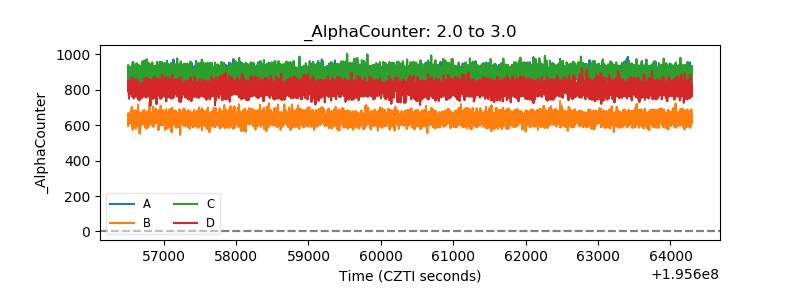 |
| _CPM_Rate | 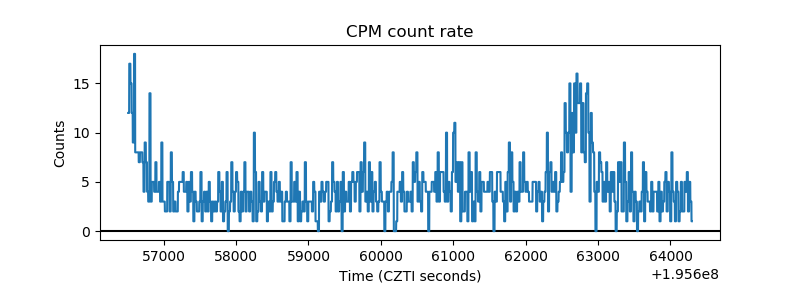 |
| CZT Counter | 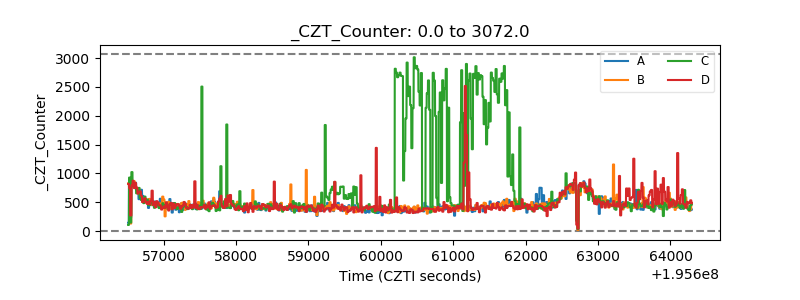 |
| +2.5 Volts monitor |  |
| +5 Volts monitor | 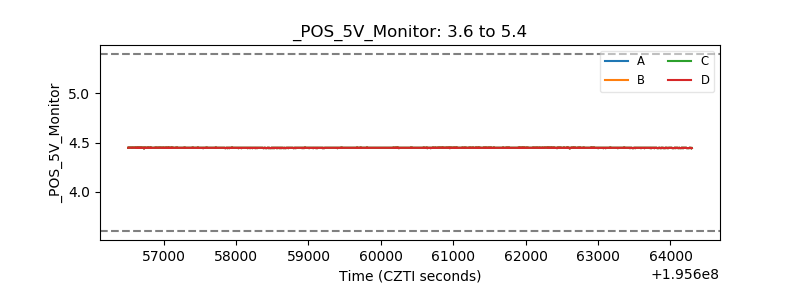 |
| _ROLL_ROT | 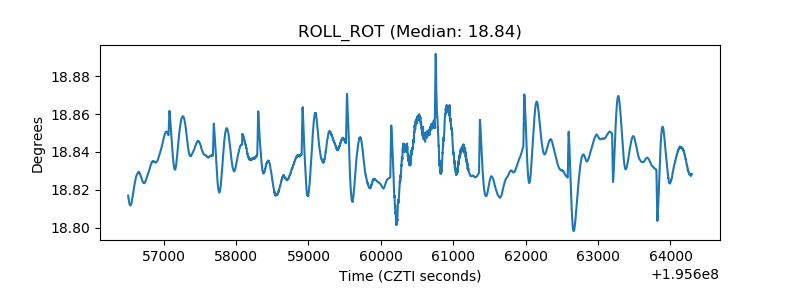 |
| _Roll_DEC | 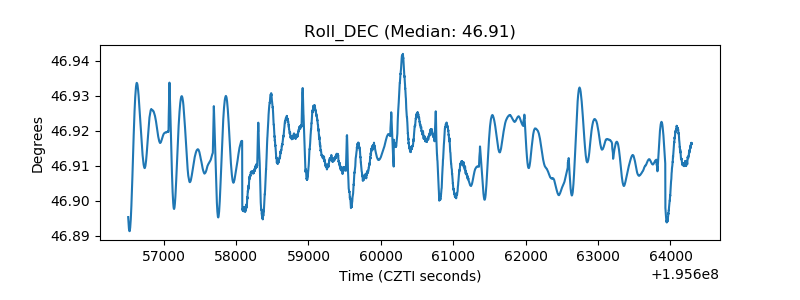 |
| _Roll_RA | 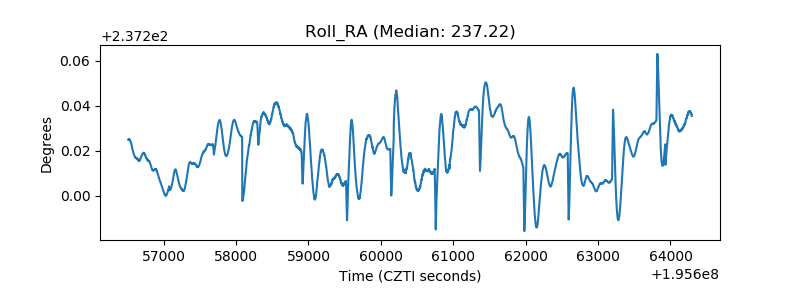 |
| Veto Counter | 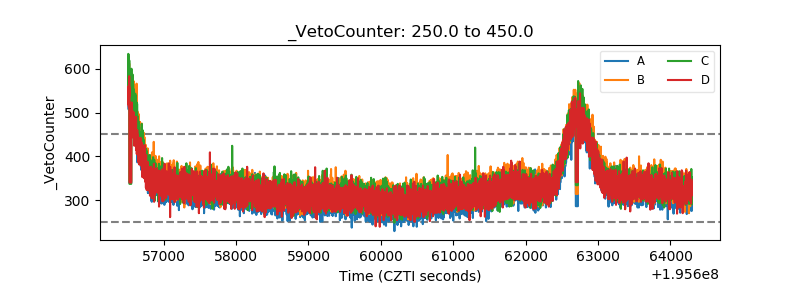 |