| Param | Original file | Final file |
|---|---|---|
| Filename | modeM0/AS1T01_046T01_9000000372_02495cztM0_level2.fits | modeM0/AS1T01_046T01_9000000372_02495cztM0_level2_quad_clean.evt |
| Size (bytes) | 432,063,360 | 122,702,400 |
| Size | 412.0 MB | 117.0 MB |
| Events in quadrant A | 4,045,592 | 806,513 |
| Events in quadrant B | 3,680,675 | 829,925 |
| Events in quadrant C | 3,595,732 | 793,675 |
| Events in quadrant D | 4,057,624 | 737,538 |
| Mode M0 | |||
|---|---|---|---|
| Quadrant | BADHDUFLAG | Total packets | Discarded packets |
| A | 0 | 17299 | 3 |
| B | 0 | 16656 | 2 |
| C | 0 | 16463 | 2 |
| D | 0 | 17957 | 2 |
| Mode M9 | |||
|---|---|---|---|
| Quadrant | BADHDUFLAG | Total packets | Discarded packets |
| A | 0 | 4 | 0 |
| B | 0 | 4 | 0 |
| C | 0 | 4 | 0 |
| D | 0 | 4 | 0 |
| Mode SS | |||
|---|---|---|---|
| Quadrant | BADHDUFLAG | Total packets | Discarded packets |
| A | 0 | 158 | 0 |
| B | 0 | 158 | 0 |
| C | 0 | 158 | 0 |
| D | 0 | 158 | 0 |
| Quadrant | Total seconds | Saturated seconds | Saturation percentage |
|---|---|---|---|
| A | 7883 | 336 | 4.262337% |
| B | 7883 | 330 | 4.186224% |
| C | 7883 | 250 | 3.171381% |
| D | 7883 | 278 | 3.526576% |
Noise dominated data is calculated using 1-second bins in cleaned event files. If a bin has >2000 counts, and if more than 50% of those come from <1% of pixels, then it is considered to be noise-dominated and hence unusable.
| Quadrant | # 1 sec bins | Bins with >0 counts | Bins with >2000 counts | High rate bins dominated by noise | Noise dominated (total time) | Noise dominated (detector-on time) | Marked lightcurve |
|---|---|---|---|---|---|---|---|
| A | 8133 | 7885 | 0 | 0 | 0.00% | 0.00% |  |
| B | 8133 | 7885 | 1 | 1 | 0.01% | 0.01% | 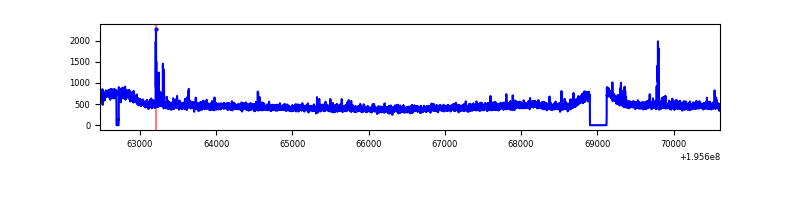 |
| C | 8133 | 7885 | 0 | 0 | 0.00% | 0.00% | 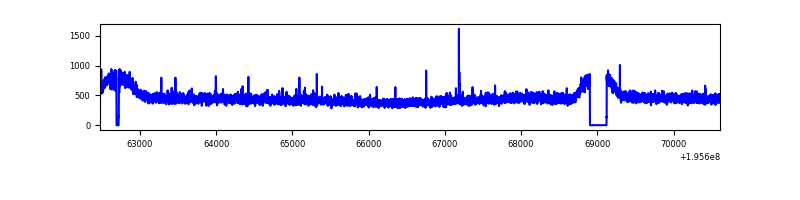 |
| D | 8133 | 7885 | 45 | 45 | 0.55% | 0.57% | 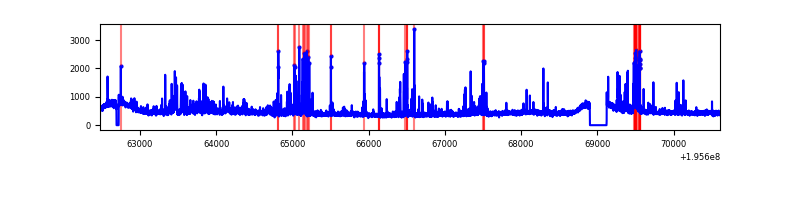 |
Top three noisy pixels from each quadrant. If the there are fewer than three noisy pixels in the level2.evt file, extra rows are filled as -1
| Pixel properties | Quadrant properties | ||||||
|---|---|---|---|---|---|---|---|
| Quadrant | DetID | PixID | Counts | Sigma | Mean | Median | Sigma |
| A | 8 | 15 | 284097 | 1481.73 | 927 | 902 | 191.1 |
| A | 12 | 133 | 195502 | 1018.18 | 927 | 902 | 191.1 |
| A | 12 | 194 | 10452 | 49.97 | 927 | 902 | 191.1 |
| B | 5 | 172 | 31836 | 169.5 | 938 | 910 | 182.5 |
| B | 7 | 205 | 25543 | 135.01 | 938 | 910 | 182.5 |
| B | 12 | 111 | 13156 | 67.12 | 938 | 910 | 182.5 |
| C | 8 | 112 | 33248 | 153.74 | 900 | 900 | 210.4 |
| C | 8 | 128 | 14617 | 65.19 | 900 | 900 | 210.4 |
| C | 10 | 65 | 13059 | 57.79 | 900 | 900 | 210.4 |
| D | 11 | 130 | 260057 | 1200.79 | 896 | 869 | 215.8 |
| D | 5 | 172 | 113411 | 521.39 | 896 | 869 | 215.8 |
| D | 13 | 238 | 89018 | 408.38 | 896 | 869 | 215.8 |
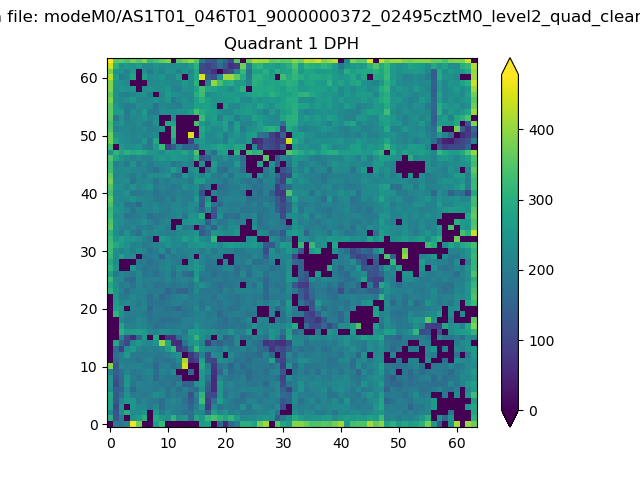
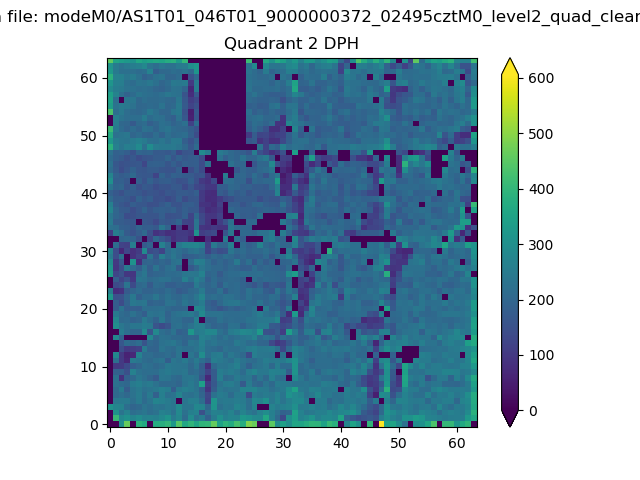
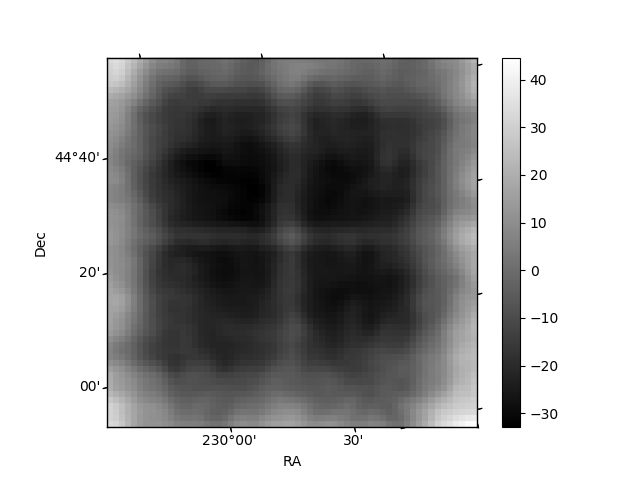
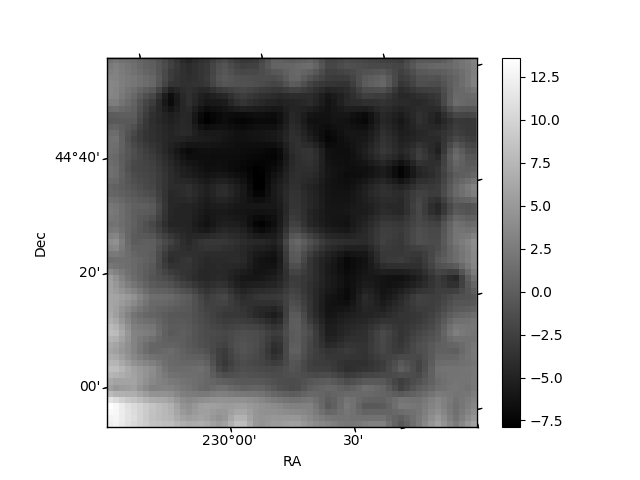
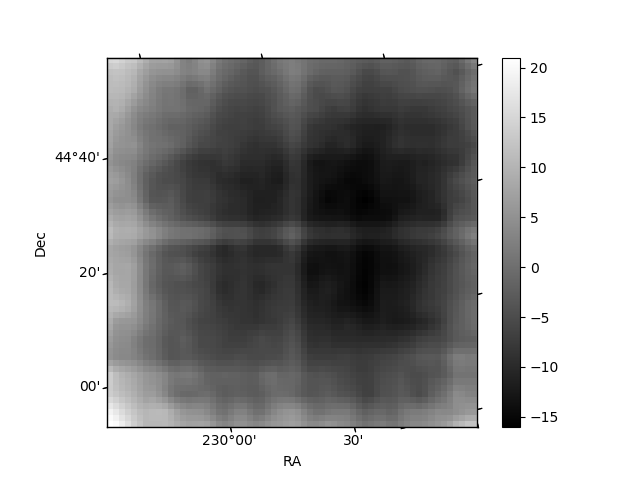
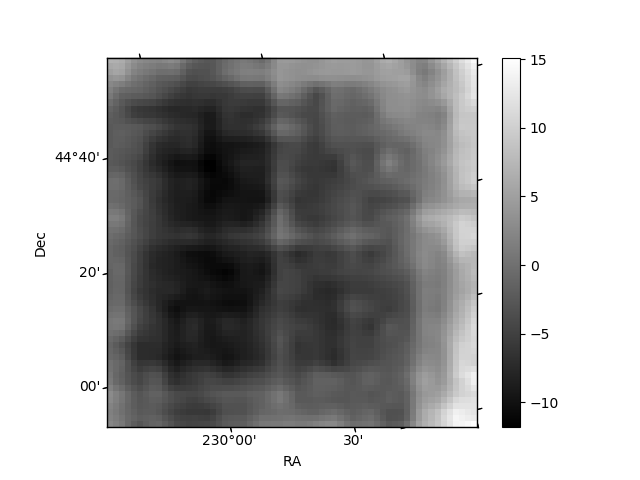
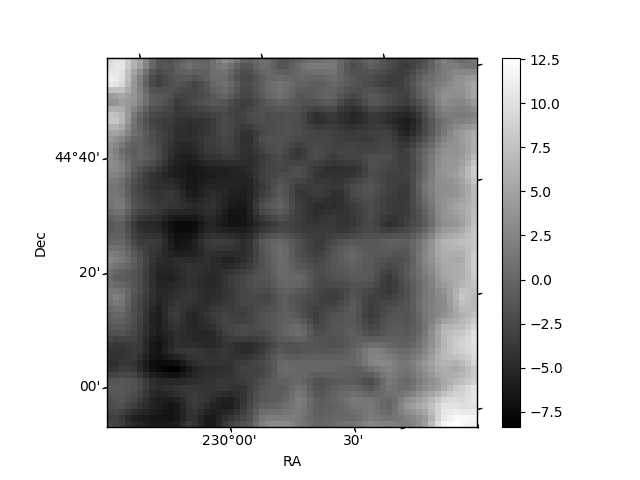
Histogram calculated using DETX and DETY for each event in the final _common_clean file
| Quadrant A | 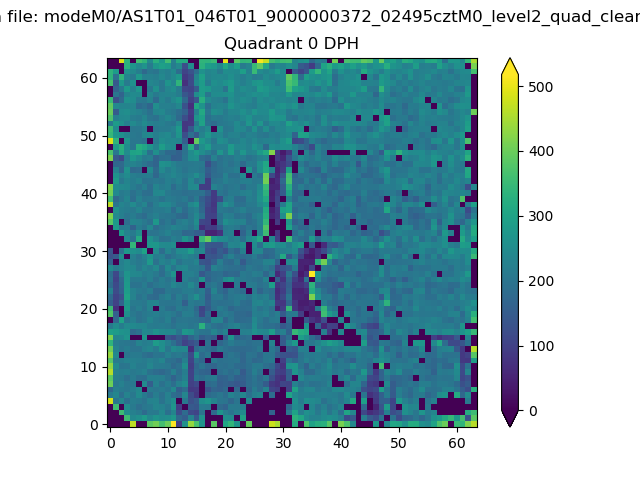 |
 |
Quadrant B |
|---|---|---|---|
| Quadrant D | 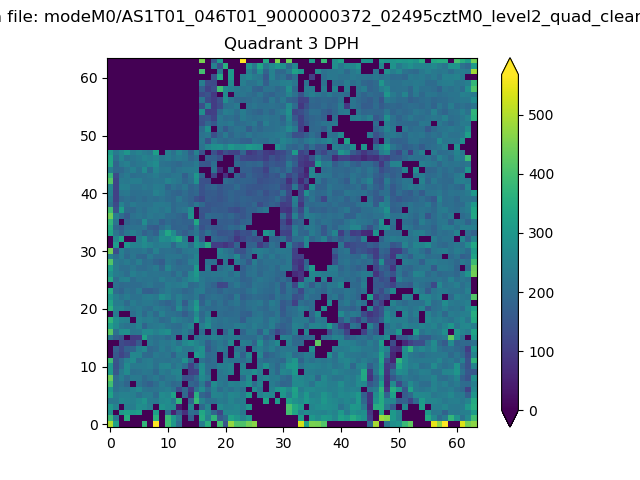 |
 |
Quadrant C |
| Plot type | Count rate plots | Images |
|---|---|---|
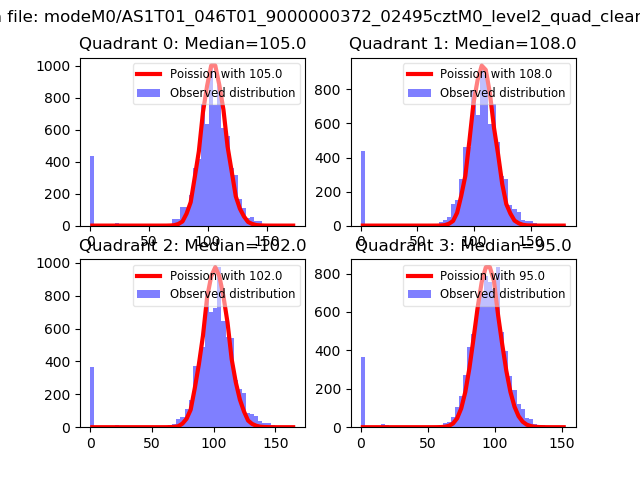
| Comparison with Poisson distribution Blue bars denote a histogram of data divided into 1 sec bins. Red curve is a Poisson curve with rate = median count rate of data. |
 |
 |
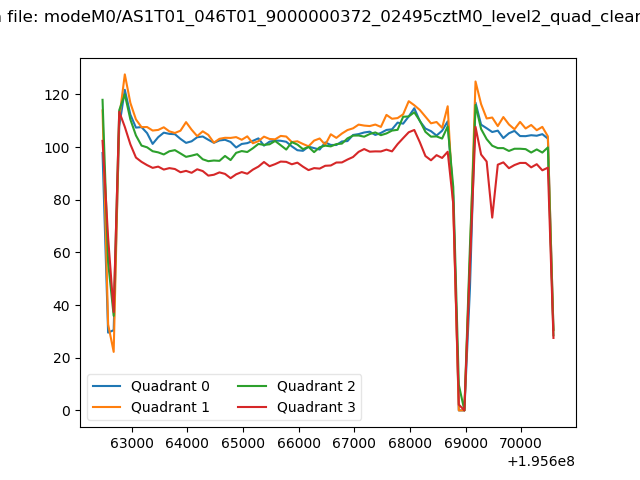
| Quadrant-wise count rates Data is divided into 100 sec bins |
 |
|
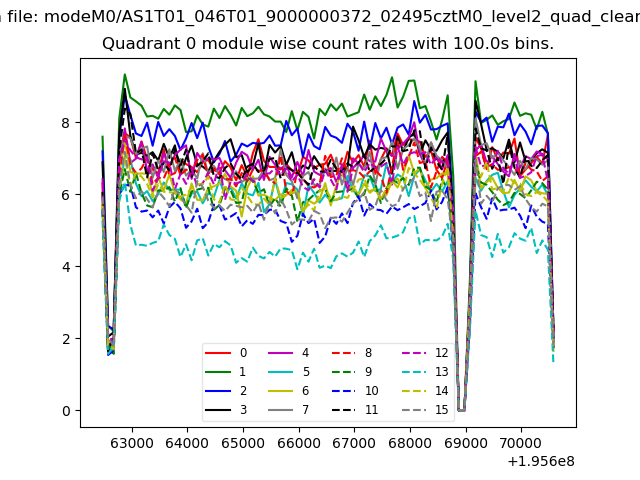
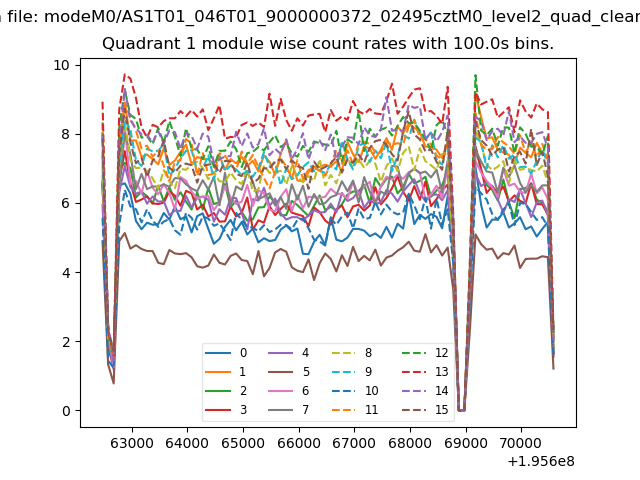
| Module-wise count rates for Quadrant A Data is divided into 100 sec bins |
 |
 |
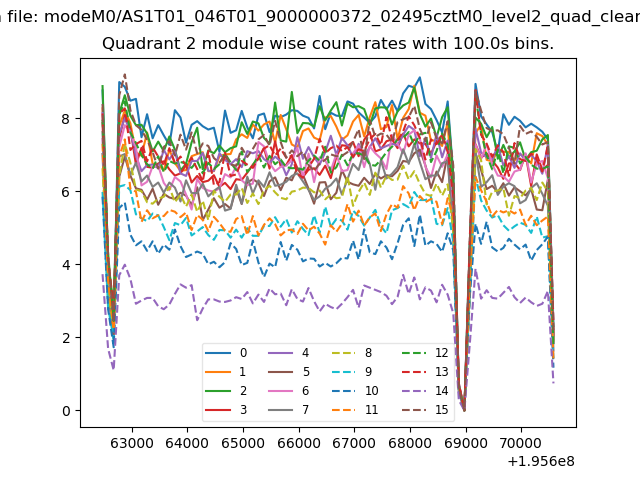
| Module-wise count rates for Quadrant B Data is divided into 100 sec bins |
 |
 |
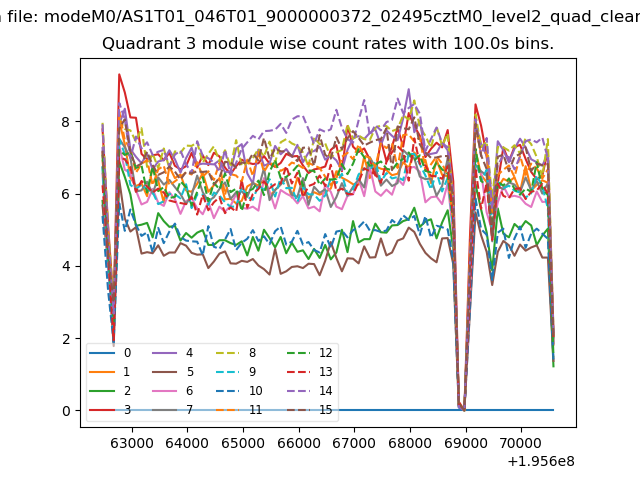
| Module-wise count rates for Quadrant C Data is divided into 100 sec bins |
 |
 |
| Module-wise count rates for Quadrant D Data is divided into 100 sec bins |
 |
 |
| Parameter | Plot |
|---|---|
| CZT HV Monitor | 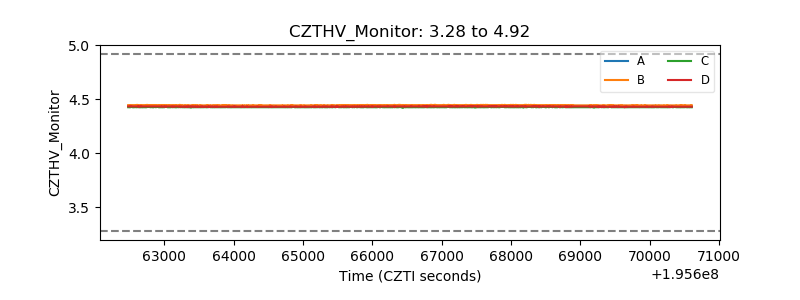 |
| D_VDD |  |
| Temperature 1 | 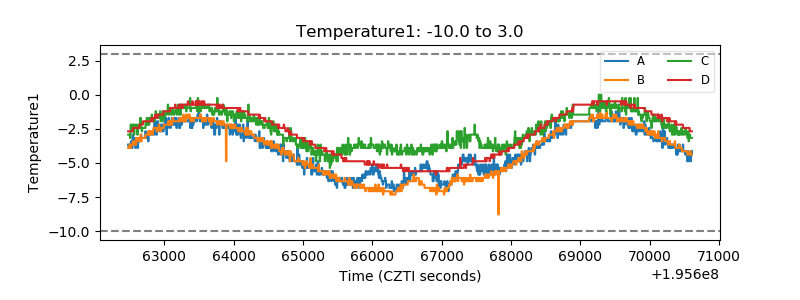 |
| Veto HV Monitor | 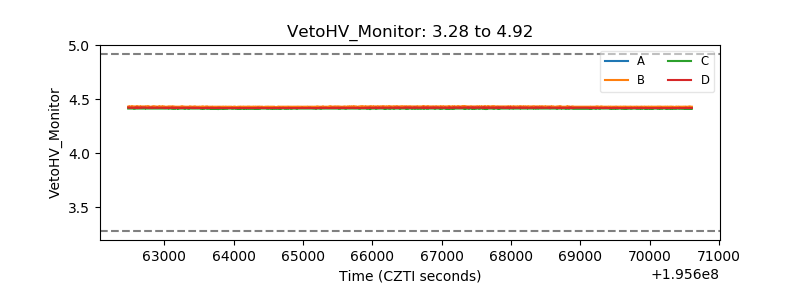 |
| Veto LLD | 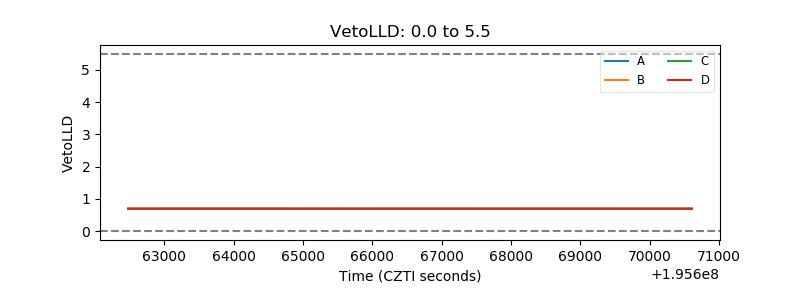 |
| Alpha Counter | 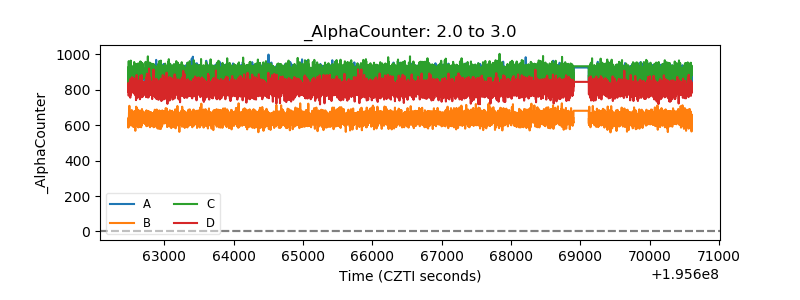 |
| _CPM_Rate | 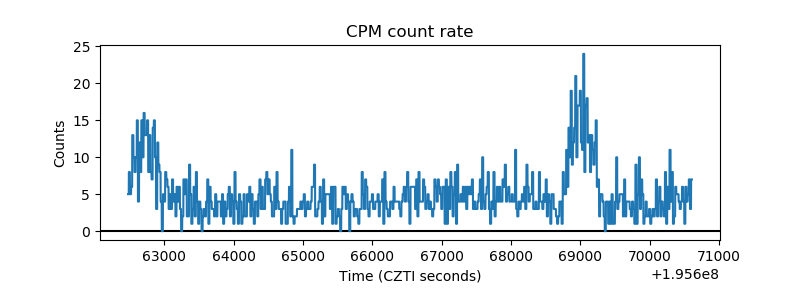 |
| CZT Counter | 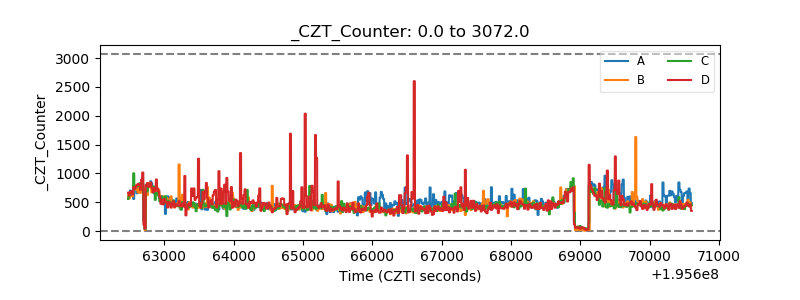 |
| +2.5 Volts monitor |  |
| +5 Volts monitor | 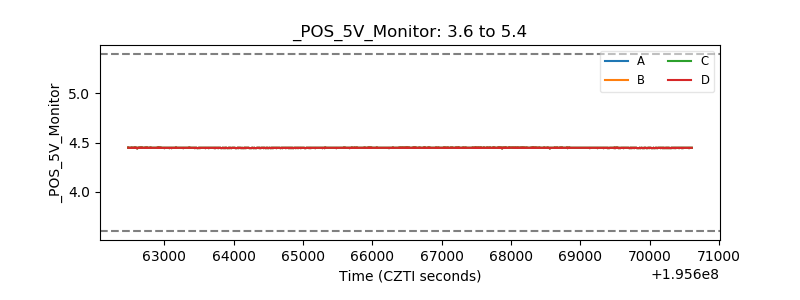 |
| _ROLL_ROT | 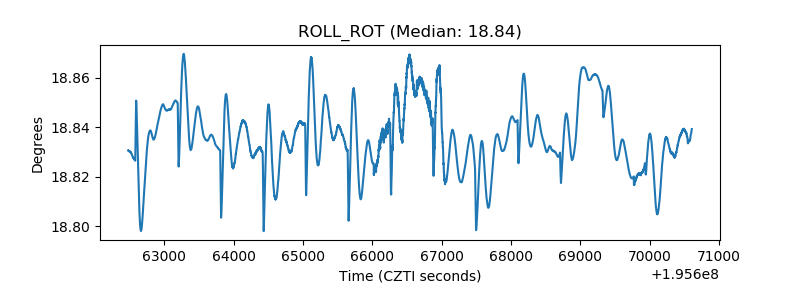 |
| _Roll_DEC | 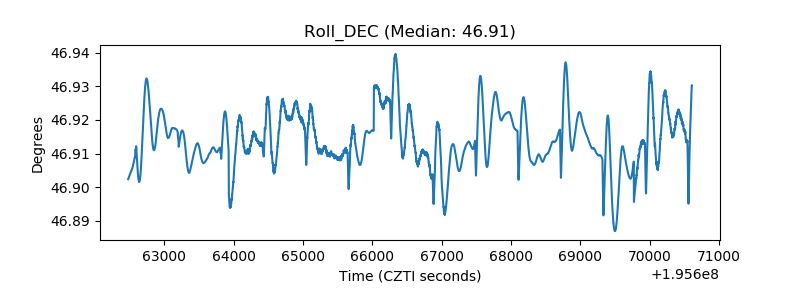 |
| _Roll_RA | 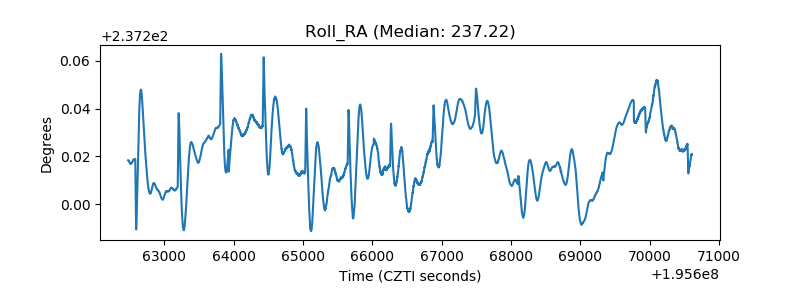 |
| Veto Counter |  |