| Param | Original file | Final file |
|---|---|---|
| Filename | modeM0/AS1T01_046T01_9000000372_02496cztM0_level2.fits | modeM0/AS1T01_046T01_9000000372_02496cztM0_level2_quad_clean.evt |
| Size (bytes) | 424,514,880 | 122,273,280 |
| Size | 404.8 MB | 116.6 MB |
| Events in quadrant A | 3,769,831 | 807,612 |
| Events in quadrant B | 3,585,177 | 829,685 |
| Events in quadrant C | 3,452,903 | 795,594 |
| Events in quadrant D | 4,297,251 | 725,435 |
| Mode M0 | |||
|---|---|---|---|
| Quadrant | BADHDUFLAG | Total packets | Discarded packets |
| A | 0 | 16972 | 3 |
| B | 0 | 16245 | 2 |
| C | 0 | 16030 | 2 |
| D | 0 | 18736 | 2 |
| Mode M9 | |||
|---|---|---|---|
| Quadrant | BADHDUFLAG | Total packets | Discarded packets |
| A | 0 | 7 | 0 |
| B | 0 | 7 | 0 |
| C | 0 | 7 | 0 |
| D | 0 | 7 | 0 |
| Mode SS | |||
|---|---|---|---|
| Quadrant | BADHDUFLAG | Total packets | Discarded packets |
| A | 0 | 160 | 0 |
| B | 0 | 160 | 0 |
| C | 0 | 160 | 0 |
| D | 0 | 160 | 0 |
| Quadrant | Total seconds | Saturated seconds | Saturation percentage |
|---|---|---|---|
| A | 7818 | 219 | 2.801228% |
| B | 7818 | 166 | 2.123305% |
| C | 7818 | 142 | 1.816321% |
| D | 7818 | 334 | 4.272192% |
Noise dominated data is calculated using 1-second bins in cleaned event files. If a bin has >2000 counts, and if more than 50% of those come from <1% of pixels, then it is considered to be noise-dominated and hence unusable.
| Quadrant | # 1 sec bins | Bins with >0 counts | Bins with >2000 counts | High rate bins dominated by noise | Noise dominated (total time) | Noise dominated (detector-on time) | Marked lightcurve |
|---|---|---|---|---|---|---|---|
| A | 8498 | 7820 | 6 | 6 | 0.07% | 0.08% | 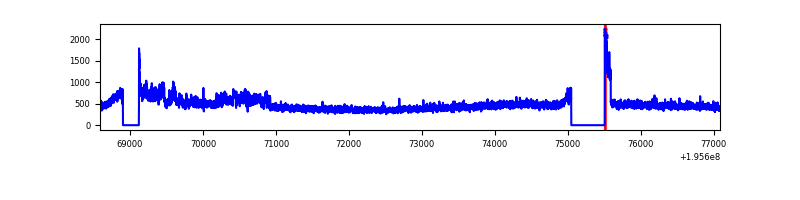 |
| B | 8498 | 7820 | 1 | 1 | 0.01% | 0.01% | 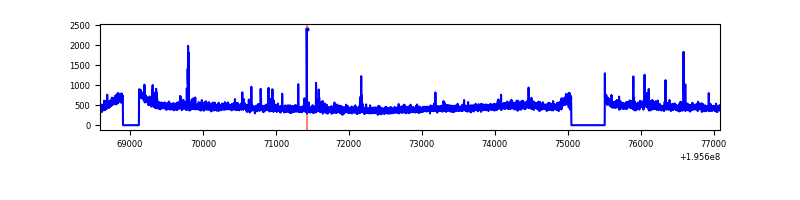 |
| C | 8498 | 7820 | 0 | 0 | 0.00% | 0.00% | 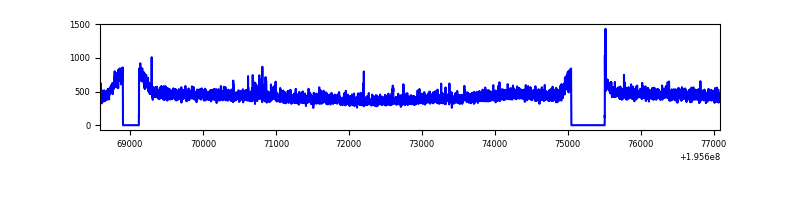 |
| D | 8498 | 7820 | 160 | 160 | 1.88% | 2.05% | 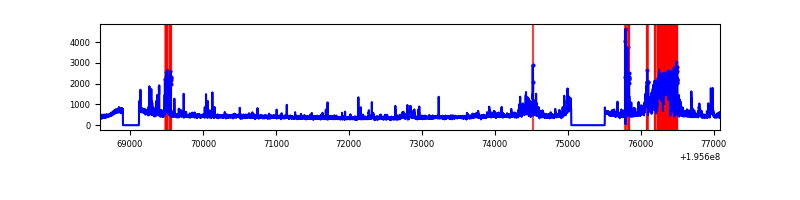 |
Top three noisy pixels from each quadrant. If the there are fewer than three noisy pixels in the level2.evt file, extra rows are filled as -1
| Pixel properties | Quadrant properties | ||||||
|---|---|---|---|---|---|---|---|
| Quadrant | DetID | PixID | Counts | Sigma | Mean | Median | Sigma |
| A | 8 | 15 | 251114 | 1355.11 | 893 | 869 | 184.7 |
| A | 12 | 133 | 83642 | 448.22 | 893 | 869 | 184.7 |
| A | 12 | 194 | 9868 | 48.73 | 893 | 869 | 184.7 |
| B | 7 | 205 | 61653 | 344.92 | 907 | 881 | 176.2 |
| B | 12 | 111 | 12799 | 67.64 | 907 | 881 | 176.2 |
| B | 11 | 111 | 11040 | 57.66 | 907 | 881 | 176.2 |
| C | 8 | 208 | 11617 | 52.24 | 873 | 873 | 205.7 |
| C | 10 | 65 | 10434 | 46.49 | 873 | 873 | 205.7 |
| C | 13 | 61 | 8100 | 35.14 | 873 | 873 | 205.7 |
| D | 2 | 184 | 498969 | 2422.2 | 859 | 835 | 205.7 |
| D | 12 | 110 | 172823 | 836.3 | 859 | 835 | 205.7 |
| D | 13 | 238 | 118636 | 572.81 | 859 | 835 | 205.7 |
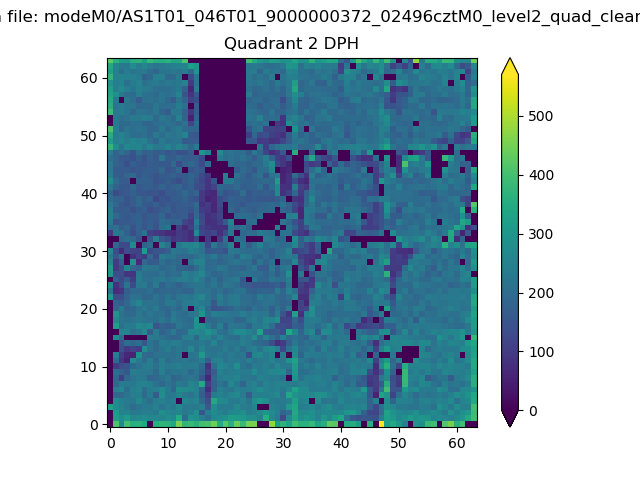
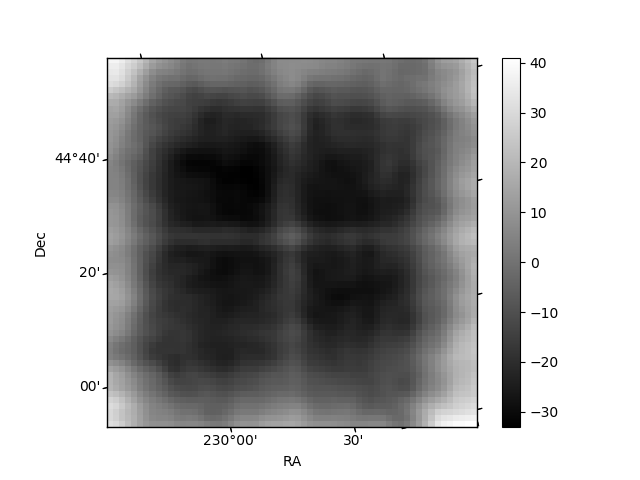
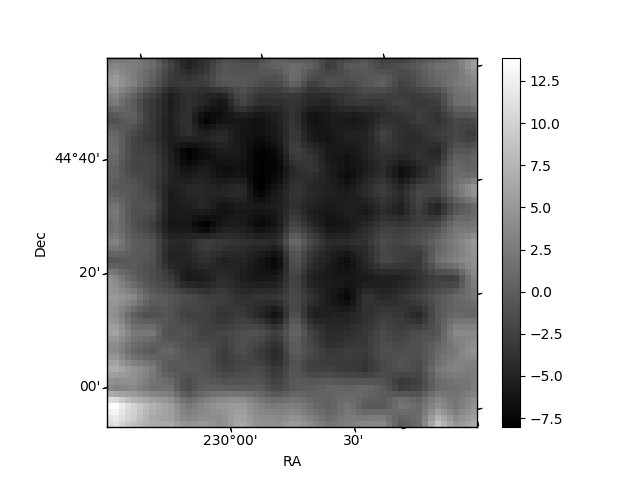
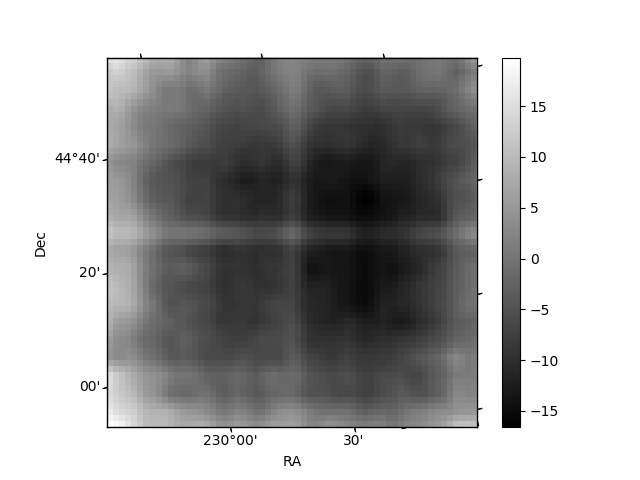
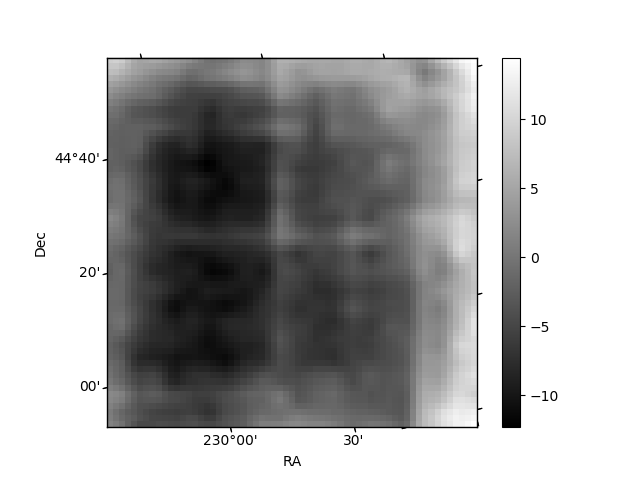
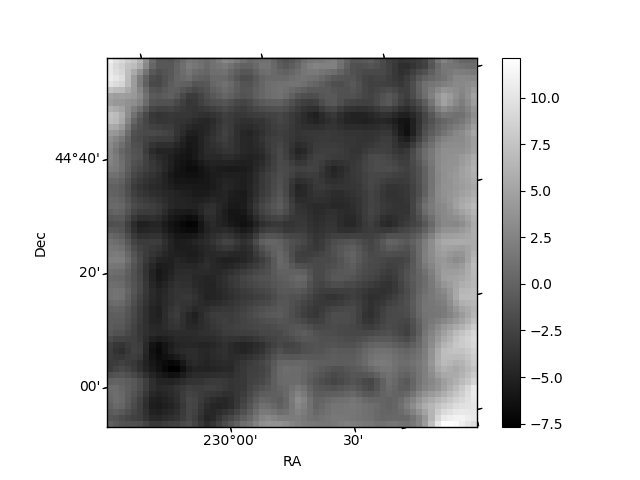
Histogram calculated using DETX and DETY for each event in the final _common_clean file
| Quadrant A | 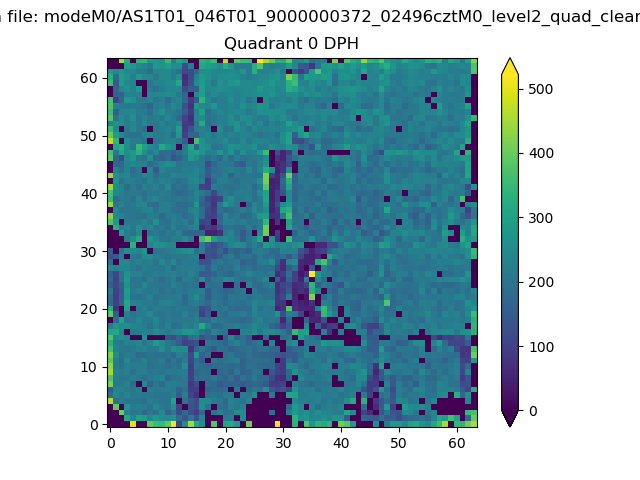 |
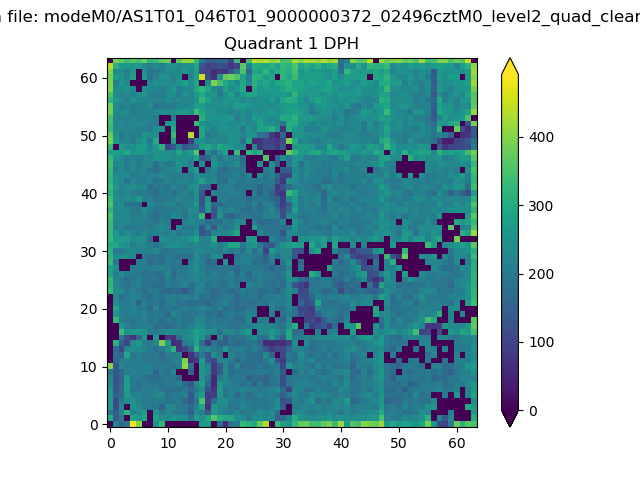 |
Quadrant B |
|---|---|---|---|
| Quadrant D | 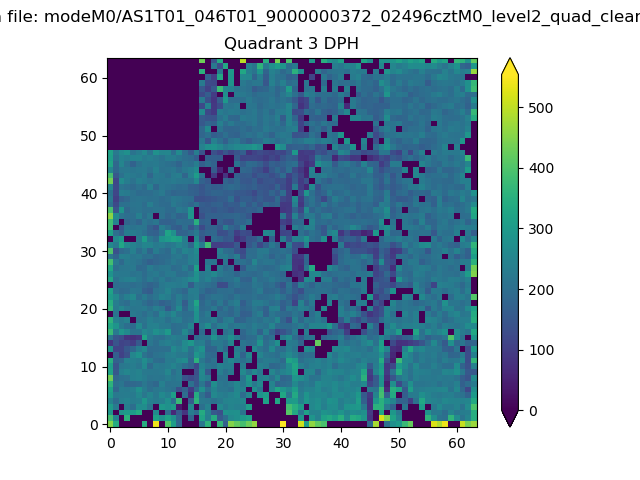 |
 |
Quadrant C |
| Plot type | Count rate plots | Images |
|---|---|---|
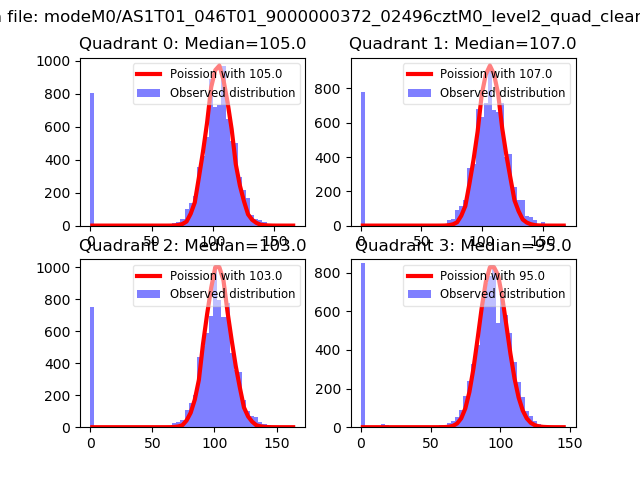
| Comparison with Poisson distribution Blue bars denote a histogram of data divided into 1 sec bins. Red curve is a Poisson curve with rate = median count rate of data. |
 |
 |
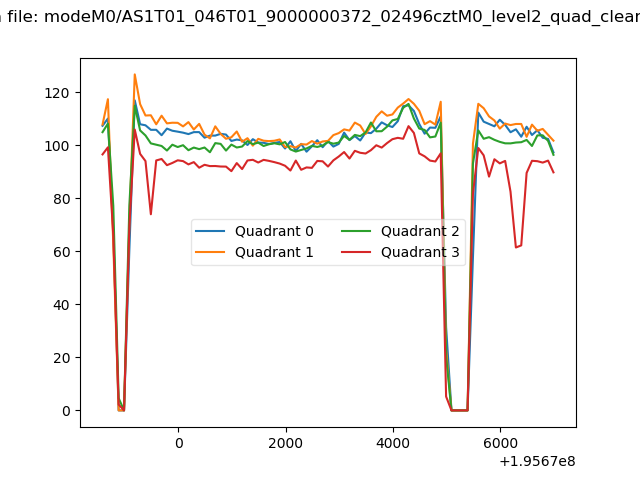
| Quadrant-wise count rates Data is divided into 100 sec bins |
 |
|
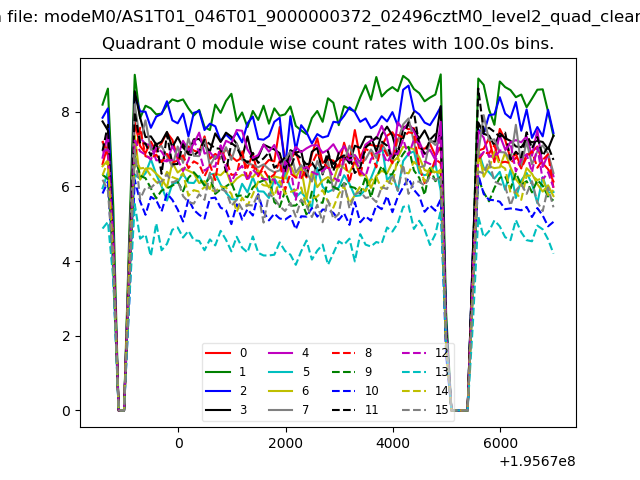
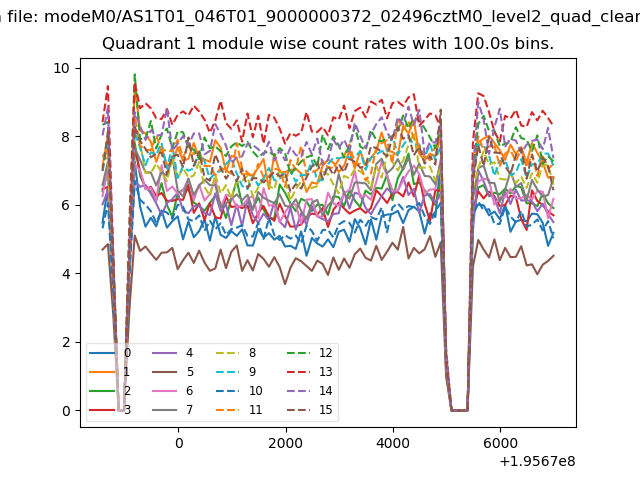
| Module-wise count rates for Quadrant A Data is divided into 100 sec bins |
 |
 |
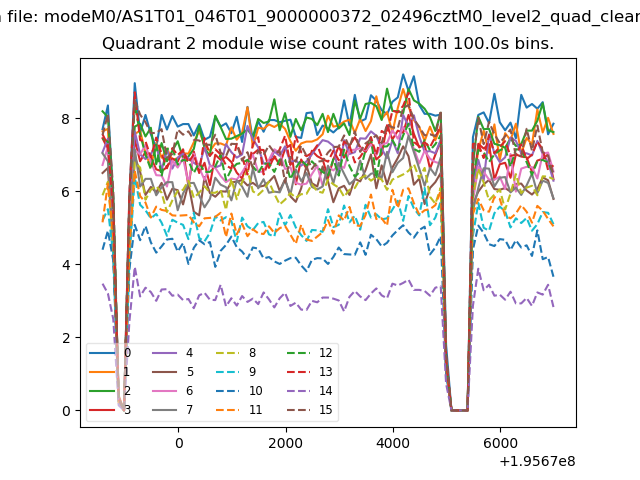
| Module-wise count rates for Quadrant B Data is divided into 100 sec bins |
 |
 |
| Module-wise count rates for Quadrant C Data is divided into 100 sec bins |
 |
 |
| Module-wise count rates for Quadrant D Data is divided into 100 sec bins |
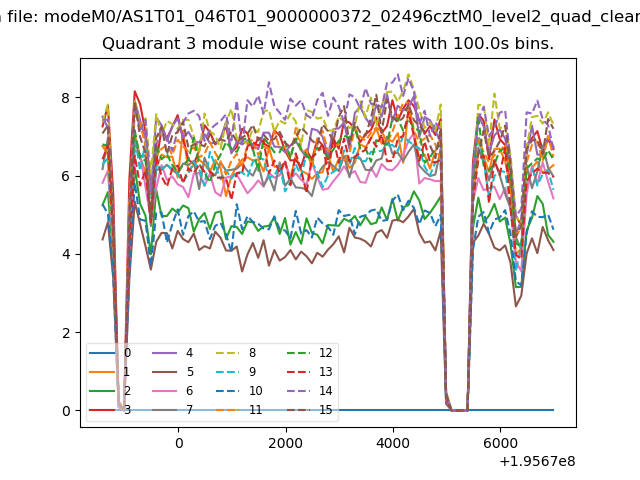 |
 |
| Parameter | Plot |
|---|---|
| CZT HV Monitor | 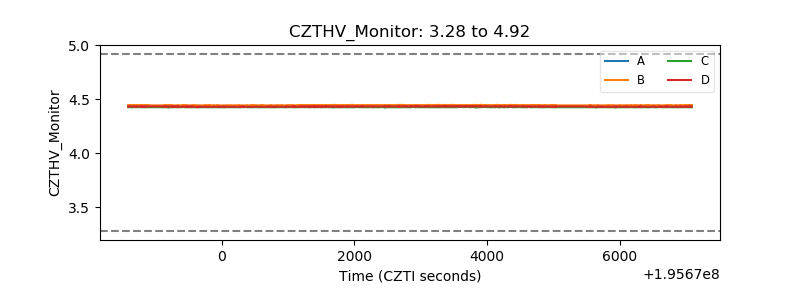 |
| D_VDD | 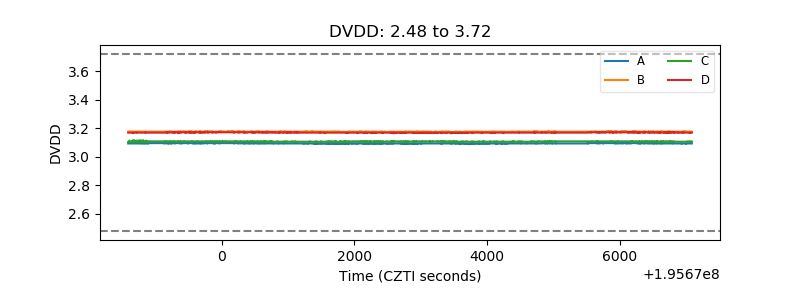 |
| Temperature 1 | 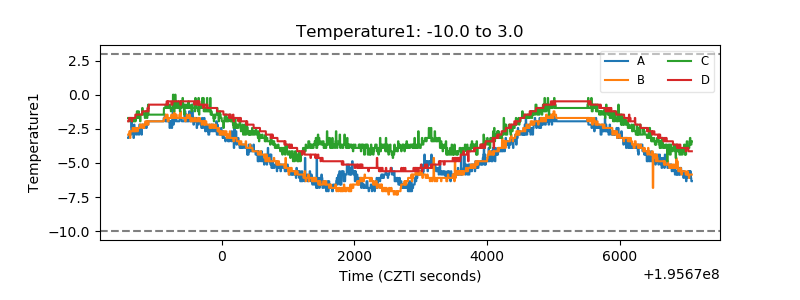 |
| Veto HV Monitor | 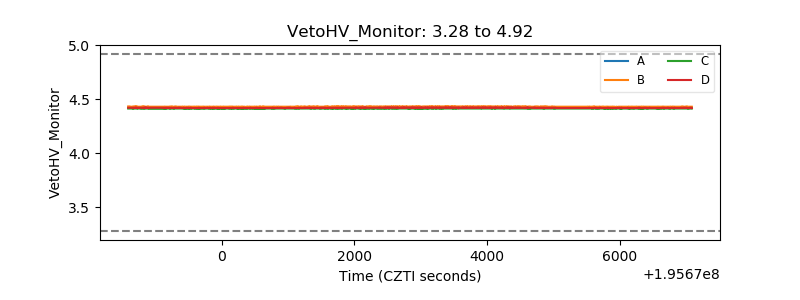 |
| Veto LLD | 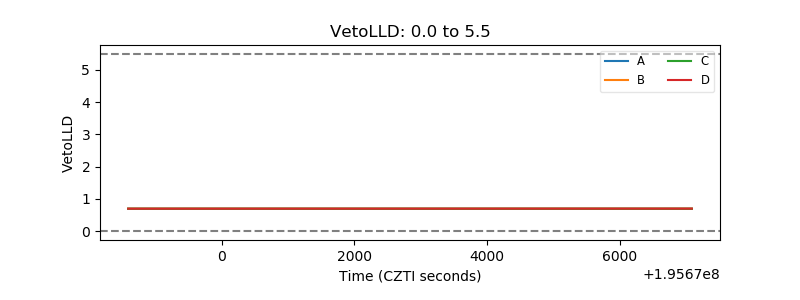 |
| Alpha Counter | 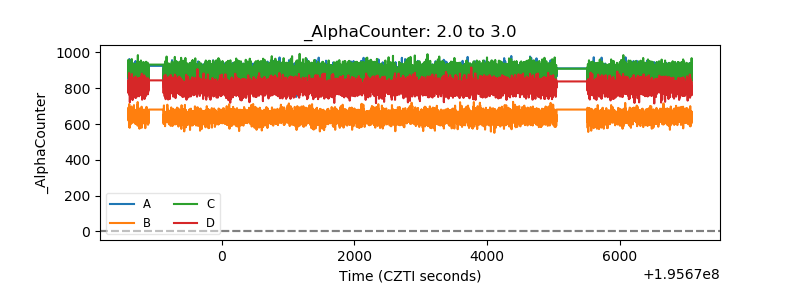 |
| _CPM_Rate | 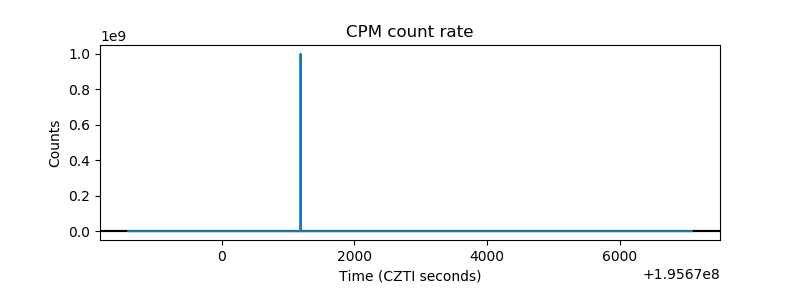 |
| CZT Counter | 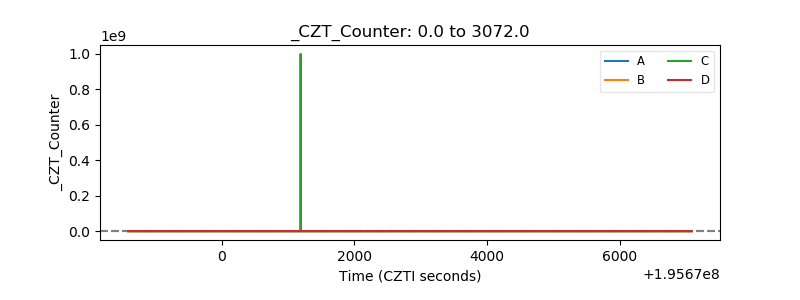 |
| +2.5 Volts monitor | 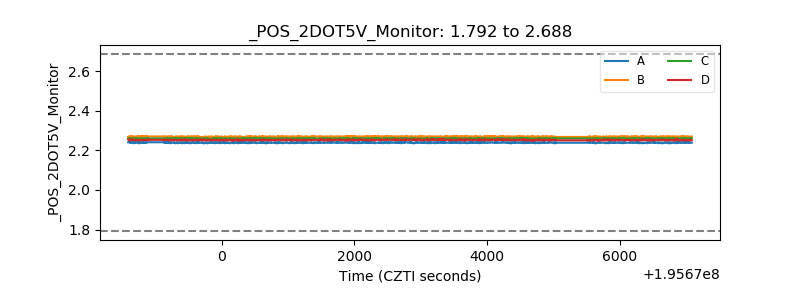 |
| +5 Volts monitor | 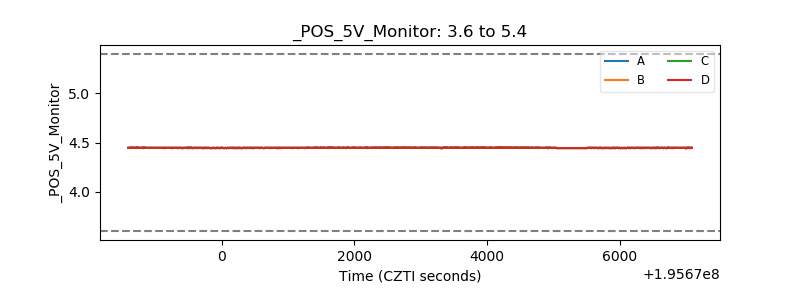 |
| _ROLL_ROT | 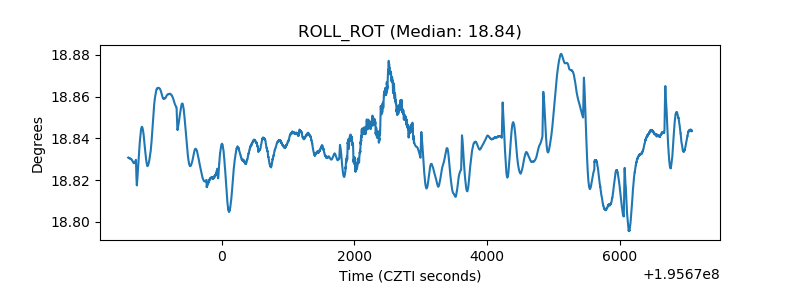 |
| _Roll_DEC | 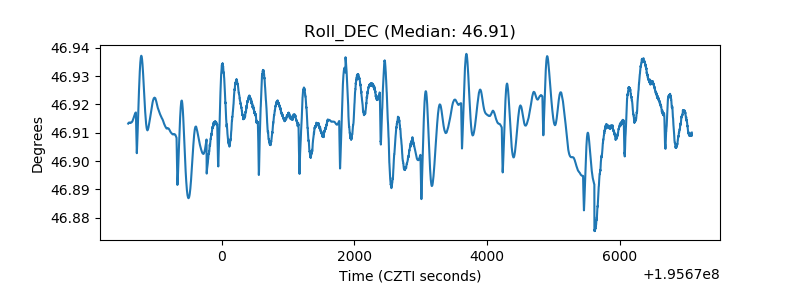 |
| _Roll_RA | 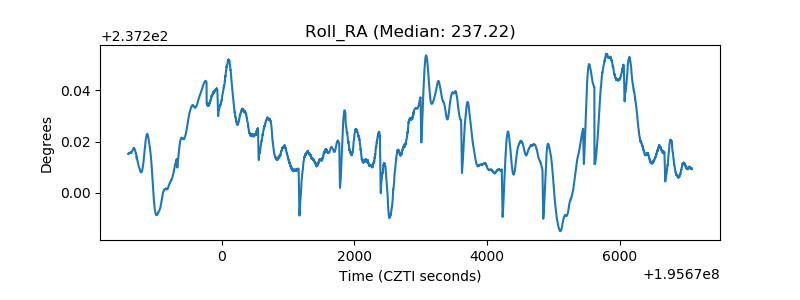 |
| Veto Counter | 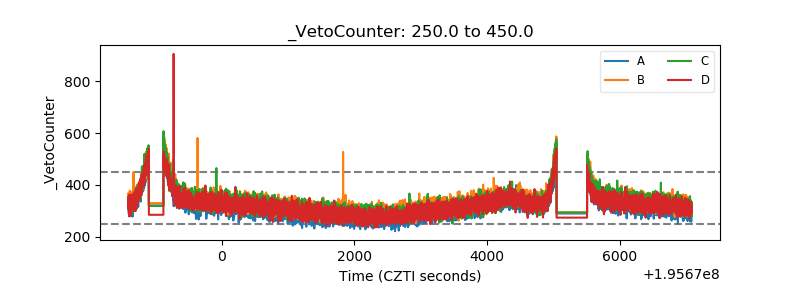 |