| Param | Original file | Final file |
|---|---|---|
| Filename | modeM0/AS1T01_046T01_9000000372_02499cztM0_level2.fits | modeM0/AS1T01_046T01_9000000372_02499cztM0_level2_quad_clean.evt |
| Size (bytes) | 817,493,760 | 262,448,640 |
| Size | 779.6 MB | 250.3 MB |
| Events in quadrant A | 7,031,633 | 1,712,391 |
| Events in quadrant B | 7,381,648 | 1,792,538 |
| Events in quadrant C | 7,135,839 | 1,716,278 |
| Events in quadrant D | 7,416,521 | 1,573,966 |
| Mode M0 | |||
|---|---|---|---|
| Quadrant | BADHDUFLAG | Total packets | Discarded packets |
| A | 0 | 33855 | 174 |
| B | 0 | 34421 | 167 |
| C | 0 | 34027 | 172 |
| D | 0 | 35402 | 194 |
| Mode M9 | |||
|---|---|---|---|
| Quadrant | BADHDUFLAG | Total packets | Discarded packets |
| A | 0 | 25 | 0 |
| B | 0 | 25 | 0 |
| C | 0 | 25 | 1 |
| D | 0 | 25 | 1 |
| Mode SS | |||
|---|---|---|---|
| Quadrant | BADHDUFLAG | Total packets | Discarded packets |
| A | 0 | 340 | 0 |
| B | 0 | 340 | 0 |
| C | 0 | 340 | 0 |
| D | 0 | 340 | 2 |
| Quadrant | Total seconds | Saturated seconds | Saturation percentage |
|---|---|---|---|
| A | 16683 | 43 | 0.257747% |
| B | 16687 | 57 | 0.341583% |
| C | 16684 | 58 | 0.347638% |
| D | 16672 | 105 | 0.629798% |
Noise dominated data is calculated using 1-second bins in cleaned event files. If a bin has >2000 counts, and if more than 50% of those come from <1% of pixels, then it is considered to be noise-dominated and hence unusable.
| Quadrant | # 1 sec bins | Bins with >0 counts | Bins with >2000 counts | High rate bins dominated by noise | Noise dominated (total time) | Noise dominated (detector-on time) | Marked lightcurve |
|---|---|---|---|---|---|---|---|
| A | 19198 | 16729 | 1 | 1 | 0.01% | 0.01% | 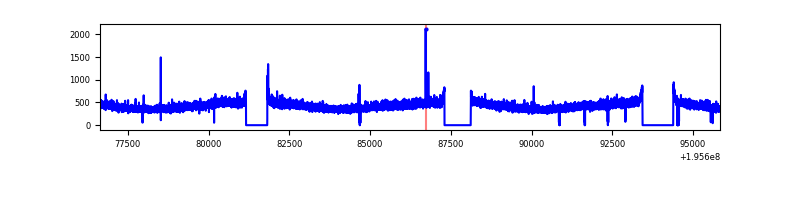 |
| B | 19198 | 16722 | 2 | 2 | 0.01% | 0.01% | 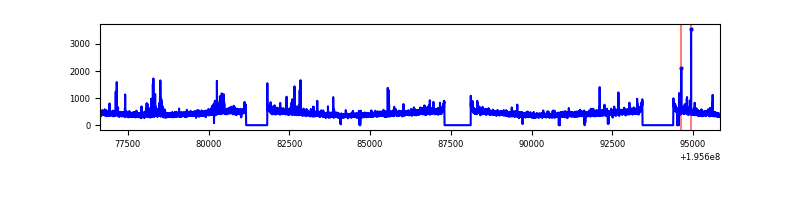 |
| C | 19198 | 16721 | 1 | 1 | 0.01% | 0.01% | 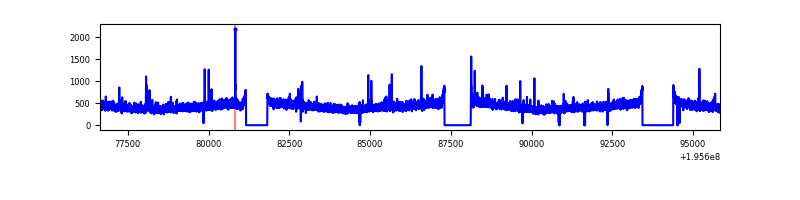 |
| D | 19198 | 16720 | 40 | 40 | 0.21% | 0.24% | 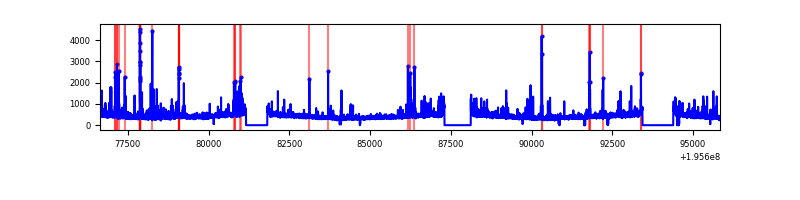 |
Top three noisy pixels from each quadrant. If the there are fewer than three noisy pixels in the level2.evt file, extra rows are filled as -1
| Pixel properties | Quadrant properties | ||||||
|---|---|---|---|---|---|---|---|
| Quadrant | DetID | PixID | Counts | Sigma | Mean | Median | Sigma |
| A | 0 | 9 | 21376 | 52.64 | 1819 | 1776 | 372.3 |
| A | 12 | 194 | 20263 | 49.65 | 1819 | 1776 | 372.3 |
| A | 0 | 226 | 19736 | 48.24 | 1819 | 1776 | 372.3 |
| B | 10 | 244 | 121399 | 340.34 | 1854 | 1809 | 351.4 |
| B | 15 | 186 | 38262 | 103.74 | 1854 | 1809 | 351.4 |
| B | 14 | 167 | 31903 | 85.64 | 1854 | 1809 | 351.4 |
| C | 10 | 65 | 36006 | 82.37 | 1782 | 1789 | 415.4 |
| C | 8 | 112 | 31251 | 70.92 | 1782 | 1789 | 415.4 |
| C | 5 | 250 | 25380 | 56.79 | 1782 | 1789 | 415.4 |
| D | 12 | 110 | 232915 | 557.62 | 1752 | 1710 | 414.6 |
| D | 2 | 184 | 161541 | 385.48 | 1752 | 1710 | 414.6 |
| D | 11 | 130 | 97269 | 230.47 | 1752 | 1710 | 414.6 |
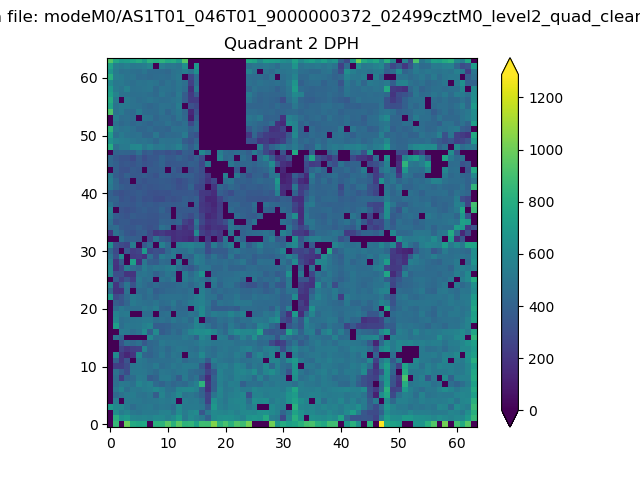
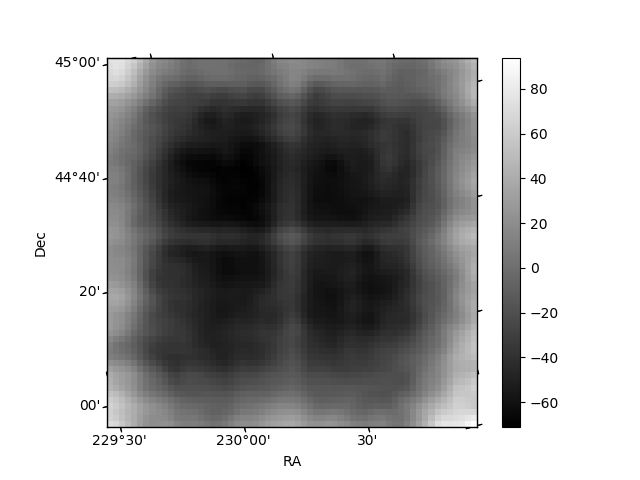
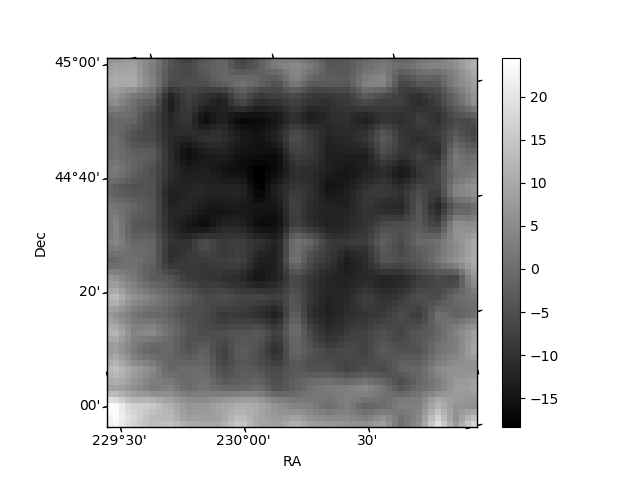
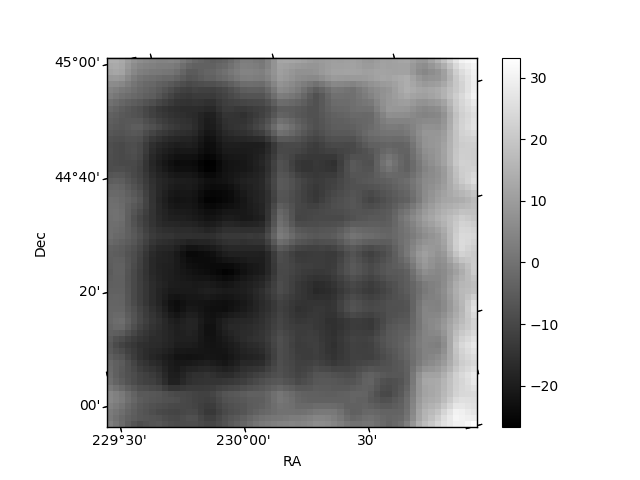
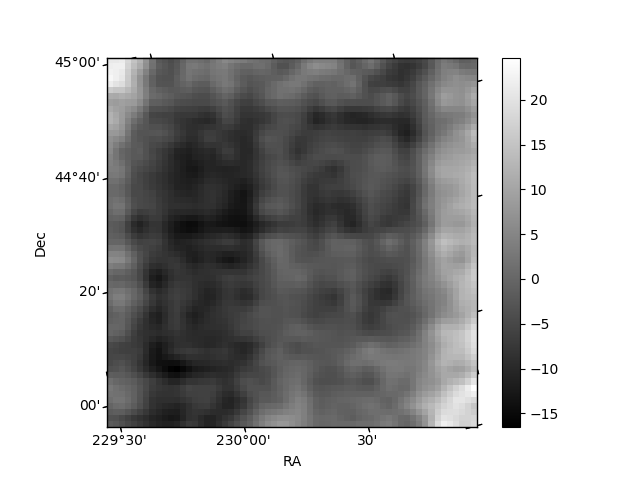
Histogram calculated using DETX and DETY for each event in the final _common_clean file
| Quadrant A | 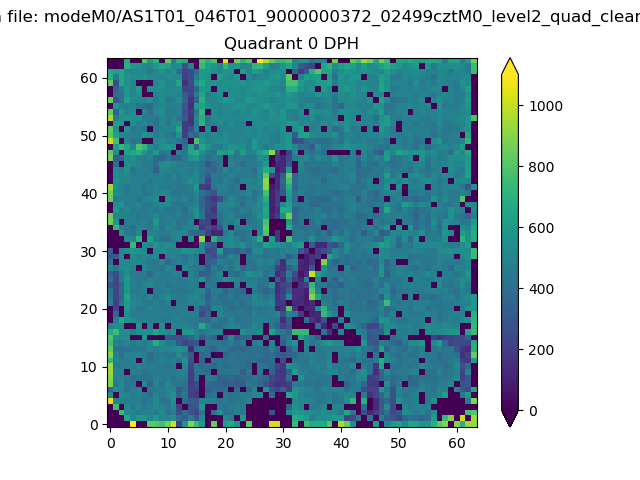 |
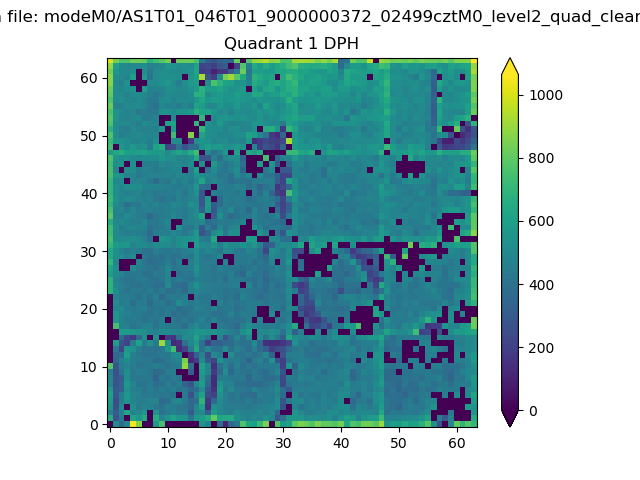 |
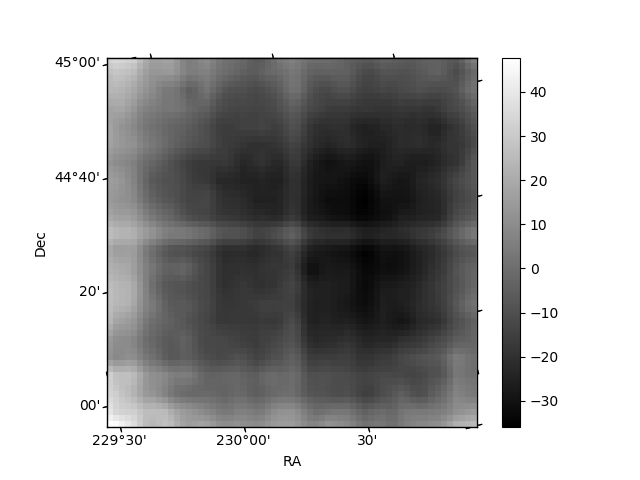
Quadrant B |
|---|---|---|---|
| Quadrant D | 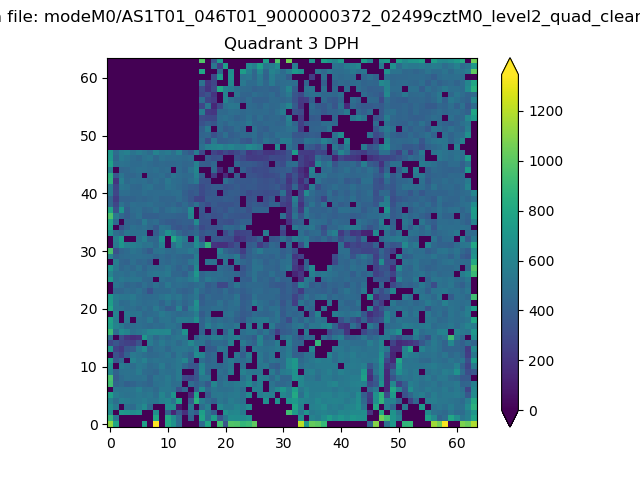 |
 |
Quadrant C |
| Plot type | Count rate plots | Images |
|---|---|---|
| Comparison with Poisson distribution Blue bars denote a histogram of data divided into 1 sec bins. Red curve is a Poisson curve with rate = median count rate of data. |
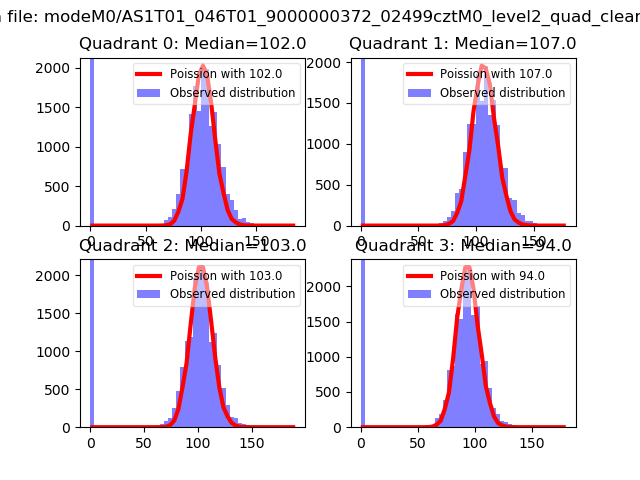 |
 |
| Quadrant-wise count rates Data is divided into 100 sec bins |
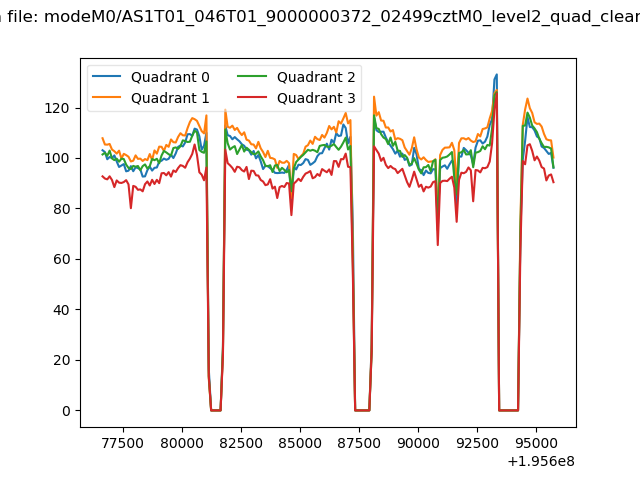 |
|
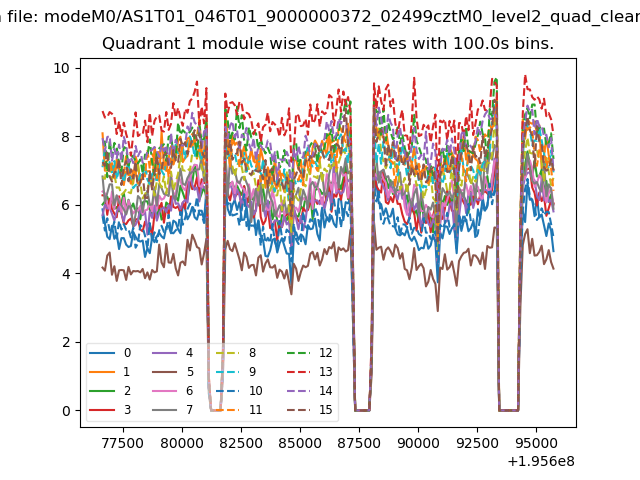
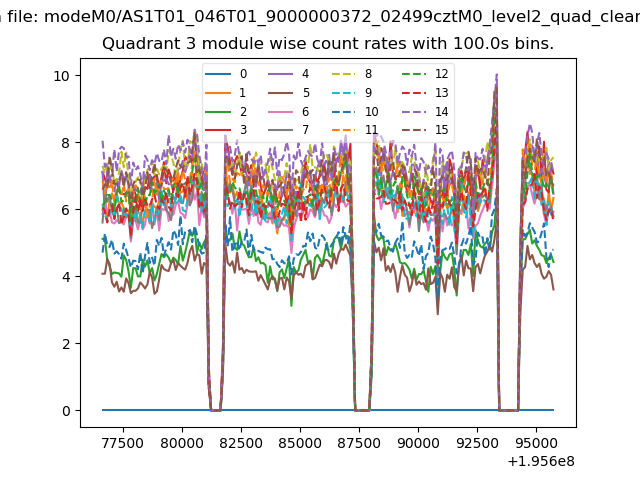
| Module-wise count rates for Quadrant A Data is divided into 100 sec bins |
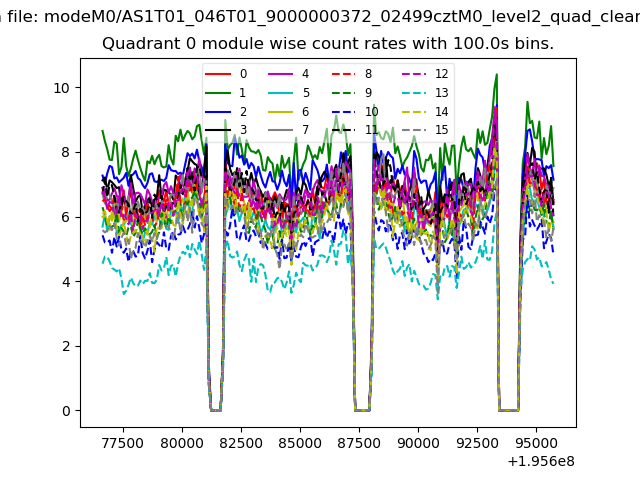 |
 |
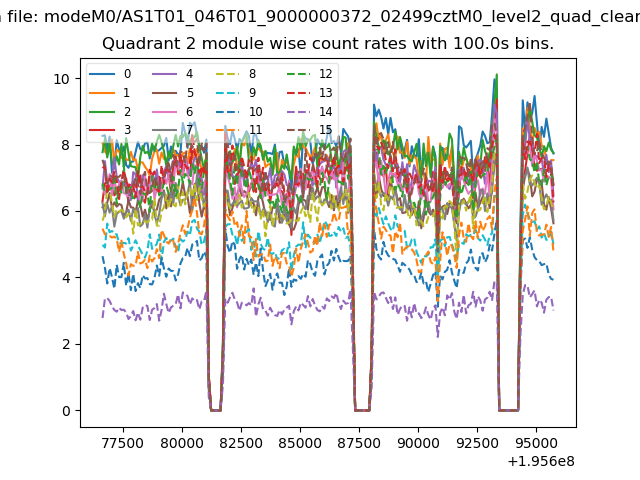
| Module-wise count rates for Quadrant B Data is divided into 100 sec bins |
 |
 |
| Module-wise count rates for Quadrant C Data is divided into 100 sec bins |
 |
 |
| Module-wise count rates for Quadrant D Data is divided into 100 sec bins |
 |
 |
| Parameter | Plot |
|---|---|
| CZT HV Monitor | 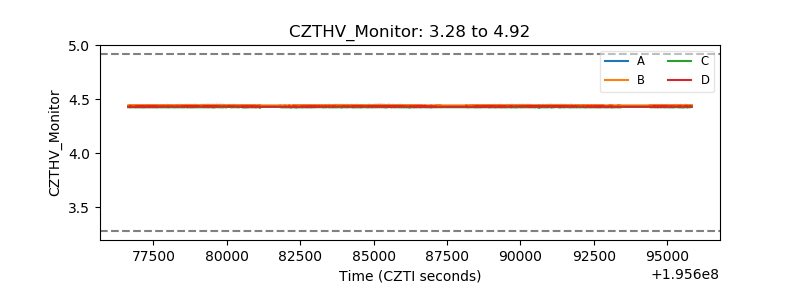 |
| D_VDD | 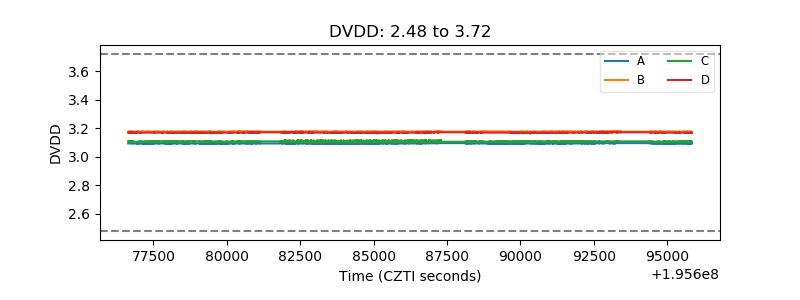 |
| Temperature 1 | 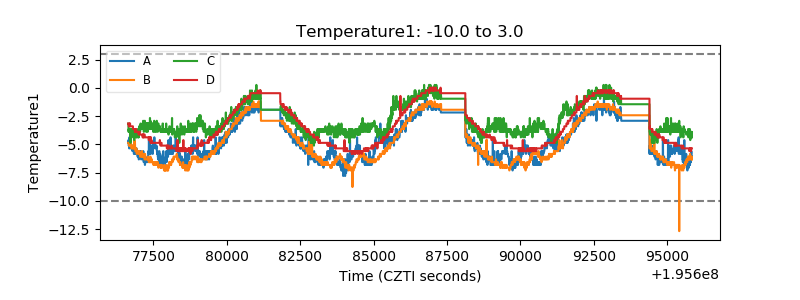 |
| Veto HV Monitor | 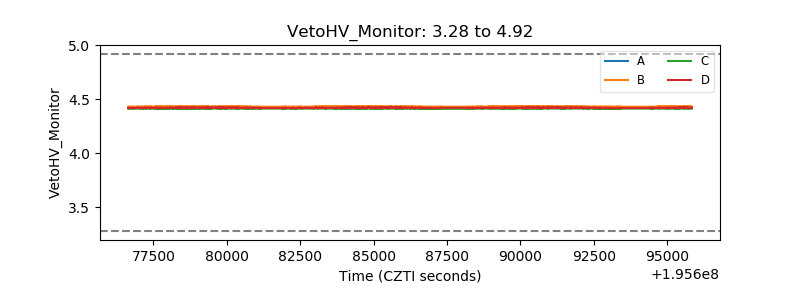 |
| Veto LLD | 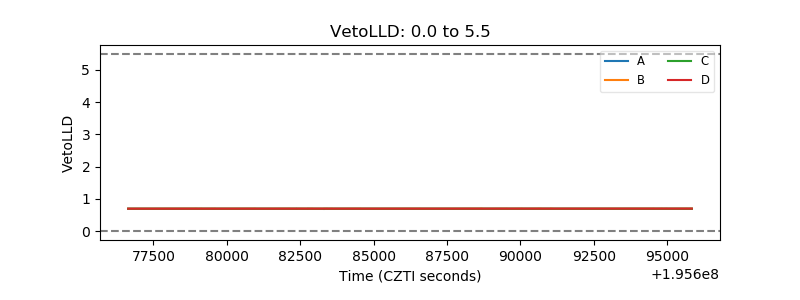 |
| Alpha Counter | 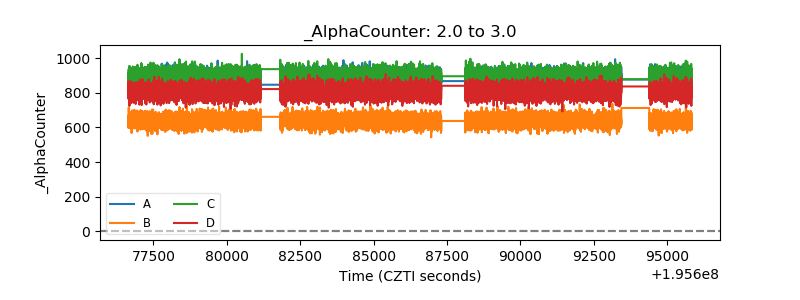 |
| _CPM_Rate | 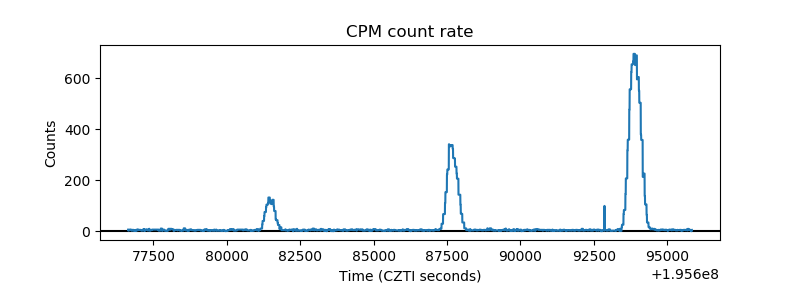 |
| CZT Counter | 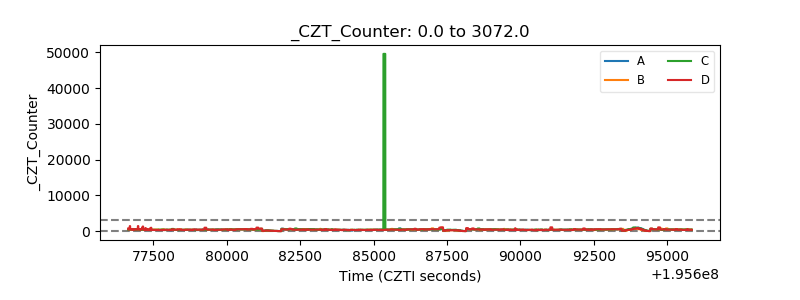 |
| +2.5 Volts monitor | 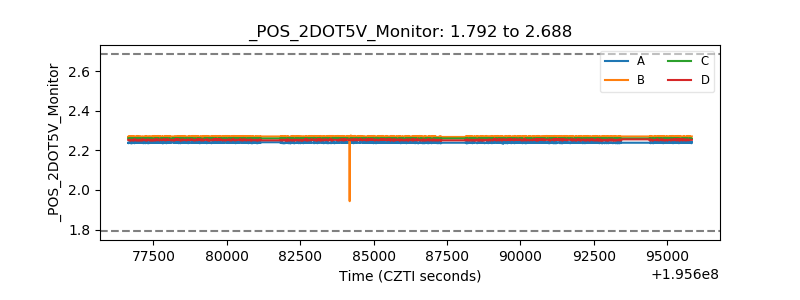 |
| +5 Volts monitor | 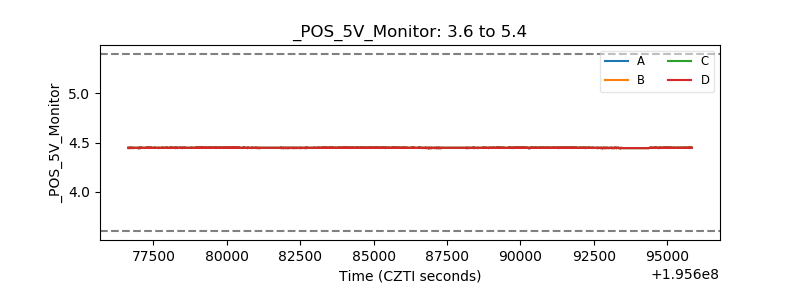 |
| _ROLL_ROT | 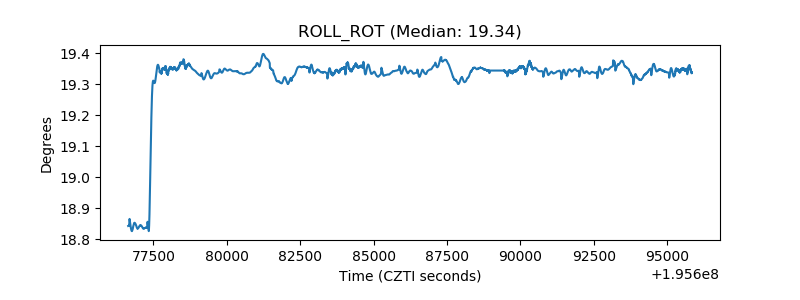 |
| _Roll_DEC | 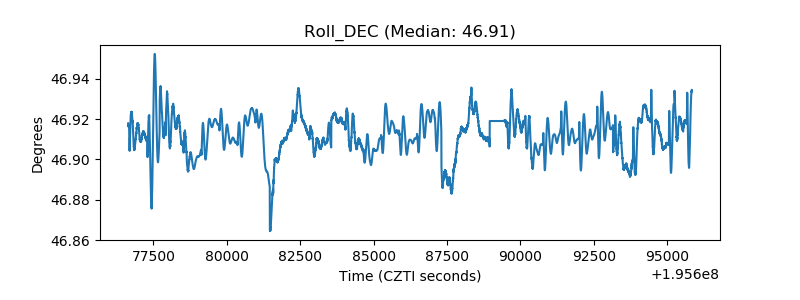 |
| _Roll_RA | 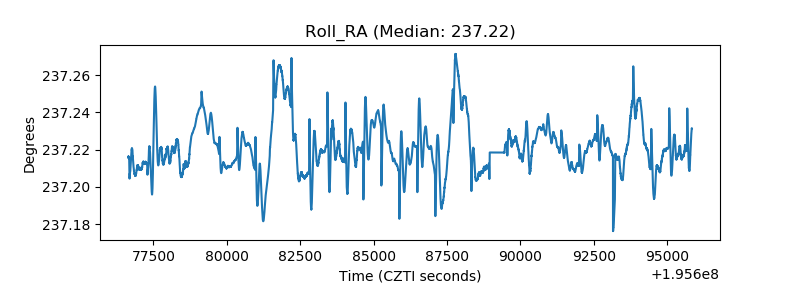 |
| Veto Counter | 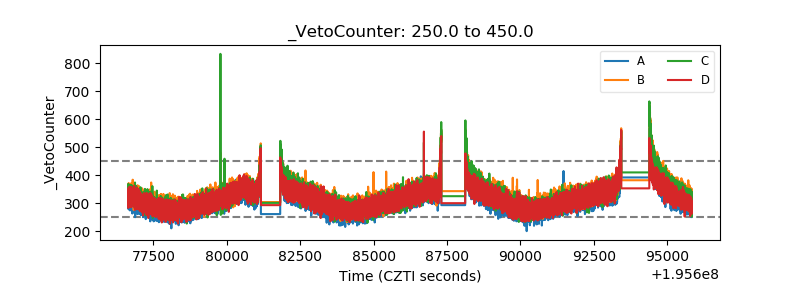 |