| Param | Original file | Final file |
|---|---|---|
| Filename | modeM0/AS1T01_046T01_9000000372_02501cztM0_level2.fits | modeM0/AS1T01_046T01_9000000372_02501cztM0_level2_quad_clean.evt |
| Size (bytes) | 340,894,080 | 109,872,000 |
| Size | 325.1 MB | 104.8 MB |
| Events in quadrant A | 2,869,384 | 729,583 |
| Events in quadrant B | 2,968,571 | 753,914 |
| Events in quadrant C | 2,920,894 | 721,204 |
| Events in quadrant D | 3,336,694 | 653,946 |
| Mode M0 | |||
|---|---|---|---|
| Quadrant | BADHDUFLAG | Total packets | Discarded packets |
| A | 0 | 13713 | 105 |
| B | 0 | 13874 | 109 |
| C | 0 | 13834 | 121 |
| D | 0 | 15398 | 114 |
| Mode M9 | |||
|---|---|---|---|
| Quadrant | BADHDUFLAG | Total packets | Discarded packets |
| A | 0 | 19 | 0 |
| B | 0 | 19 | 0 |
| C | 0 | 19 | 0 |
| D | 0 | 19 | 0 |
| Mode SS | |||
|---|---|---|---|
| Quadrant | BADHDUFLAG | Total packets | Discarded packets |
| A | 0 | 138 | 0 |
| B | 0 | 138 | 0 |
| C | 0 | 138 | 2 |
| D | 0 | 138 | 2 |
| Quadrant | Total seconds | Saturated seconds | Saturation percentage |
|---|---|---|---|
| A | 6714 | 16 | 0.238308% |
| B | 6711 | 26 | 0.387424% |
| C | 6706 | 20 | 0.298240% |
| D | 6710 | 167 | 2.488823% |
Noise dominated data is calculated using 1-second bins in cleaned event files. If a bin has >2000 counts, and if more than 50% of those come from <1% of pixels, then it is considered to be noise-dominated and hence unusable.
| Quadrant | # 1 sec bins | Bins with >0 counts | Bins with >2000 counts | High rate bins dominated by noise | Noise dominated (total time) | Noise dominated (detector-on time) | Marked lightcurve |
|---|---|---|---|---|---|---|---|
| A | 7841 | 6735 | 0 | 0 | 0.00% | 0.00% | 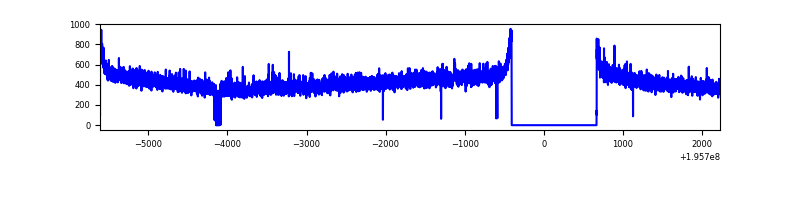 |
| B | 7841 | 6732 | 2 | 2 | 0.03% | 0.03% | 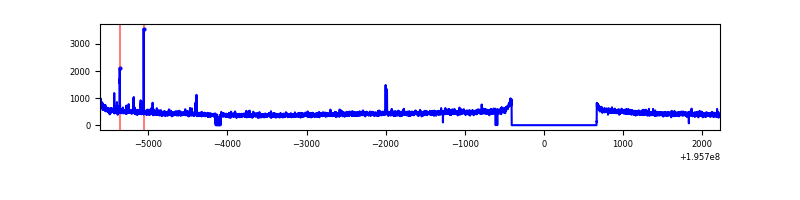 |
| C | 7841 | 6726 | 2 | 2 | 0.03% | 0.03% | 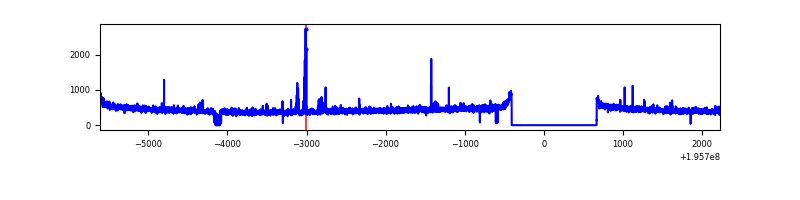 |
| D | 7841 | 6727 | 95 | 95 | 1.21% | 1.41% | 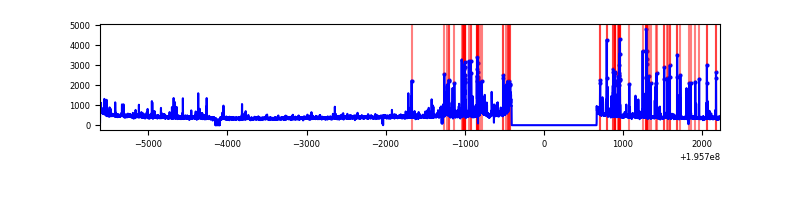 |
Top three noisy pixels from each quadrant. If the there are fewer than three noisy pixels in the level2.evt file, extra rows are filled as -1
| Pixel properties | Quadrant properties | ||||||
|---|---|---|---|---|---|---|---|
| Quadrant | DetID | PixID | Counts | Sigma | Mean | Median | Sigma |
| A | 8 | 15 | 11281 | 69.41 | 742 | 726 | 152.1 |
| A | 12 | 194 | 8408 | 50.52 | 742 | 726 | 152.1 |
| A | 0 | 226 | 7994 | 47.8 | 742 | 726 | 152.1 |
| B | 10 | 244 | 20012 | 132.84 | 760 | 742 | 145.1 |
| B | 12 | 111 | 10680 | 68.51 | 760 | 742 | 145.1 |
| B | 11 | 111 | 8940 | 56.51 | 760 | 742 | 145.1 |
| C | 14 | 223 | 36291 | 208.51 | 728 | 731 | 170.5 |
| C | 12 | 4 | 17387 | 97.66 | 728 | 731 | 170.5 |
| C | 10 | 82 | 13764 | 76.42 | 728 | 731 | 170.5 |
| D | 11 | 130 | 339785 | 2015.08 | 705 | 687 | 168.3 |
| D | 12 | 110 | 72087 | 424.29 | 705 | 687 | 168.3 |
| D | 13 | 53 | 66247 | 389.59 | 705 | 687 | 168.3 |
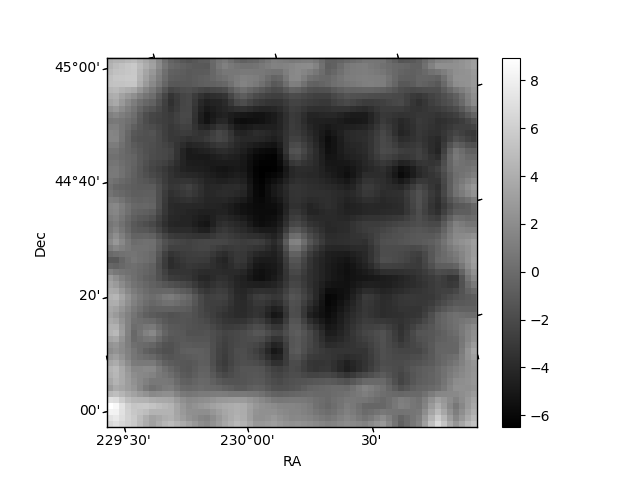
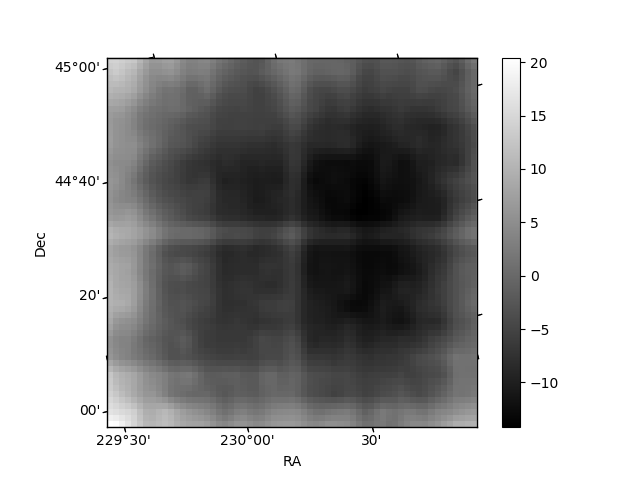
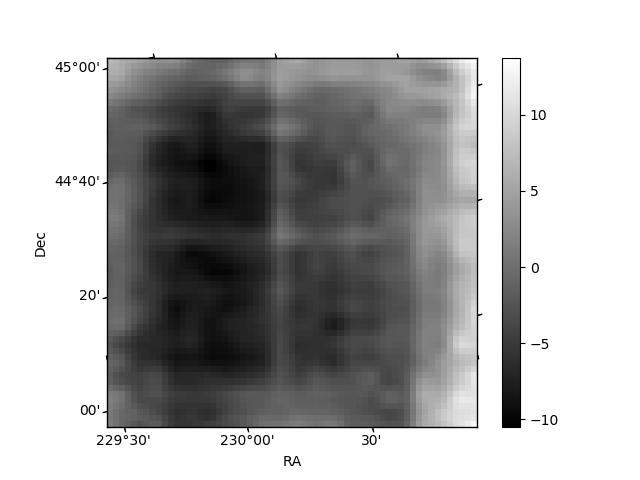
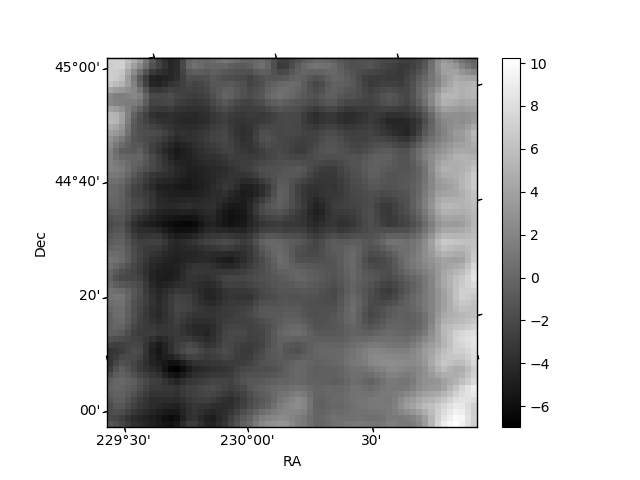
Histogram calculated using DETX and DETY for each event in the final _common_clean file
| Quadrant A | 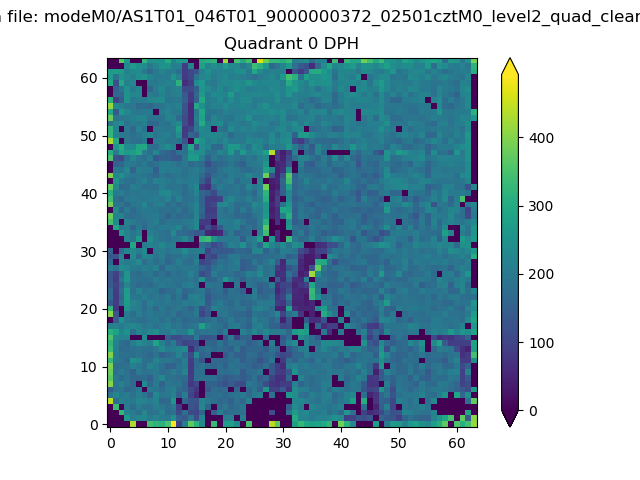 |
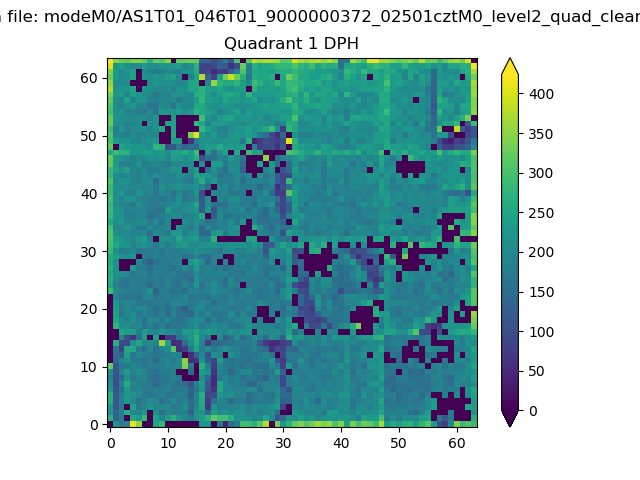 |
Quadrant B |
|---|---|---|---|
| Quadrant D | 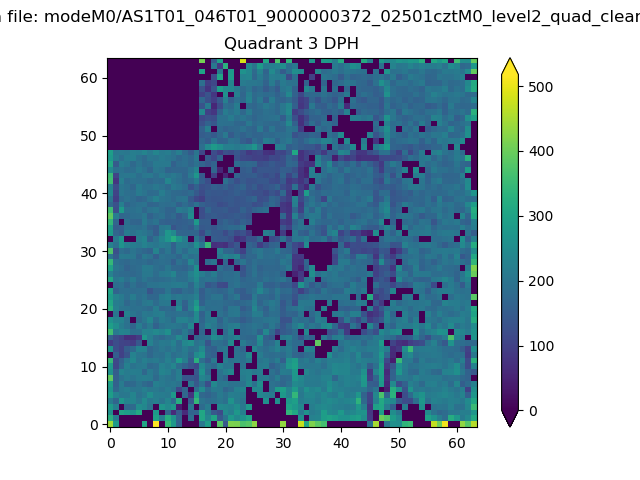 |
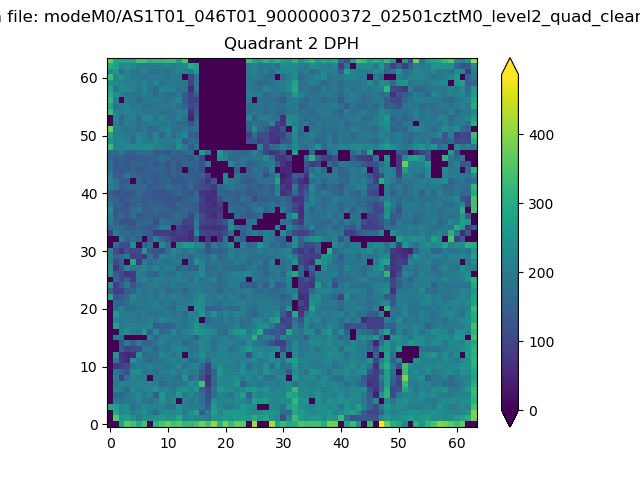 |
Quadrant C |
| Plot type | Count rate plots | Images |
|---|---|---|
| Comparison with Poisson distribution Blue bars denote a histogram of data divided into 1 sec bins. Red curve is a Poisson curve with rate = median count rate of data. |
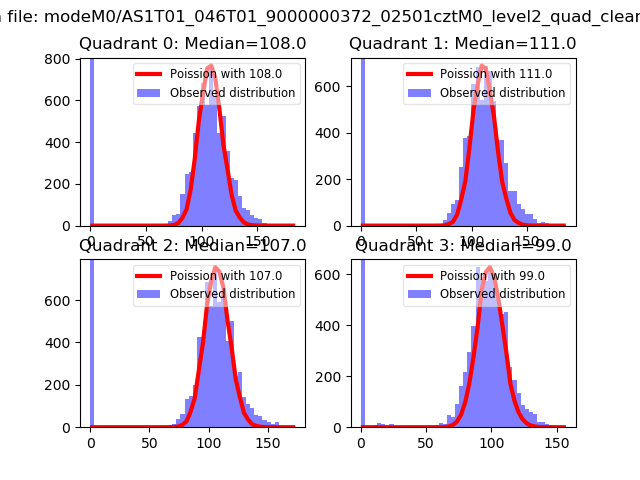 |
 |
| Quadrant-wise count rates Data is divided into 100 sec bins |
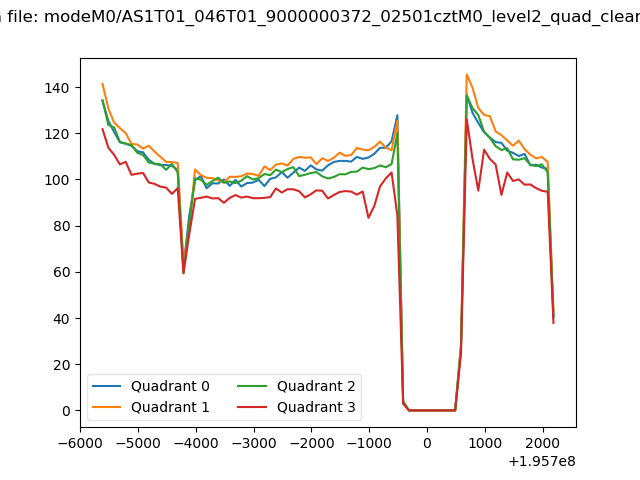 |
|
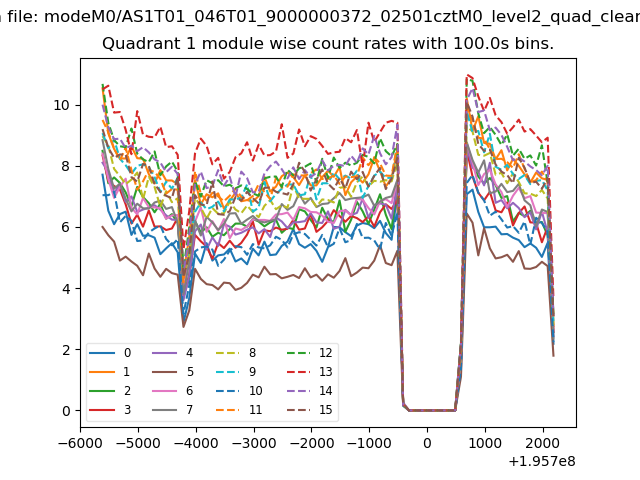
| Module-wise count rates for Quadrant A Data is divided into 100 sec bins |
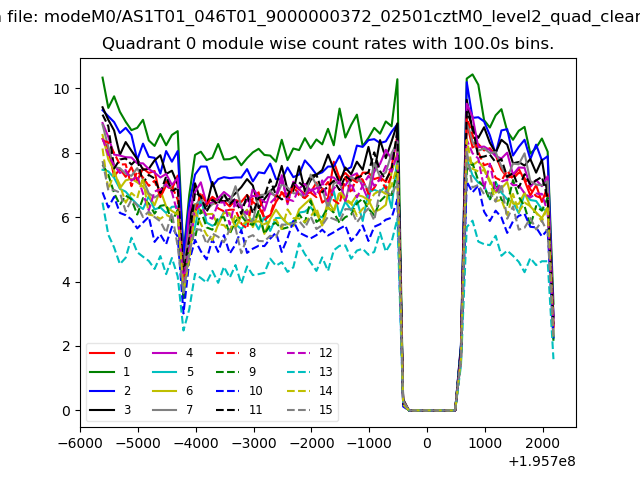 |
 |
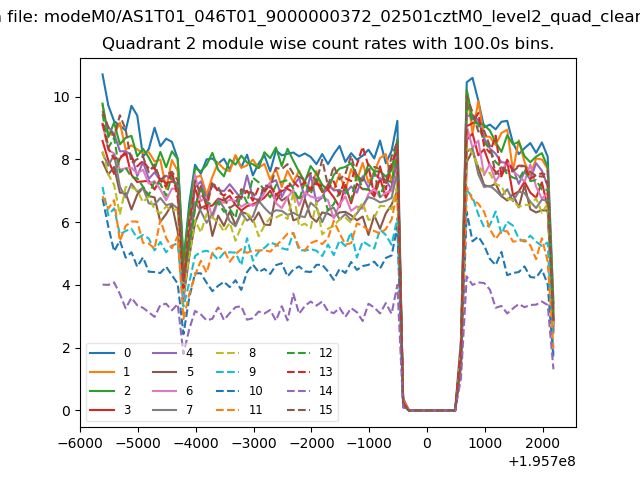
| Module-wise count rates for Quadrant B Data is divided into 100 sec bins |
 |
 |
| Module-wise count rates for Quadrant C Data is divided into 100 sec bins |
 |
 |
| Module-wise count rates for Quadrant D Data is divided into 100 sec bins |
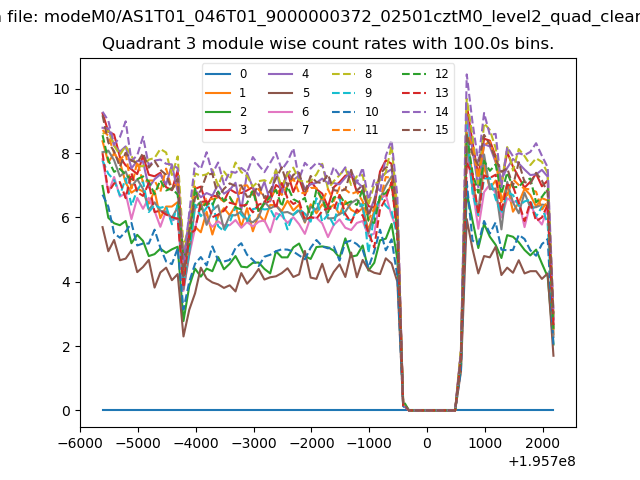 |
 |
| Parameter | Plot |
|---|---|
| CZT HV Monitor | 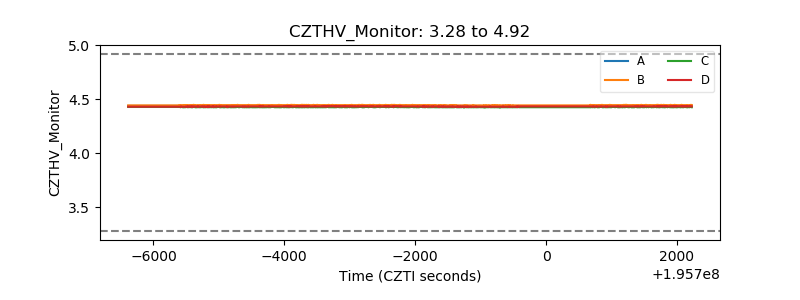 |
| D_VDD | 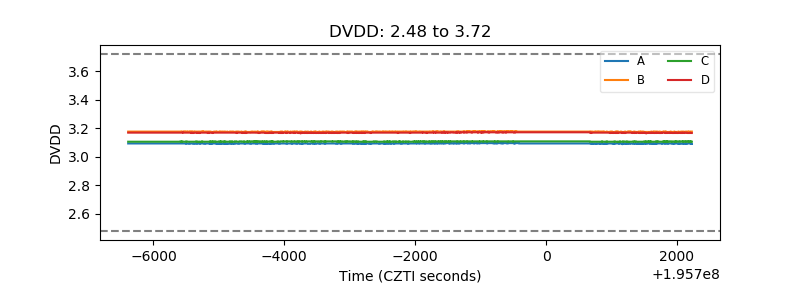 |
| Temperature 1 | 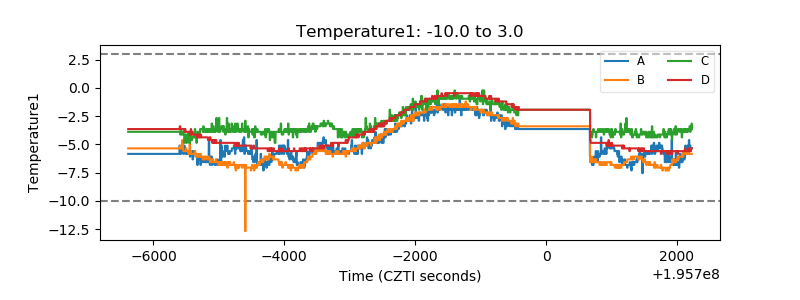 |
| Veto HV Monitor | 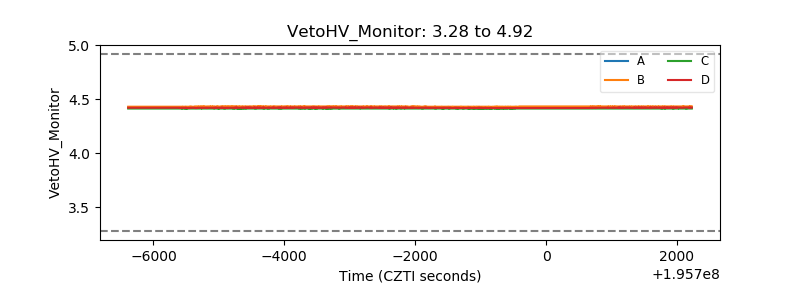 |
| Veto LLD | 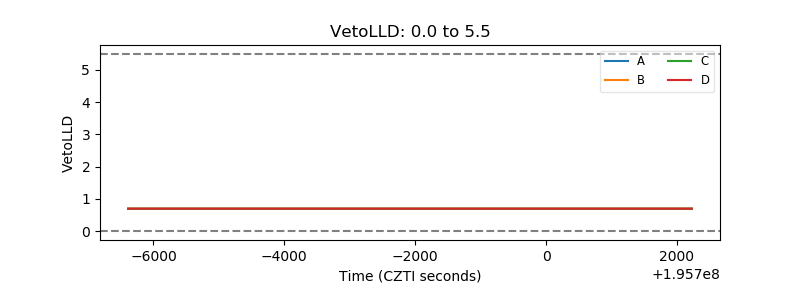 |
| Alpha Counter |  |
| _CPM_Rate | 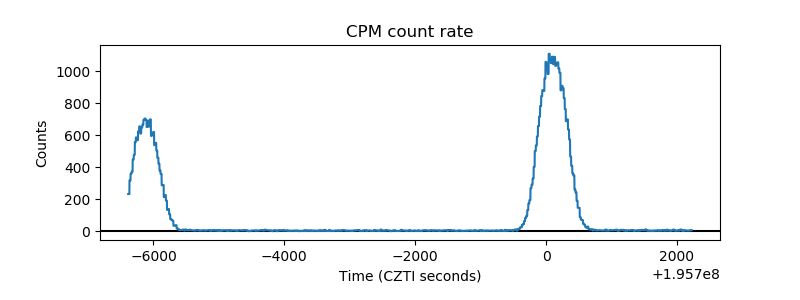 |
| CZT Counter | 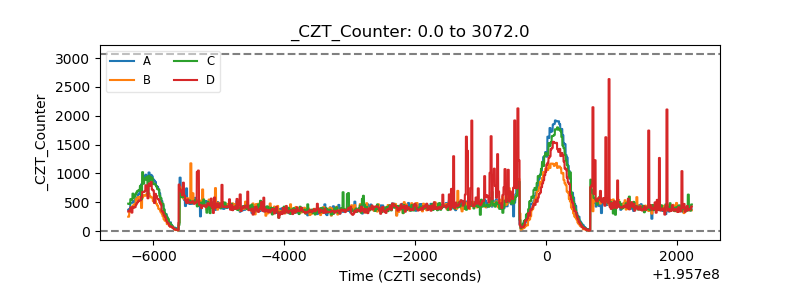 |
| +2.5 Volts monitor |  |
| +5 Volts monitor |  |
| _ROLL_ROT | 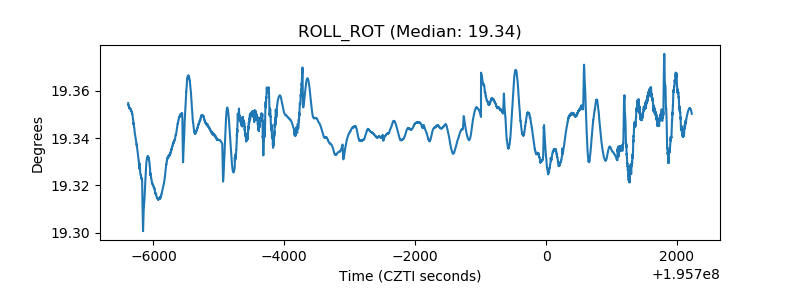 |
| _Roll_DEC | 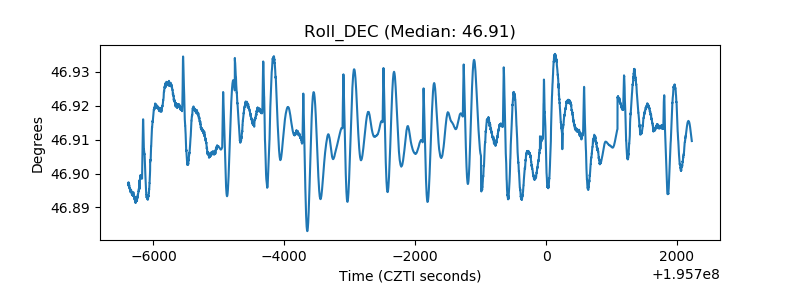 |
| _Roll_RA | 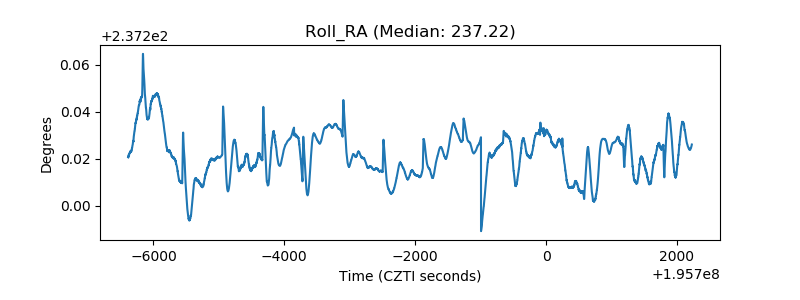 |
| Veto Counter | 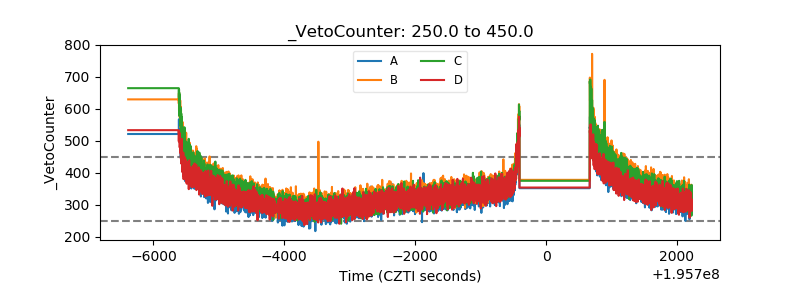 |