| Param | Original file | Final file |
|---|---|---|
| Filename | modeM0/AS1T01_046T01_9000000372_02503cztM0_level2.fits | modeM0/AS1T01_046T01_9000000372_02503cztM0_level2_quad_clean.evt |
| Size (bytes) | 205,511,040 | 67,049,280 |
| Size | 196.0 MB | 63.9 MB |
| Events in quadrant A | 1,782,471 | 444,066 |
| Events in quadrant B | 1,791,575 | 458,655 |
| Events in quadrant C | 1,876,001 | 435,690 |
| Events in quadrant D | 1,834,748 | 401,490 |
| Mode M0 | |||
|---|---|---|---|
| Quadrant | BADHDUFLAG | Total packets | Discarded packets |
| A | 0 | 8400 | 1 |
| B | 0 | 8392 | 1 |
| C | 0 | 8596 | 1 |
| D | 0 | 8714 | 1 |
| Mode M9 | |||
|---|---|---|---|
| Quadrant | BADHDUFLAG | Total packets | Discarded packets |
| A | 0 | 12 | 0 |
| B | 0 | 12 | 0 |
| C | 0 | 12 | 0 |
| D | 0 | 12 | 0 |
| Mode SS | |||
|---|---|---|---|
| Quadrant | BADHDUFLAG | Total packets | Discarded packets |
| A | 0 | 84 | 0 |
| B | 0 | 84 | 0 |
| C | 0 | 84 | 0 |
| D | 0 | 84 | 0 |
| Quadrant | Total seconds | Saturated seconds | Saturation percentage |
|---|---|---|---|
| A | 4118 | 8 | 0.194269% |
| B | 4118 | 17 | 0.412822% |
| C | 4118 | 4 | 0.097135% |
| D | 4118 | 21 | 0.509956% |
Noise dominated data is calculated using 1-second bins in cleaned event files. If a bin has >2000 counts, and if more than 50% of those come from <1% of pixels, then it is considered to be noise-dominated and hence unusable.
| Quadrant | # 1 sec bins | Bins with >0 counts | Bins with >2000 counts | High rate bins dominated by noise | Noise dominated (total time) | Noise dominated (detector-on time) | Marked lightcurve |
|---|---|---|---|---|---|---|---|
| A | 5298 | 4119 | 0 | 0 | 0.00% | 0.00% | 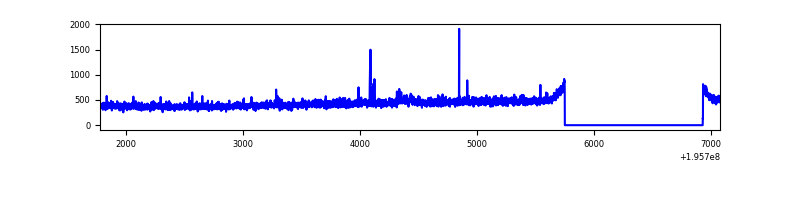 |
| B | 5298 | 4119 | 0 | 0 | 0.00% | 0.00% | 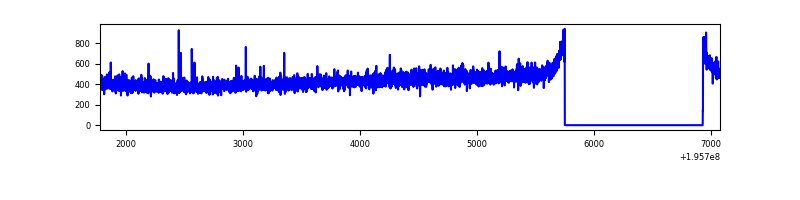 |
| C | 5298 | 4119 | 2 | 2 | 0.04% | 0.05% | 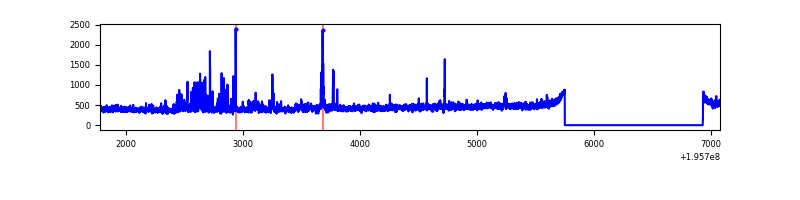 |
| D | 5298 | 4119 | 14 | 14 | 0.26% | 0.34% | 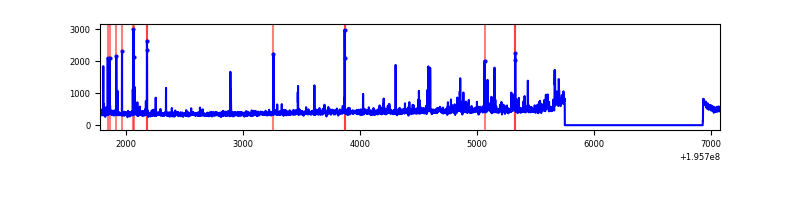 |
Top three noisy pixels from each quadrant. If the there are fewer than three noisy pixels in the level2.evt file, extra rows are filled as -1
| Pixel properties | Quadrant properties | ||||||
|---|---|---|---|---|---|---|---|
| Quadrant | DetID | PixID | Counts | Sigma | Mean | Median | Sigma |
| A | 15 | 236 | 17261 | 176.15 | 457 | 446 | 95.5 |
| A | 12 | 194 | 5109 | 48.85 | 457 | 446 | 95.5 |
| A | 0 | 226 | 4971 | 47.4 | 457 | 446 | 95.5 |
| B | 12 | 111 | 6364 | 65.68 | 462 | 451 | 90.0 |
| B | 11 | 111 | 5472 | 55.77 | 462 | 451 | 90.0 |
| B | 8 | 61 | 4743 | 47.68 | 462 | 451 | 90.0 |
| C | 14 | 223 | 92572 | 890.0 | 440 | 440 | 103.5 |
| C | 10 | 65 | 33337 | 317.79 | 440 | 440 | 103.5 |
| C | 12 | 4 | 14733 | 138.07 | 440 | 440 | 103.5 |
| D | 2 | 184 | 57797 | 545.31 | 436 | 425 | 105.2 |
| D | 11 | 130 | 34363 | 322.57 | 436 | 425 | 105.2 |
| D | 5 | 172 | 28688 | 268.63 | 436 | 425 | 105.2 |
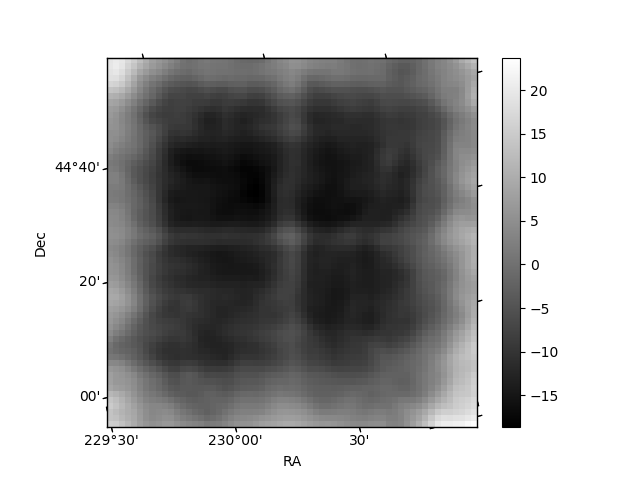
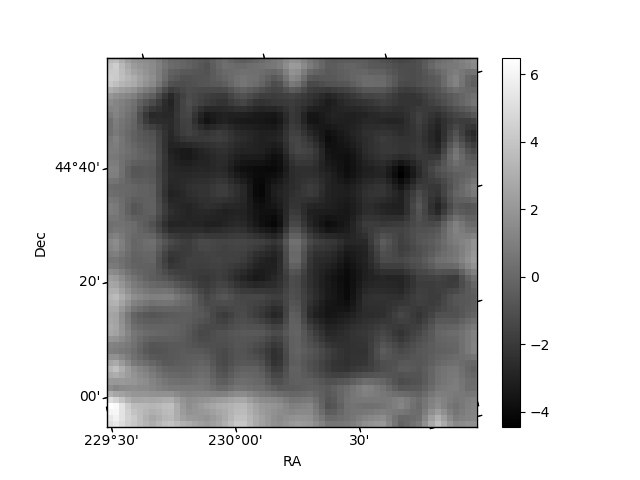
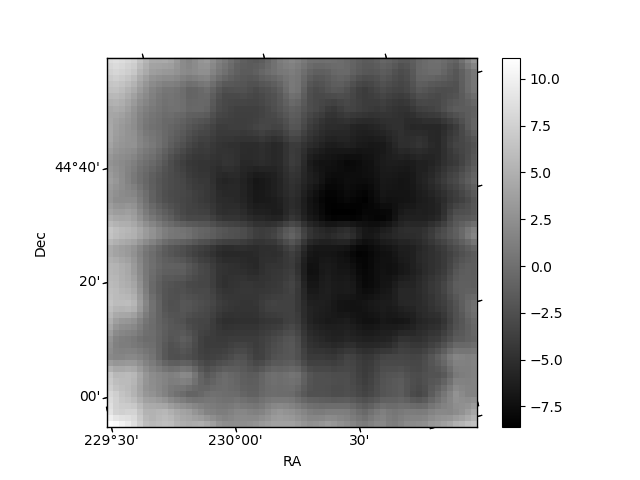
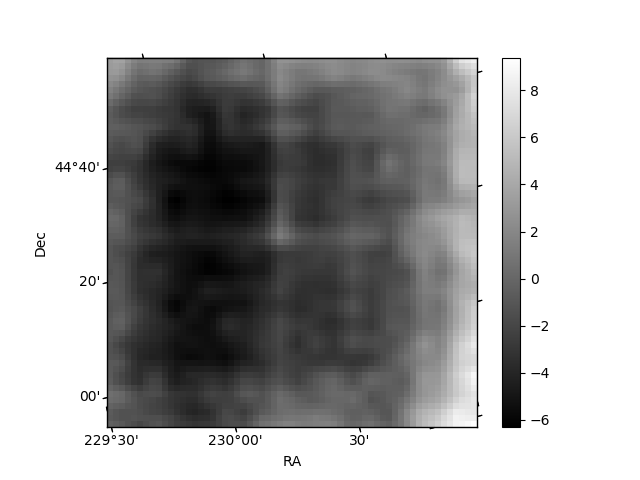
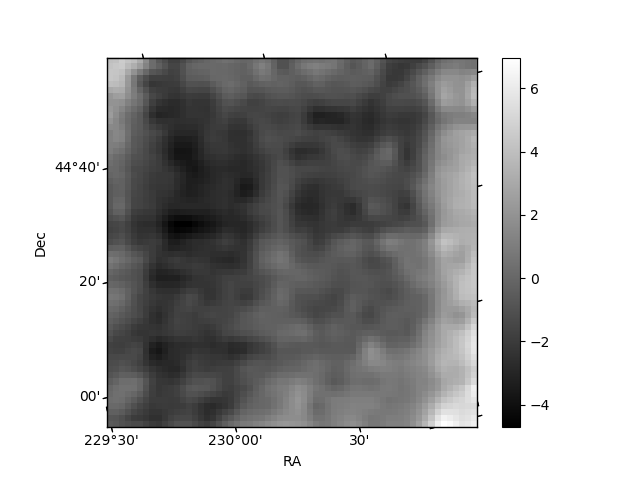
Histogram calculated using DETX and DETY for each event in the final _common_clean file
| Quadrant A | 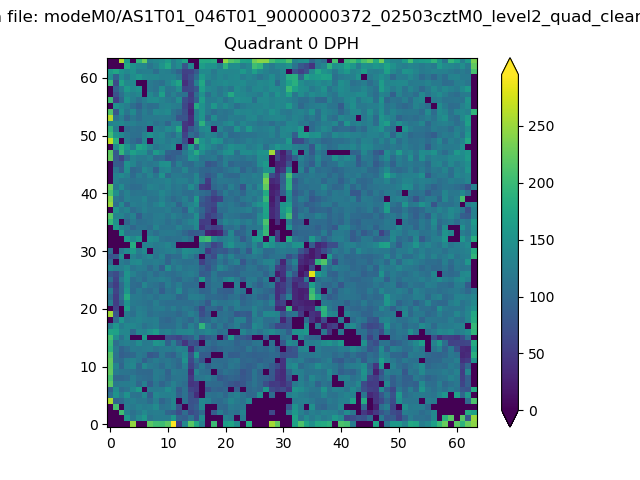 |
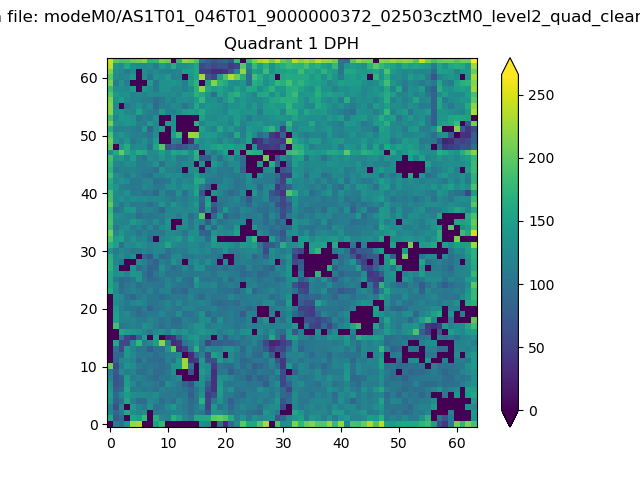 |
Quadrant B |
|---|---|---|---|
| Quadrant D | 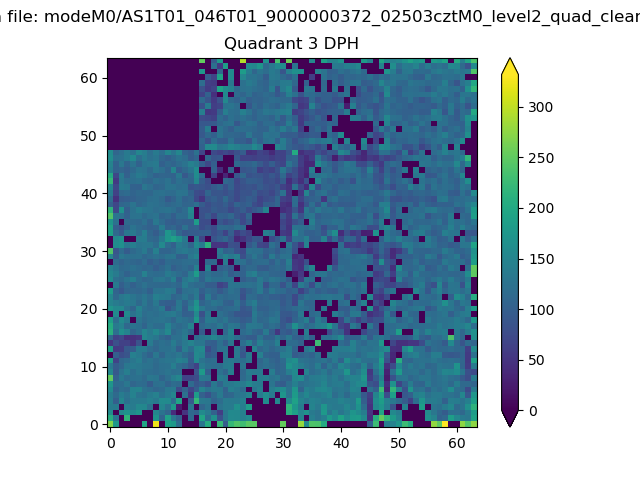 |
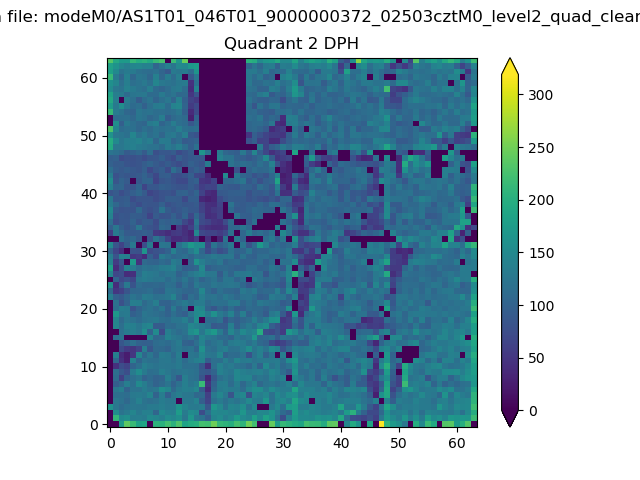 |
Quadrant C |
| Plot type | Count rate plots | Images |
|---|---|---|
| Comparison with Poisson distribution Blue bars denote a histogram of data divided into 1 sec bins. Red curve is a Poisson curve with rate = median count rate of data. |
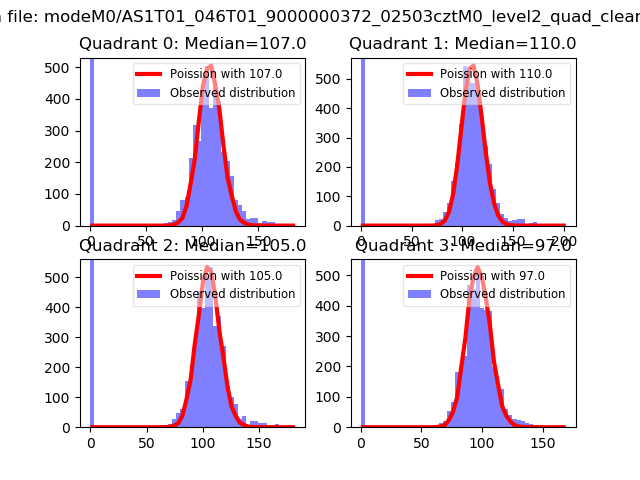 |
 |
| Quadrant-wise count rates Data is divided into 100 sec bins |
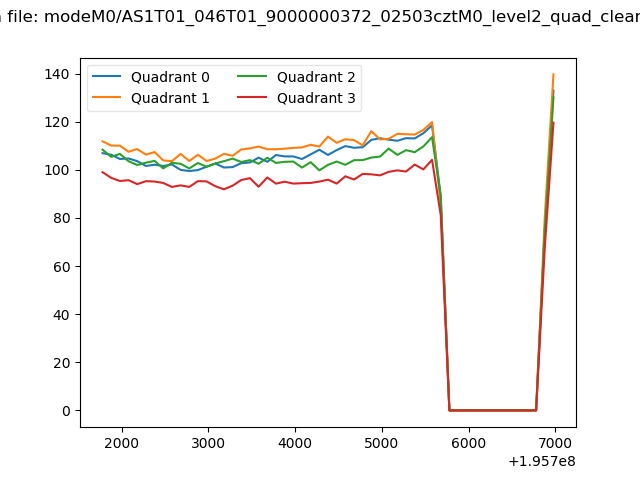 |
|
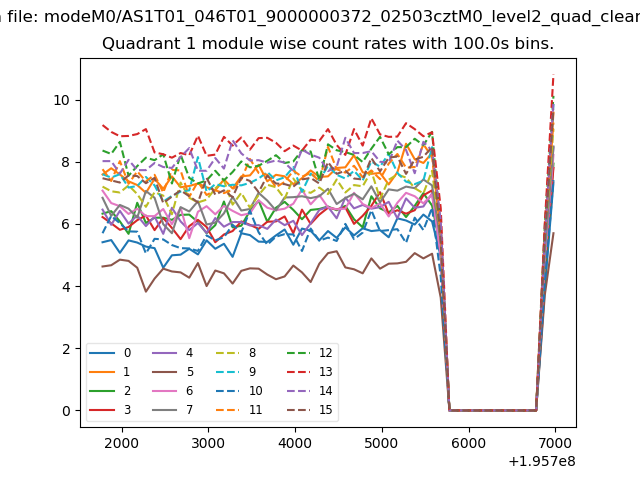
| Module-wise count rates for Quadrant A Data is divided into 100 sec bins |
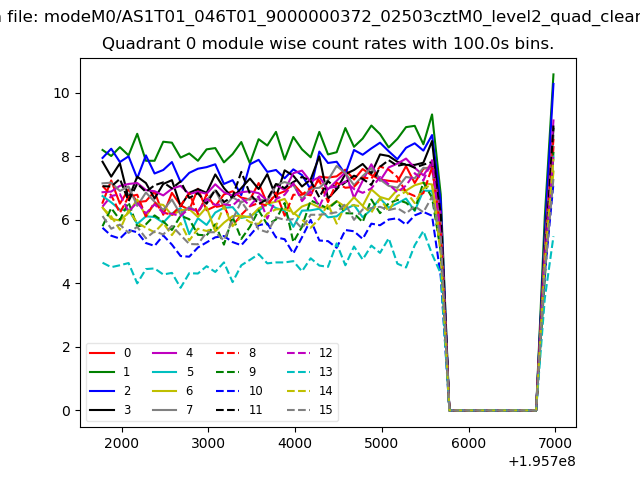 |
 |
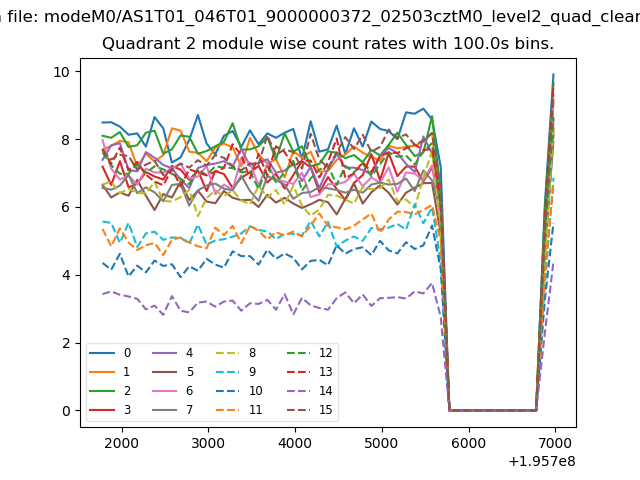
| Module-wise count rates for Quadrant B Data is divided into 100 sec bins |
 |
 |
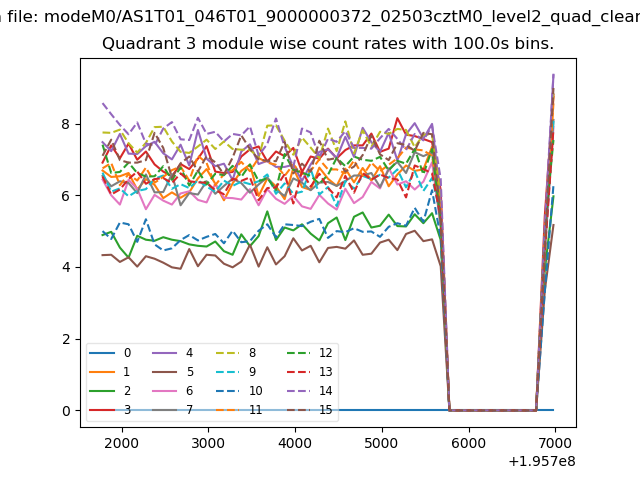
| Module-wise count rates for Quadrant C Data is divided into 100 sec bins |
 |
 |
| Module-wise count rates for Quadrant D Data is divided into 100 sec bins |
 |
 |
| Parameter | Plot |
|---|---|
| CZT HV Monitor | 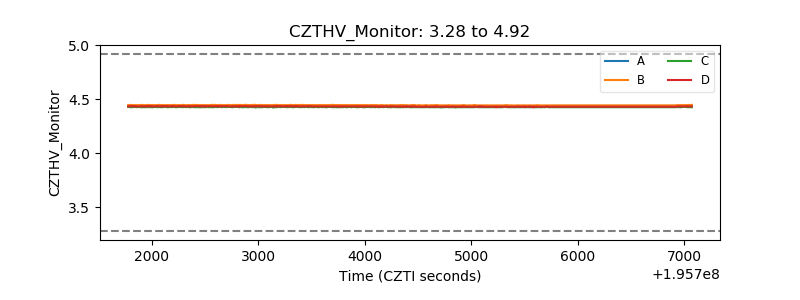 |
| D_VDD | 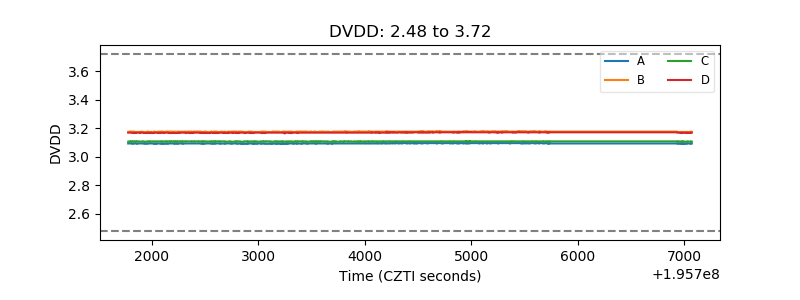 |
| Temperature 1 | 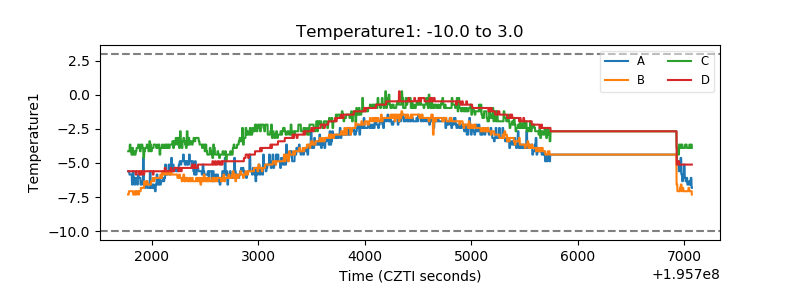 |
| Veto HV Monitor | 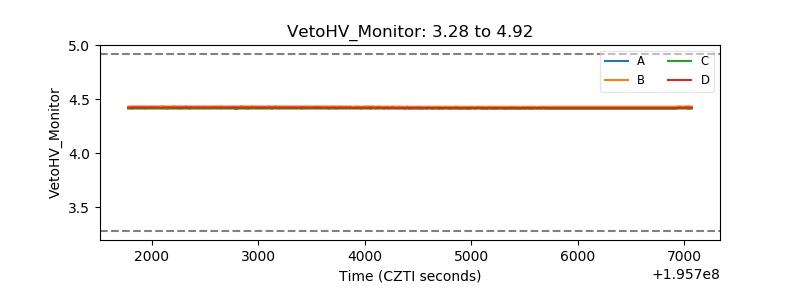 |
| Veto LLD | 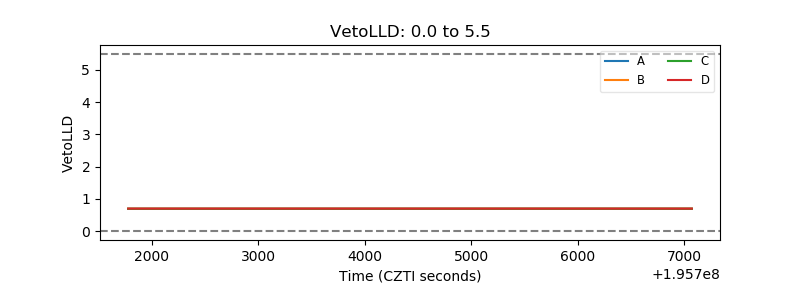 |
| Alpha Counter | 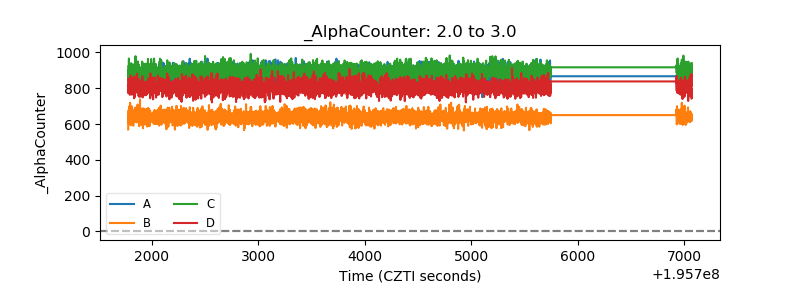 |
| _CPM_Rate | 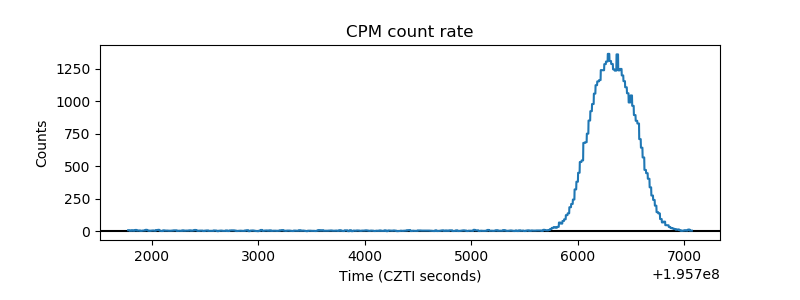 |
| CZT Counter | 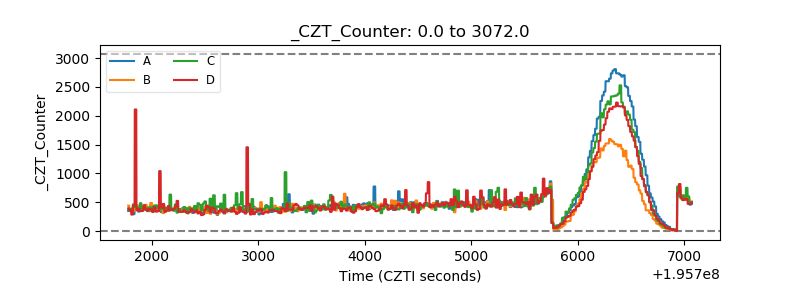 |
| +2.5 Volts monitor | 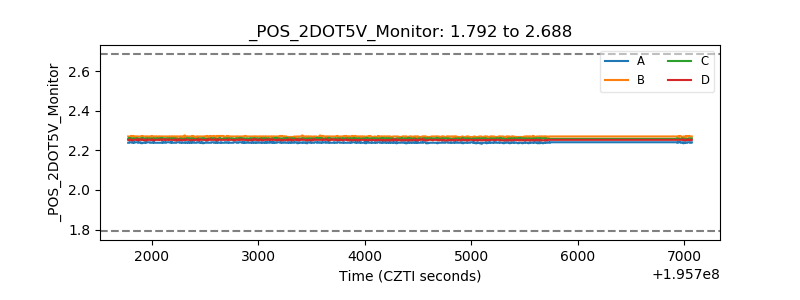 |
| +5 Volts monitor |  |
| _ROLL_ROT | 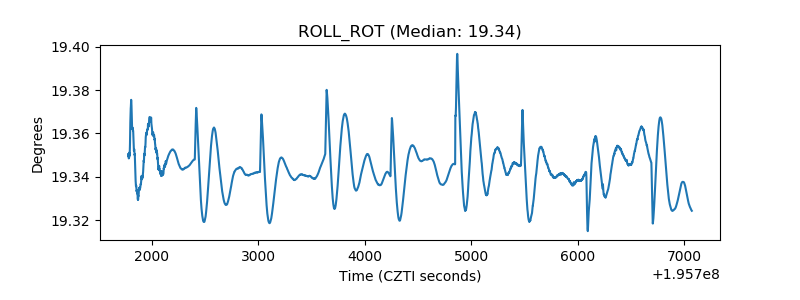 |
| _Roll_DEC | 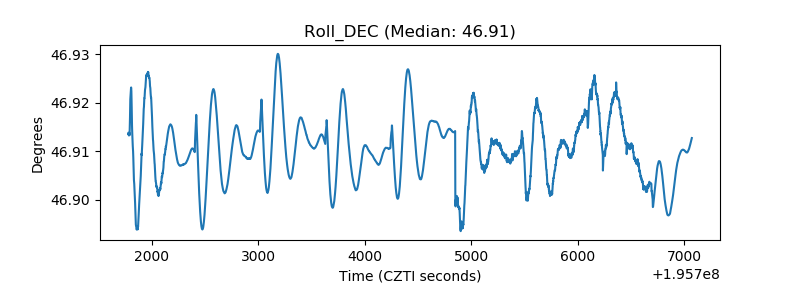 |
| _Roll_RA | 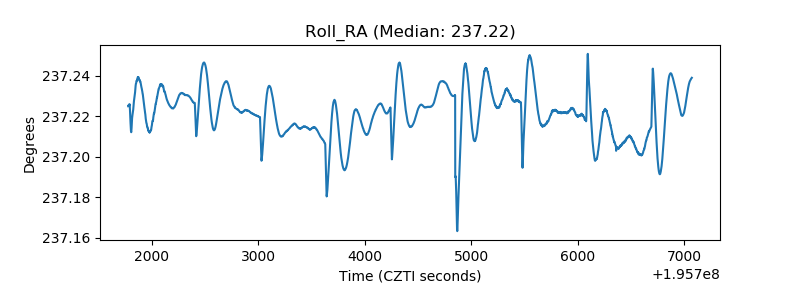 |
| Veto Counter | 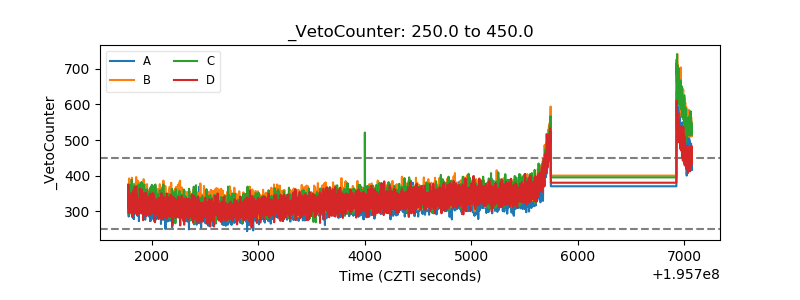 |