| Param | Original file | Final file |
|---|---|---|
| Filename | modeM0/AS1T01_103T01_9000000374cztM0_level2.fits | modeM0/AS1T01_103T01_9000000374cztM0_level2_quad_clean.evt |
| Size (bytes) | 1,069,430,400 | 1,120,867,200 |
| Size | 1019.9 MB | 1.0 GB |
| Events in quadrant A | 6,367,416 | 6,740,546 |
| Events in quadrant B | 6,213,166 | 6,766,741 |
| Events in quadrant C | 6,263,214 | 6,451,642 |
| Events in quadrant D | 5,153,986 | 5,603,184 |
| Mode SS | |||
|---|---|---|---|
| Quadrant | BADHDUFLAG | Total packets | Discarded packets |
| A | 0 | 2490 | 0 |
| B | 0 | 2490 | 0 |
| C | 0 | 2490 | 0 |
| D | 0 | 2490 | 0 |
| Mode M9 | |||
|---|---|---|---|
| Quadrant | BADHDUFLAG | Total packets | Discarded packets |
| A | 0 | 161 | 0 |
| B | 0 | 161 | 0 |
| C | 0 | 161 | 0 |
| D | 0 | 161 | 0 |
| Mode M0 | |||
|---|---|---|---|
| Quadrant | BADHDUFLAG | Total packets | Discarded packets |
| A | 0 | 252841 | 0 |
| B | 0 | 255746 | 0 |
| C | 0 | 254919 | 0 |
| D | 0 | 314766 | 0 |
| Quadrant | Total seconds | Saturated seconds | Saturation percentage |
|---|---|---|---|
| A | 122343 | 1816 | 1.484351% |
| B | 122344 | 2130 | 1.740993% |
| C | 122343 | 1699 | 1.388719% |
| D | 122344 | 8414 | 6.877329% |
Noise dominated data is calculated using 1-second bins in cleaned event files. If a bin has >2000 counts, and if more than 50% of those come from <1% of pixels, then it is considered to be noise-dominated and hence unusable.
| Quadrant | # 1 sec bins | Bins with >0 counts | Bins with >2000 counts | High rate bins dominated by noise | Noise dominated (total time) | Noise dominated (detector-on time) | Marked lightcurve |
|---|---|---|---|---|---|---|---|
| A | 142742 | 122349 | 0 | 0 | 0.00% | 0.00% |  |
| B | 142742 | 122346 | 0 | 0 | 0.00% | 0.00% |  |
| C | 142742 | 122345 | 0 | 0 | 0.00% | 0.00% |  |
| D | 142742 | 121569 | 0 | 0 | 0.00% | 0.00% |  |
Top three noisy pixels from each quadrant. If the there are fewer than three noisy pixels in the level2.evt file, extra rows are filled as -1
| Pixel properties | Quadrant properties | ||||||
|---|---|---|---|---|---|---|---|
| Quadrant | DetID | PixID | Counts | Sigma | Mean | Median | Sigma |
| A | 0 | 29 | 5980 | 10.27 | 1655 | 1533 | 433.2 |
| A | 7 | 110 | 5604 | 9.4 | 1655 | 1533 | 433.2 |
| A | 9 | 19 | 4643 | 7.18 | 1655 | 1533 | 433.2 |
| B | 2 | 9 | 5506 | 12.3 | 1637 | 1552 | 321.4 |
| B | 12 | 226 | 4676 | 9.72 | 1637 | 1552 | 321.4 |
| B | 14 | 254 | 4373 | 8.78 | 1637 | 1552 | 321.4 |
| C | 12 | 241 | 4598 | 6.86 | 1657 | 1517 | 449.0 |
| C | 7 | 111 | 4408 | 6.44 | 1657 | 1517 | 449.0 |
| C | 1 | 80 | 4206 | 5.99 | 1657 | 1517 | 449.0 |
| D | 3 | 14 | 4020 | 6.57 | 1471 | 1329 | 409.6 |
| D | 6 | 231 | 3793 | 6.02 | 1471 | 1329 | 409.6 |
| D | 7 | 5 | 3782 | 5.99 | 1471 | 1329 | 409.6 |
Histogram calculated using DETX and DETY for each event in the final _common_clean file
| Quadrant A | 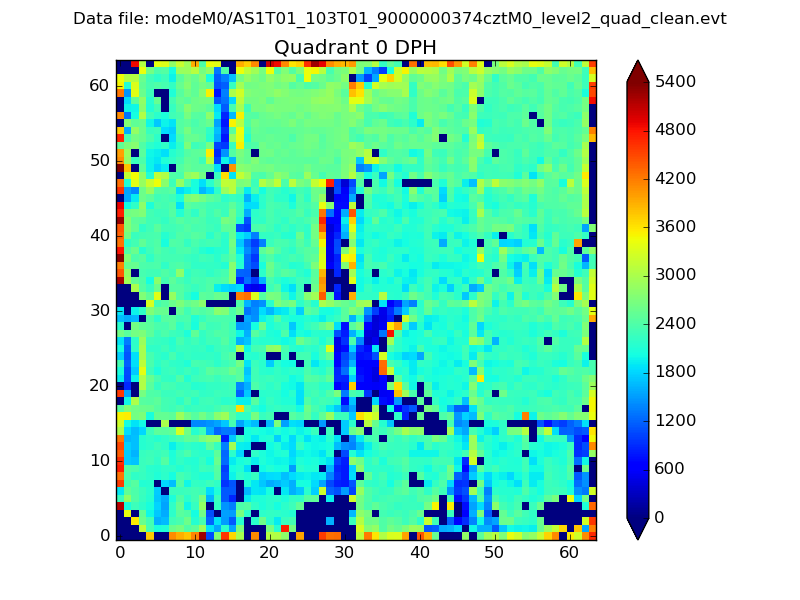 |
 |
Quadrant B |
|---|---|---|---|
| Quadrant D |  |
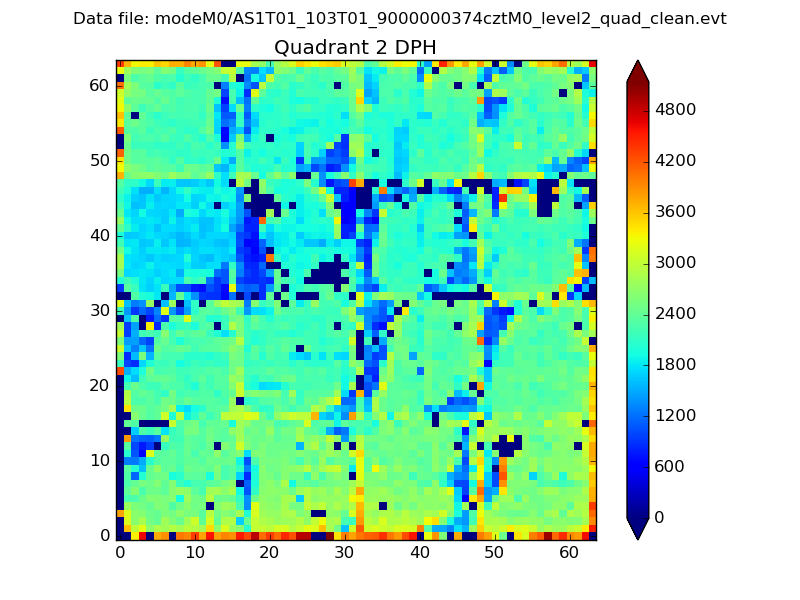 |
Quadrant C |
| Plot type | Count rate plots | Images |
|---|---|---|
| Comparison with Poisson distribution Blue bars denote a histogram of data divided into 1 sec bins. Red curve is a Poisson curve with rate = median count rate of data. |
 |
 |
| Quadrant-wise count rates Data is divided into 100 sec bins |
 |
|
| Module-wise count rates for Quadrant A Data is divided into 100 sec bins |
 |
 |
| Module-wise count rates for Quadrant B Data is divided into 100 sec bins |
 |
 |
| Module-wise count rates for Quadrant C Data is divided into 100 sec bins |
 |
 |
| Module-wise count rates for Quadrant D Data is divided into 100 sec bins |
 |
 |
| Parameter | Plot |
|---|---|
| CZT HV Monitor |  |
| D_VDD |  |
| Temperature 1 |  |
| Veto HV Monitor |  |
| Veto LLD |  |
| Alpha Counter |  |
| _CPM_Rate |  |
| CZT Counter |  |
| +2.5 Volts monitor |  |
| +5 Volts monitor |  |
| _ROLL_ROT |  |
| _Roll_DEC |  |
| _Roll_RA |  |
| Veto Counter |  |