| Param | Original file | Final file |
|---|---|---|
| Filename | modeM0/AS1T01_103T01_9000000374_02509cztM0_level2.evt | modeM0/AS1T01_103T01_9000000374_02509cztM0_level2_quad_clean.evt |
| Size (bytes) | 511,660,800 | 76,723,200 |
| Size | 488.0 MB | 73.2 MB |
| Events in quadrant A | 3,610,659 | 452,473 |
| Events in quadrant B | 3,508,101 | 454,153 |
| Events in quadrant C | 3,559,388 | 445,904 |
| Events in quadrant D | 4,295,709 | 435,962 |
| Mode SS | |||
|---|---|---|---|
| Quadrant | BADHDUFLAG | Total packets | Discarded packets |
| A | 0 | 156 | 0 |
| B | 0 | 156 | 0 |
| C | 0 | 156 | 0 |
| D | 0 | 156 | 0 |
| Mode M0 | |||
|---|---|---|---|
| Quadrant | BADHDUFLAG | Total packets | Discarded packets |
| A | 0 | 16263 | 2 |
| B | 0 | 15914 | 1 |
| C | 0 | 15910 | 1 |
| D | 0 | 18055 | 4 |
| Quadrant | Total seconds | Saturated seconds | Saturation percentage |
|---|---|---|---|
| A | 7678 | 115 | 1.497786% |
| B | 7678 | 146 | 1.901537% |
| C | 7678 | 125 | 1.628028% |
| D | 7677 | 105 | 1.367722% |
Noise dominated data is calculated using 1-second bins in cleaned event files. If a bin has >2000 counts, and if more than 50% of those come from <1% of pixels, then it is considered to be noise-dominated and hence unusable.
| Quadrant | # 1 sec bins | Bins with >0 counts | Bins with >2000 counts | High rate bins dominated by noise | Noise dominated (total time) | Noise dominated (detector-on time) | Marked lightcurve |
|---|---|---|---|---|---|---|---|
| A | 7745 | 7680 | 0 | 0 | 0.00% | 0.00% | 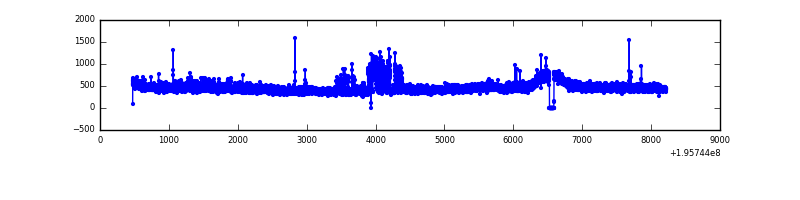 |
| B | 7745 | 7680 | 2 | 2 | 0.03% | 0.03% | 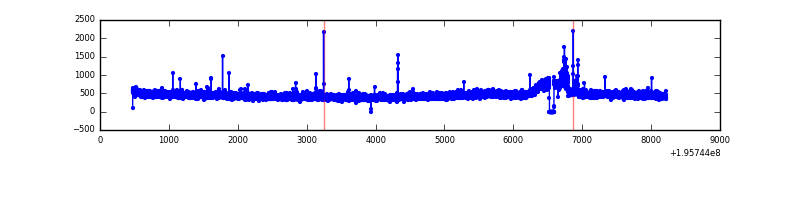 |
| C | 7745 | 7680 | 0 | 0 | 0.00% | 0.00% | 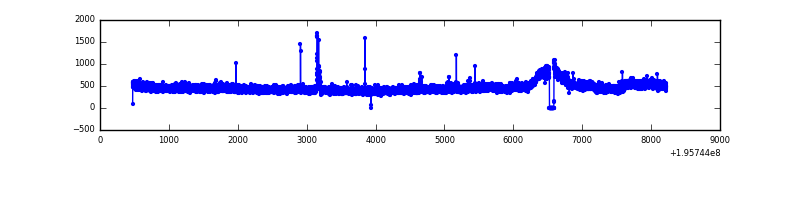 |
| D | 7744 | 7679 | 9 | 9 | 0.12% | 0.12% | 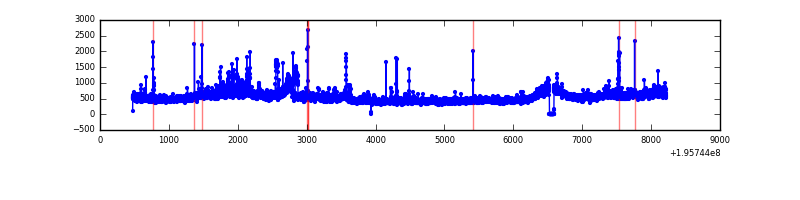 |
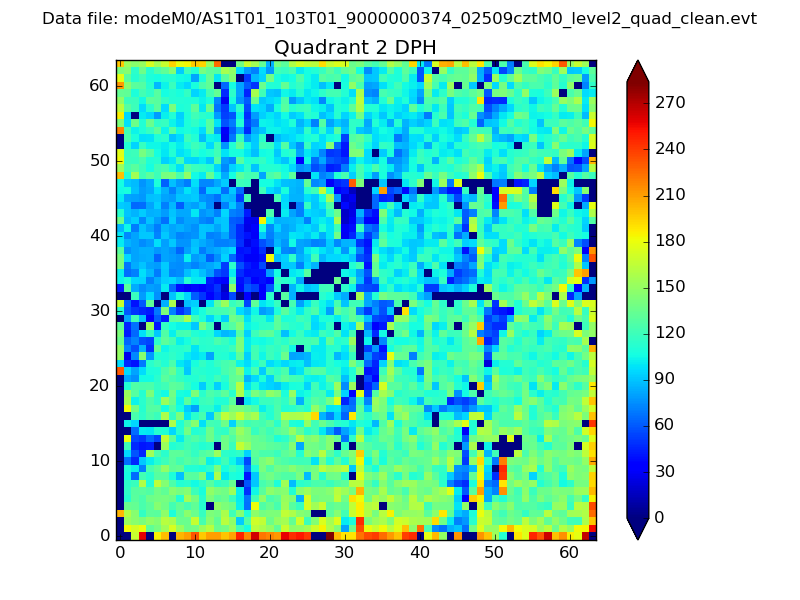
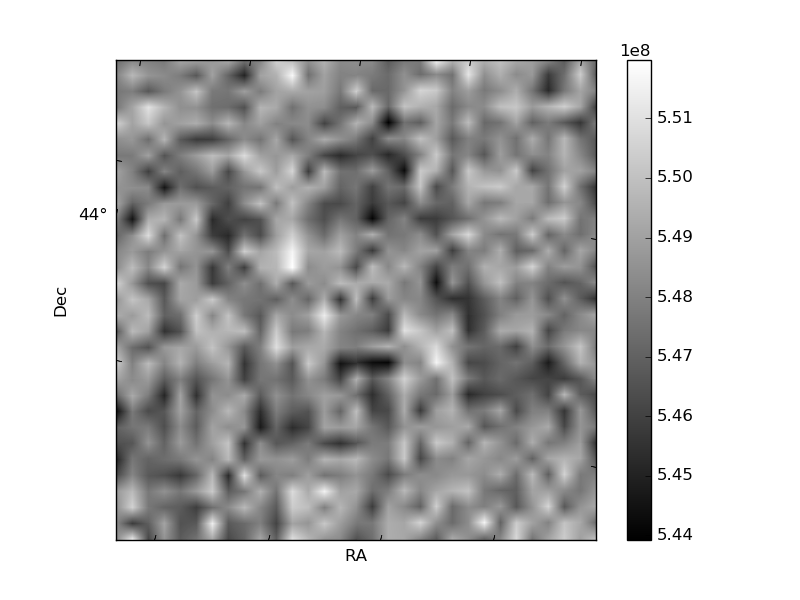
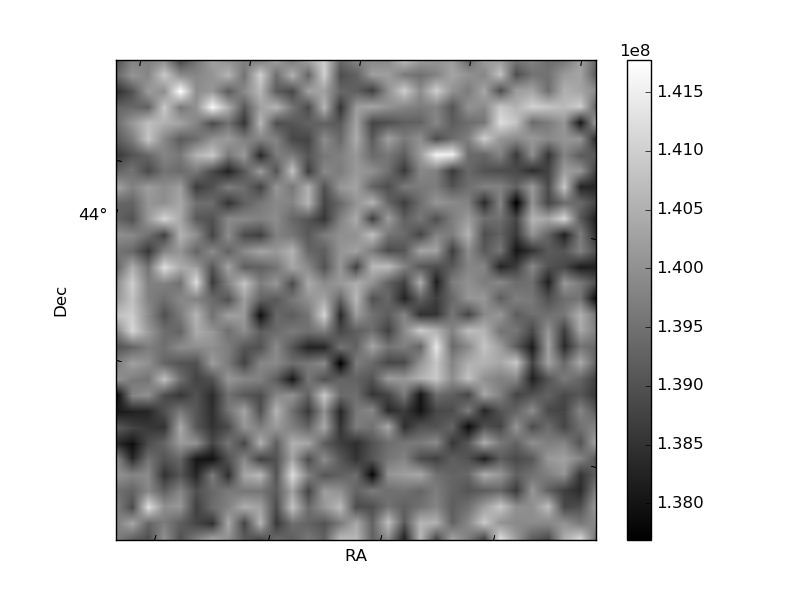
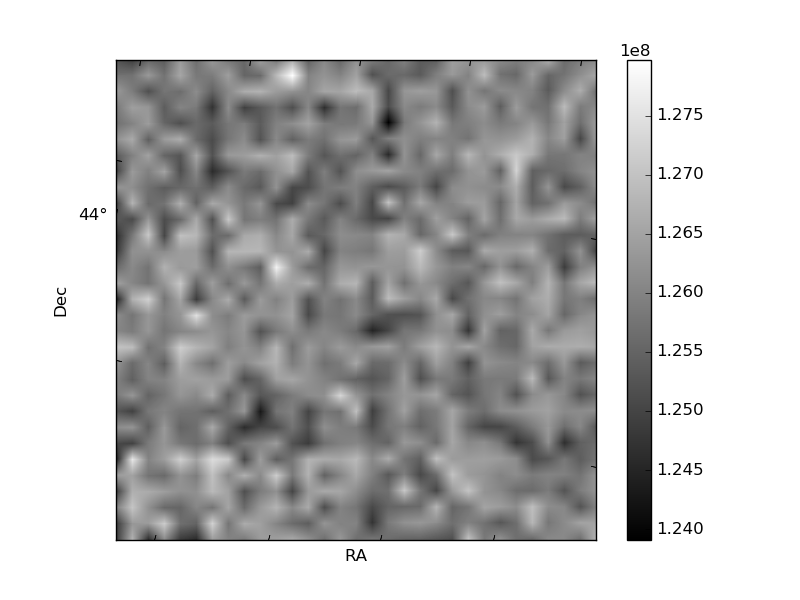
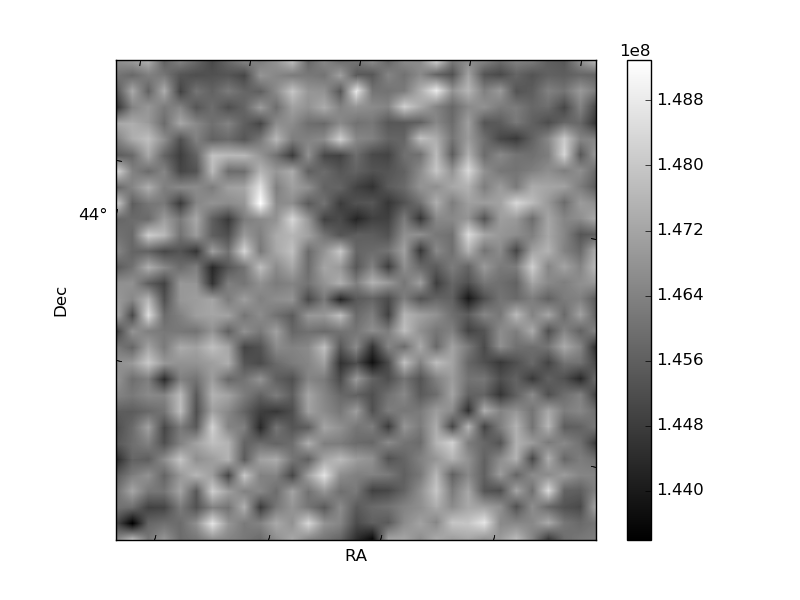
Histogram calculated using DETX and DETY for each event in the final _common_clean file
| Quadrant A | 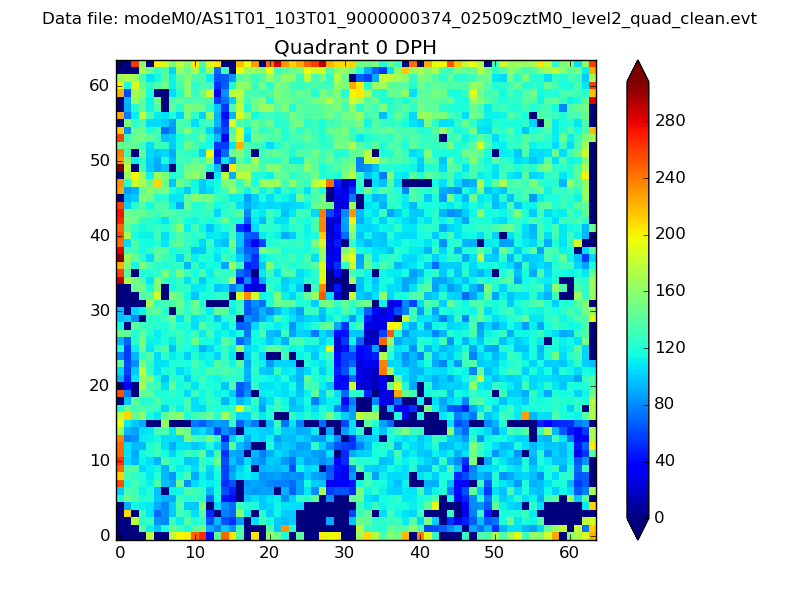 |
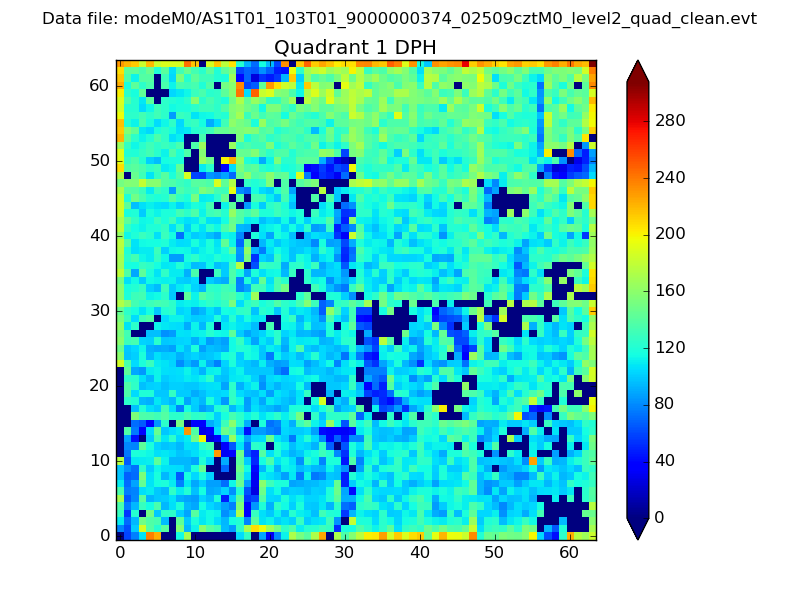 |
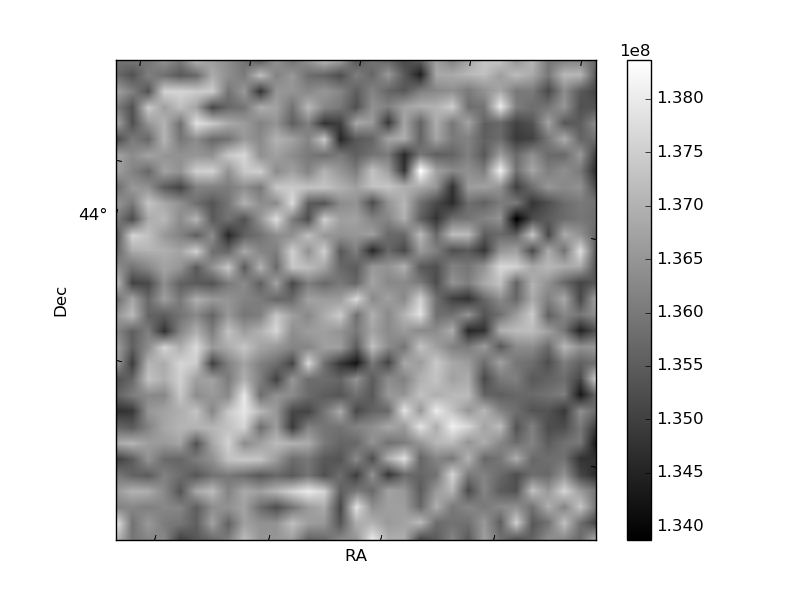
Quadrant B |
|---|---|---|---|
| Quadrant D | 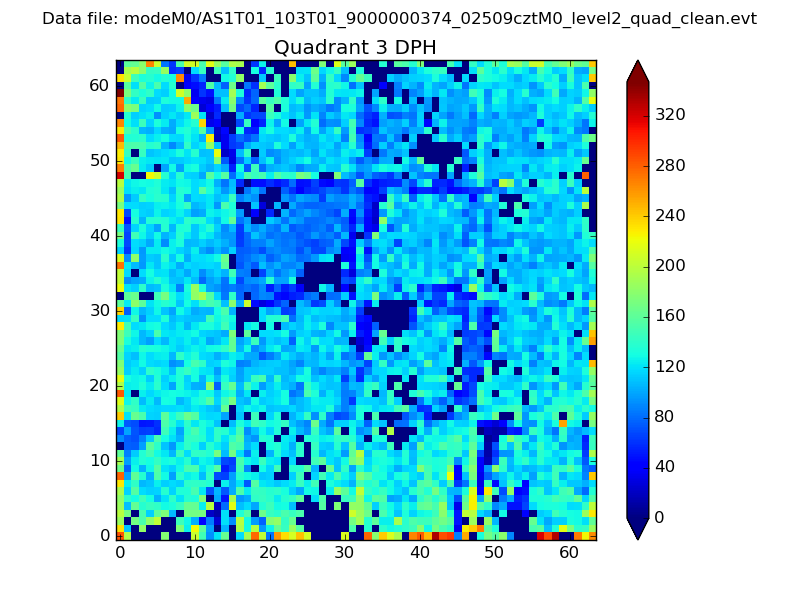 |
 |
Quadrant C |
| Plot type | Count rate plots | Images |
|---|---|---|
| Comparison with Poisson distribution Blue bars denote a histogram of data divided into 1 sec bins. Red curve is a Poisson curve with rate = median count rate of data. |
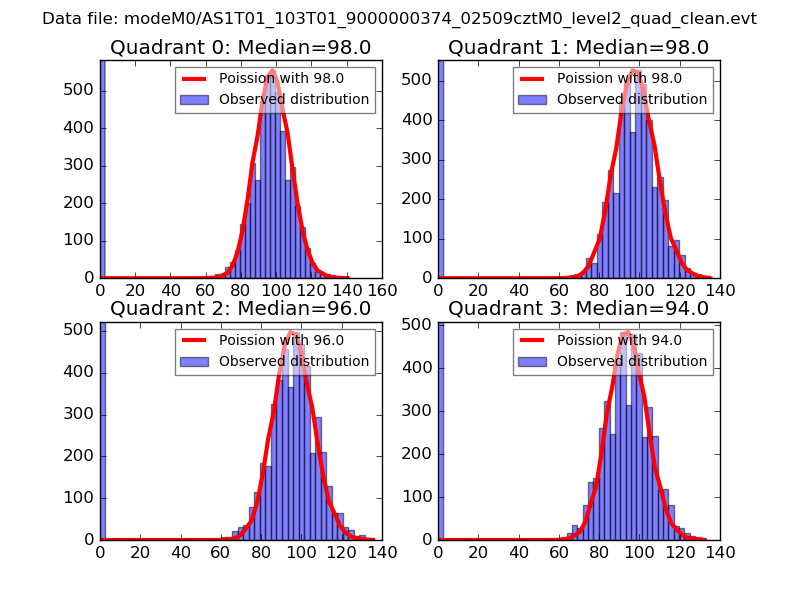 |
 |
| Quadrant-wise count rates Data is divided into 100 sec bins |
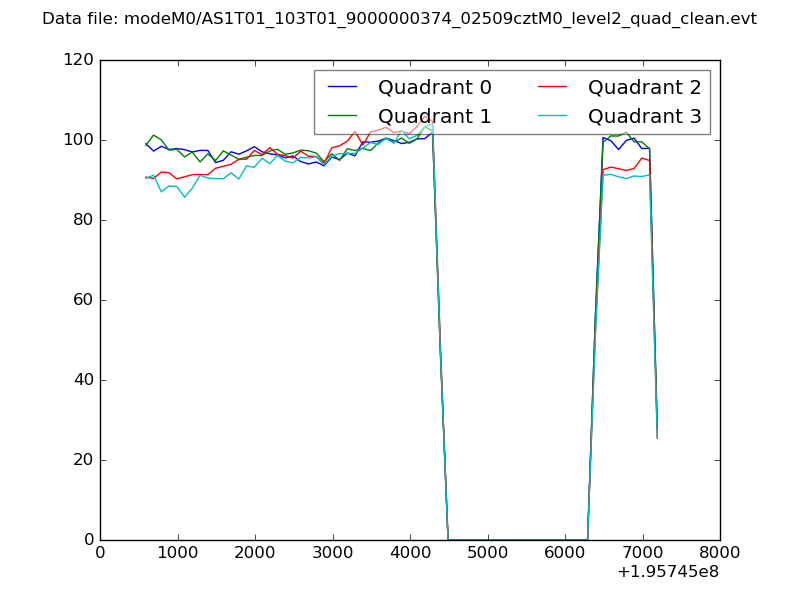 |
|
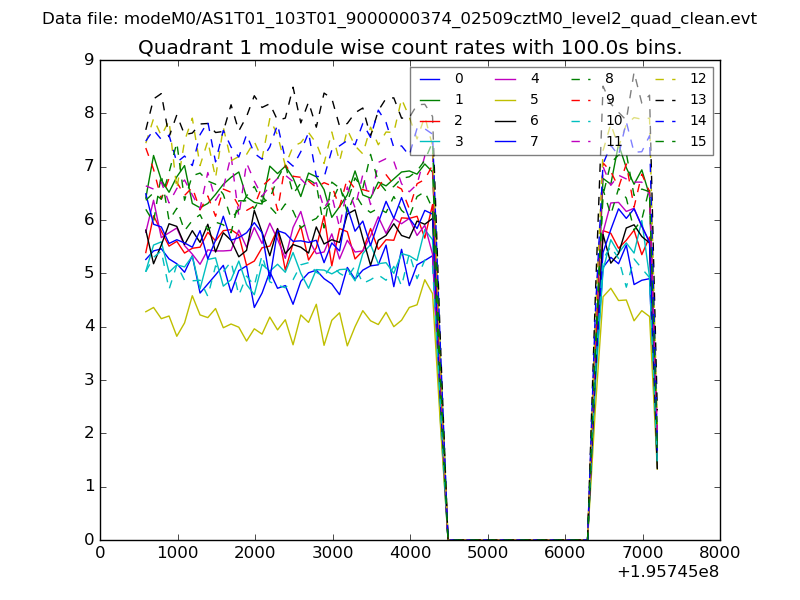
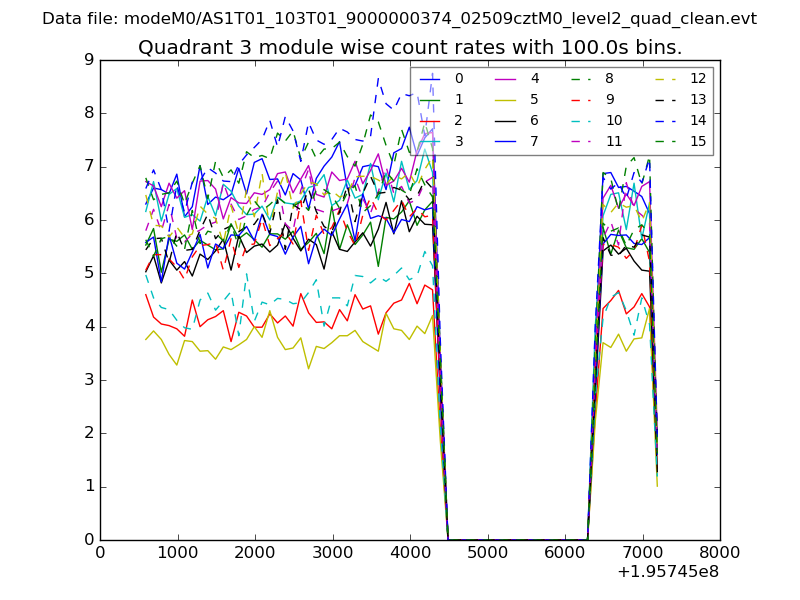
| Module-wise count rates for Quadrant A Data is divided into 100 sec bins |
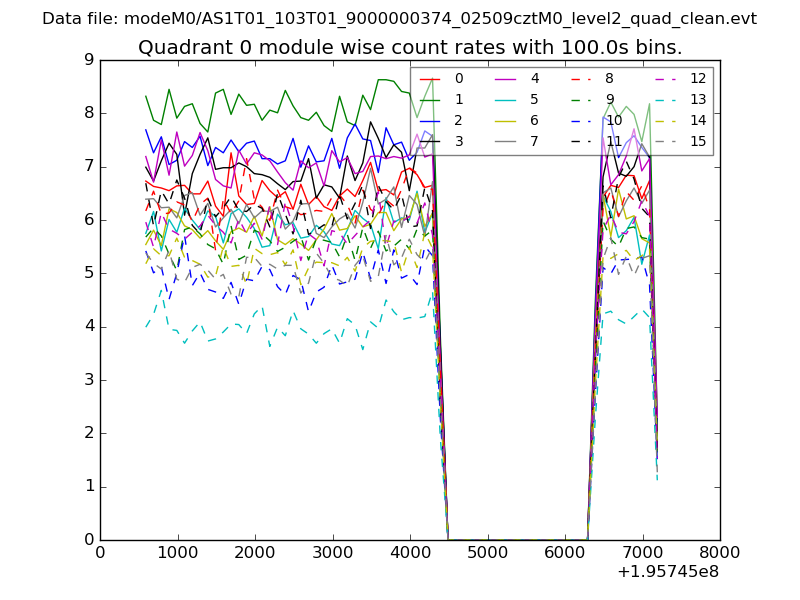 |
 |
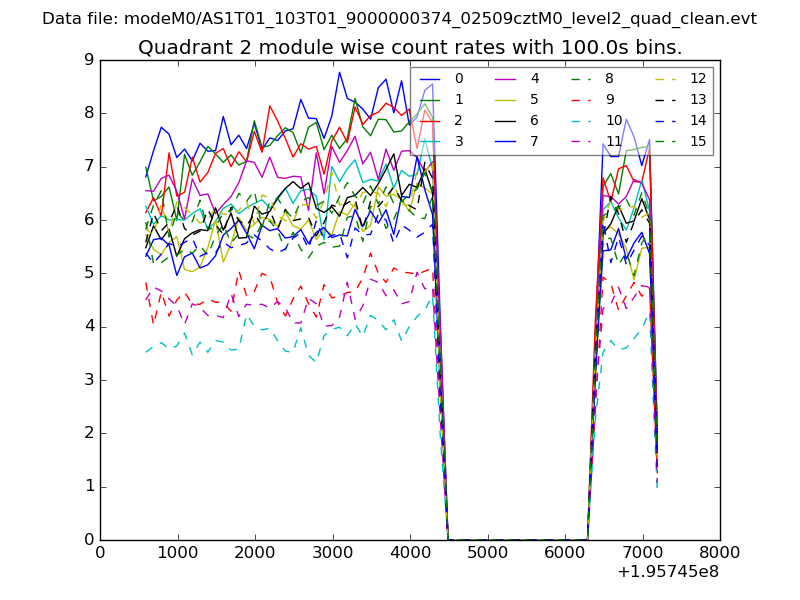
| Module-wise count rates for Quadrant B Data is divided into 100 sec bins |
 |
 |
| Module-wise count rates for Quadrant C Data is divided into 100 sec bins |
 |
 |
| Module-wise count rates for Quadrant D Data is divided into 100 sec bins |
 |
 |
| Parameter | Plot |
|---|---|
| CZT HV Monitor | 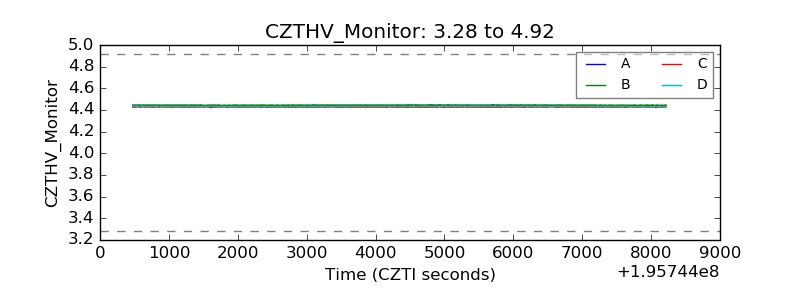 |
| D_VDD | 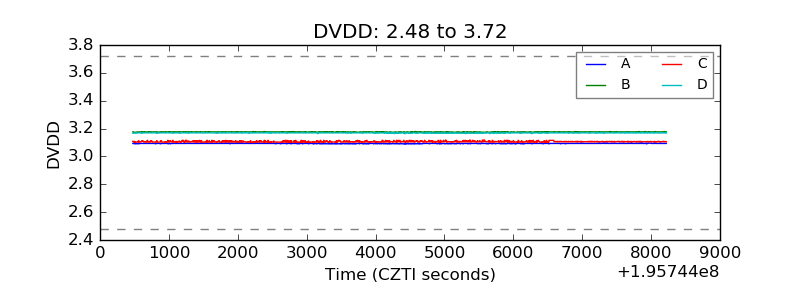 |
| Temperature 1 | 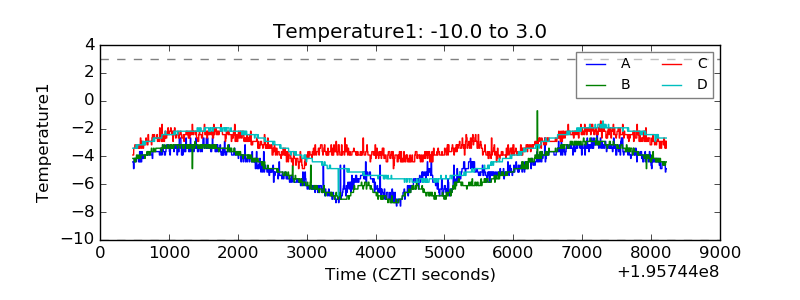 |
| Veto HV Monitor | 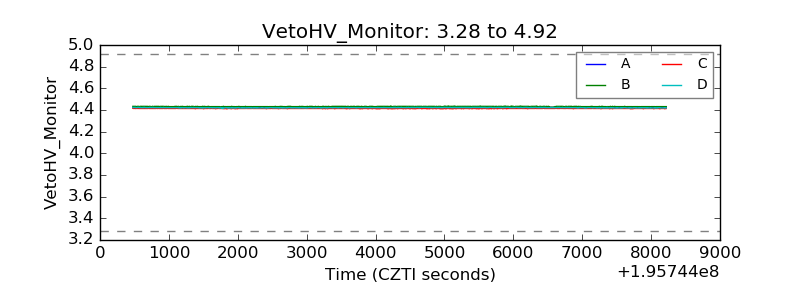 |
| Veto LLD | 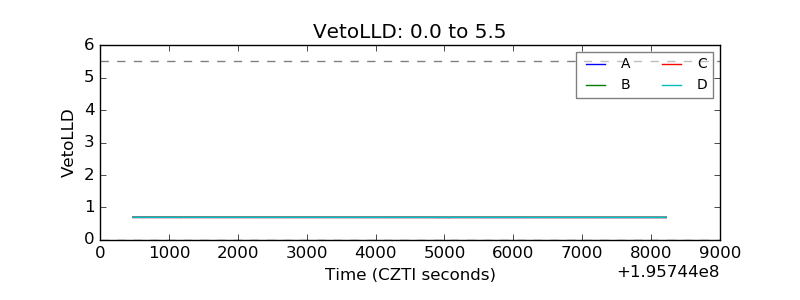 |
| Alpha Counter | 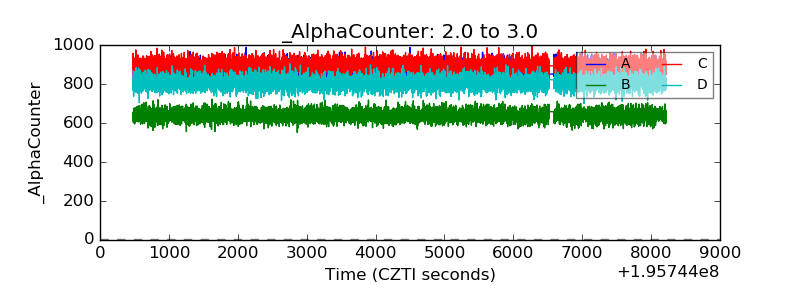 |
| _CPM_Rate | 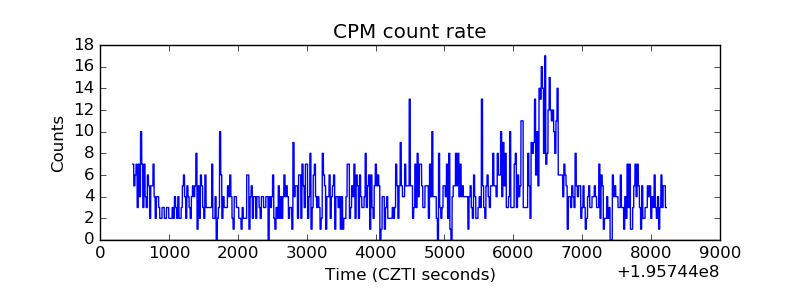 |
| CZT Counter | 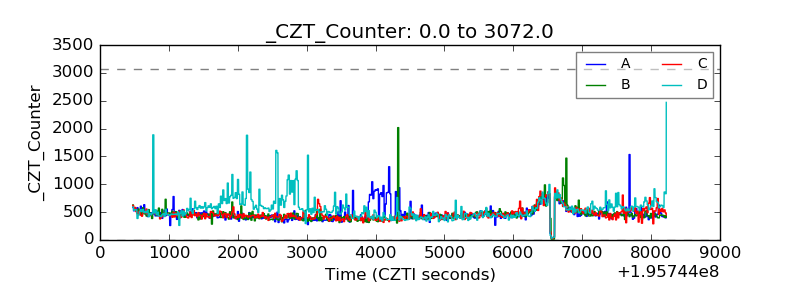 |
| +2.5 Volts monitor |  |
| +5 Volts monitor |  |
| _ROLL_ROT | 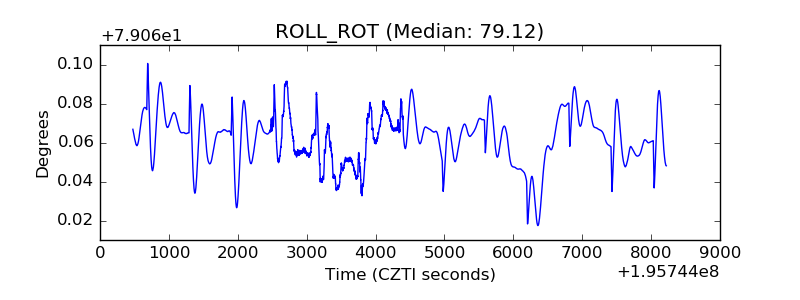 |
| _Roll_DEC | 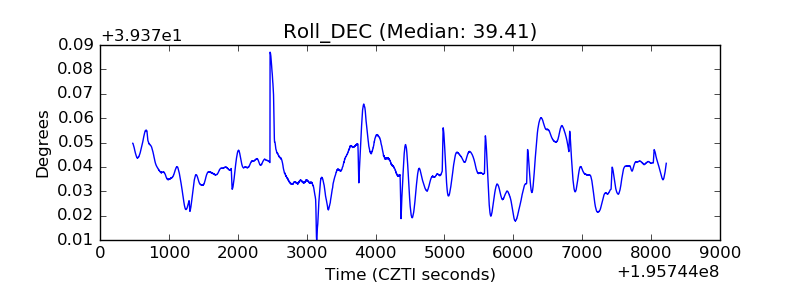 |
| _Roll_RA | 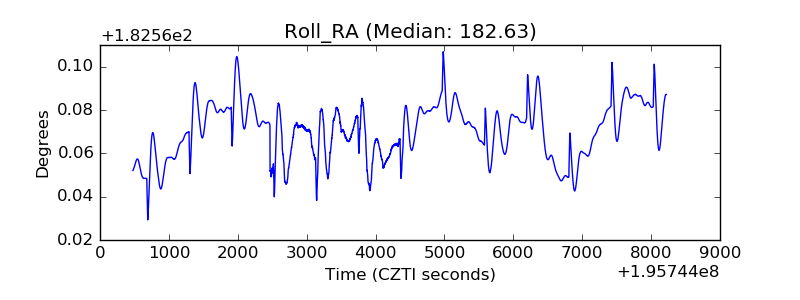 |
| Veto Counter | 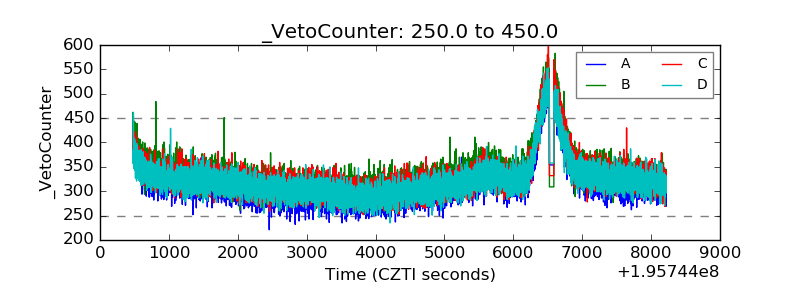 |