| Param | Original file | Final file |
|---|---|---|
| Filename | modeM0/AS1T01_103T01_9000000374_02511cztM0_level2.evt | modeM0/AS1T01_103T01_9000000374_02511cztM0_level2_quad_clean.evt |
| Size (bytes) | 545,175,360 | 86,042,880 |
| Size | 519.9 MB | 82.1 MB |
| Events in quadrant A | 4,140,065 | 515,324 |
| Events in quadrant B | 3,629,214 | 520,844 |
| Events in quadrant C | 4,070,247 | 512,214 |
| Events in quadrant D | 4,129,065 | 501,765 |
| Mode SS | |||
|---|---|---|---|
| Quadrant | BADHDUFLAG | Total packets | Discarded packets |
| A | 0 | 164 | 0 |
| B | 0 | 164 | 0 |
| C | 0 | 164 | 0 |
| D | 0 | 164 | 0 |
| Mode M9 | |||
|---|---|---|---|
| Quadrant | BADHDUFLAG | Total packets | Discarded packets |
| A | 0 | 10 | 0 |
| B | 0 | 10 | 0 |
| C | 0 | 10 | 0 |
| D | 0 | 10 | 0 |
| Mode M0 | |||
|---|---|---|---|
| Quadrant | BADHDUFLAG | Total packets | Discarded packets |
| A | 0 | 18052 | 8 |
| B | 0 | 16472 | 3 |
| C | 0 | 17225 | 6 |
| D | 0 | 17797 | 3 |
| Quadrant | Total seconds | Saturated seconds | Saturation percentage |
|---|---|---|---|
| A | 7986 | 56 | 0.701227% |
| B | 7988 | 54 | 0.676014% |
| C | 7987 | 66 | 0.826343% |
| D | 7988 | 48 | 0.600901% |
Noise dominated data is calculated using 1-second bins in cleaned event files. If a bin has >2000 counts, and if more than 50% of those come from <1% of pixels, then it is considered to be noise-dominated and hence unusable.
| Quadrant | # 1 sec bins | Bins with >0 counts | Bins with >2000 counts | High rate bins dominated by noise | Noise dominated (total time) | Noise dominated (detector-on time) | Marked lightcurve |
|---|---|---|---|---|---|---|---|
| A | 8949 | 7991 | 7 | 7 | 0.08% | 0.09% | 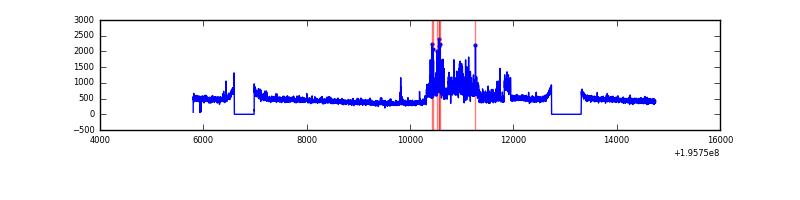 |
| B | 8949 | 7991 | 1 | 1 | 0.01% | 0.01% | 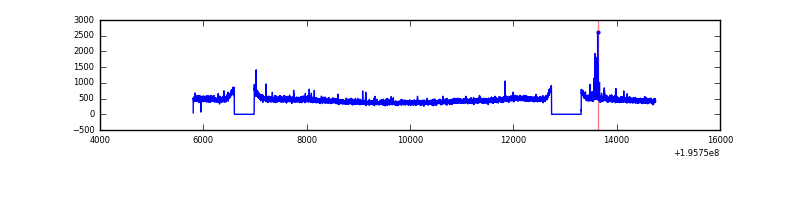 |
| C | 8949 | 7991 | 6 | 6 | 0.07% | 0.08% | 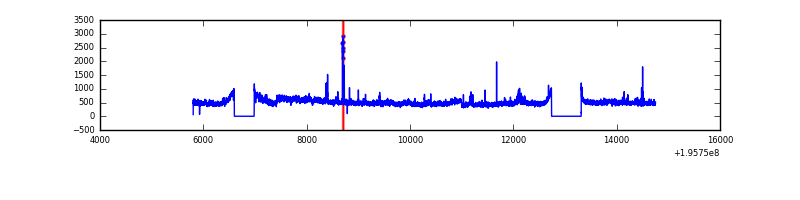 |
| D | 8949 | 7991 | 4 | 4 | 0.04% | 0.05% | 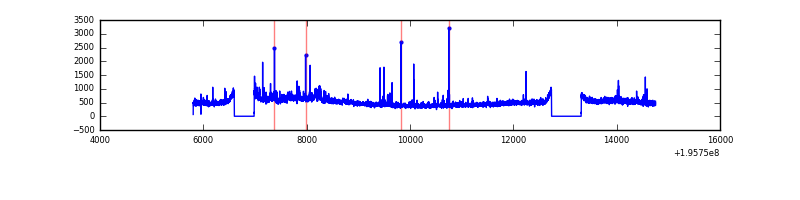 |
Top three noisy pixels from each quadrant. If the there are fewer than three noisy pixels in the level2.evt file, extra rows are filled as -1
| Pixel properties | Quadrant properties | ||||||
|---|---|---|---|---|---|---|---|
| Quadrant | DetID | PixID | Counts | Sigma | Mean | Median | Sigma |
| A | 0 | 128 | 622496 | 3314.2 | 912 | 889 | 187.6 |
| A | 12 | 194 | 10219 | 49.74 | 912 | 889 | 187.6 |
| A | 0 | 226 | 9707 | 47.01 | 912 | 889 | 187.6 |
| B | 15 | 85 | 44337 | 243.54 | 925 | 902 | 178.3 |
| B | 12 | 111 | 14429 | 75.85 | 925 | 902 | 178.3 |
| B | 11 | 111 | 12138 | 63.0 | 925 | 902 | 178.3 |
| C | 2 | 53 | 459859 | 2167.89 | 894 | 896 | 211.7 |
| C | 10 | 65 | 48035 | 222.66 | 894 | 896 | 211.7 |
| C | 0 | 207 | 40844 | 188.69 | 894 | 896 | 211.7 |
| D | 11 | 131 | 471619 | 2213.48 | 884 | 860 | 212.7 |
| D | 11 | 130 | 167707 | 784.51 | 884 | 860 | 212.7 |
| D | 2 | 184 | 59159 | 274.12 | 884 | 860 | 212.7 |
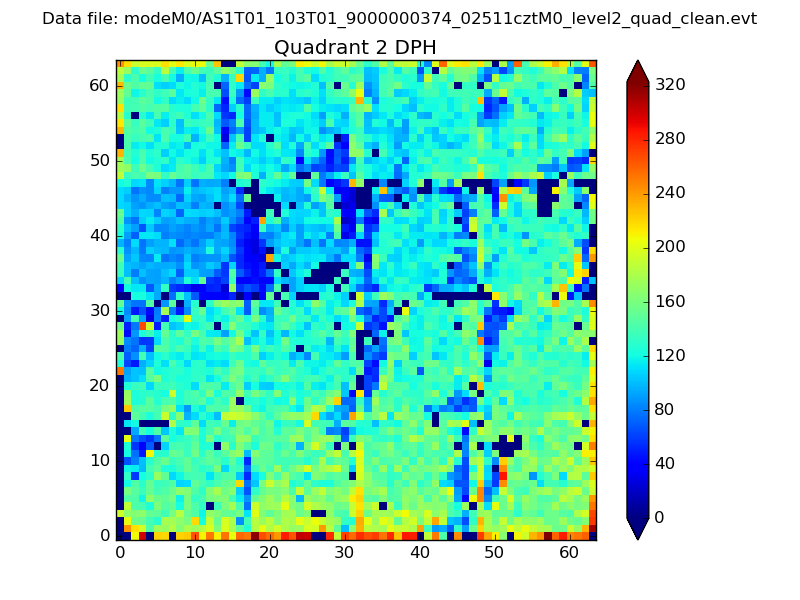
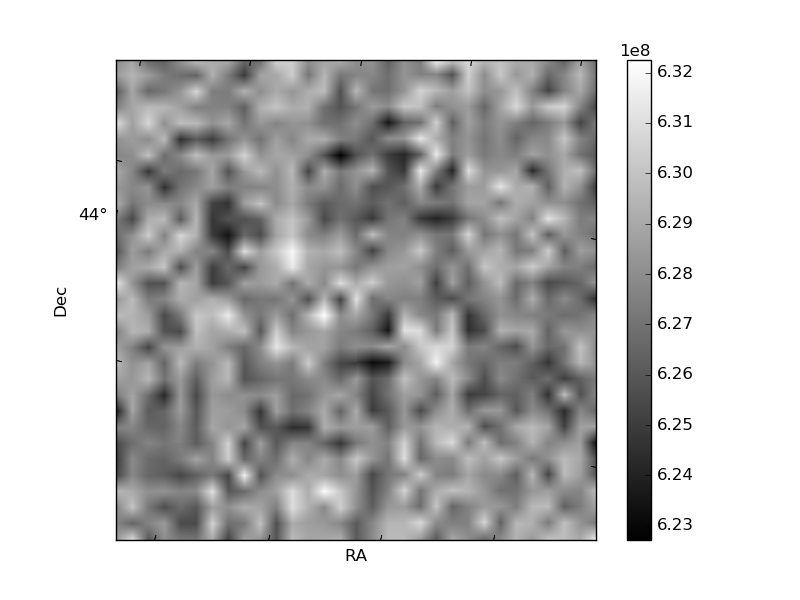
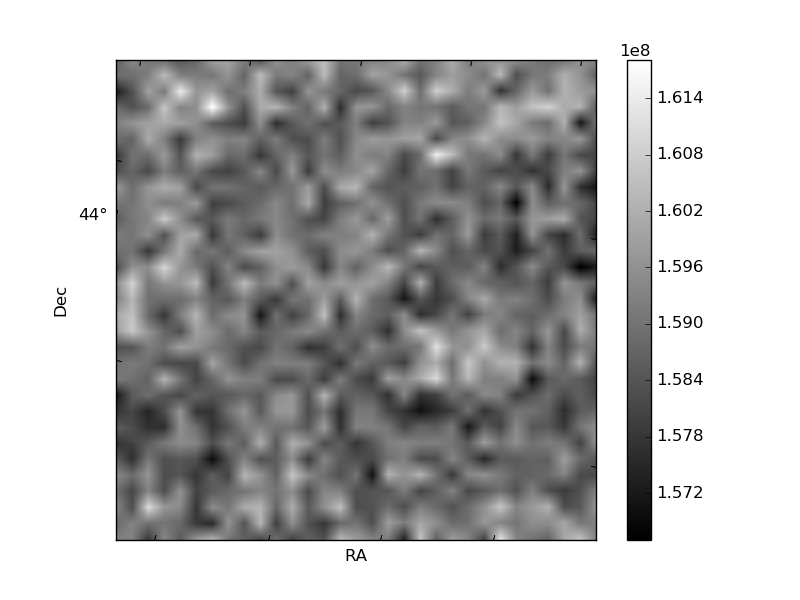
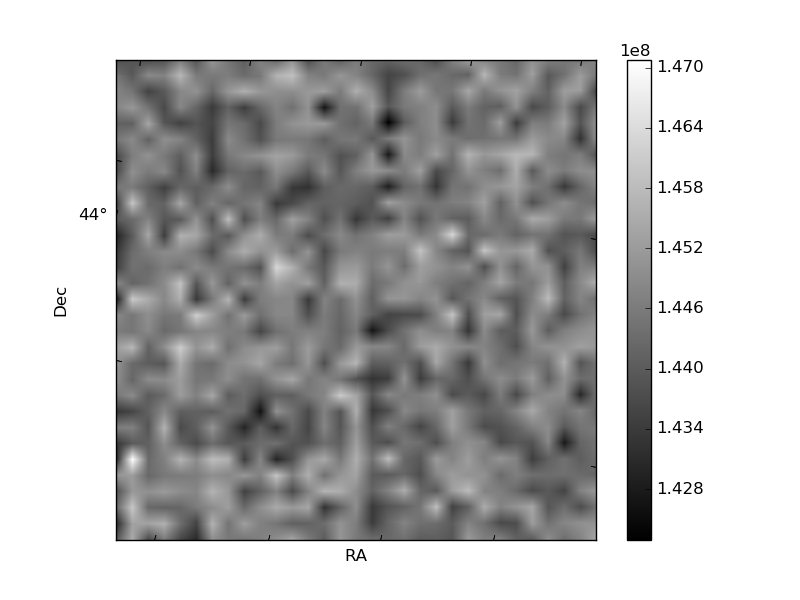
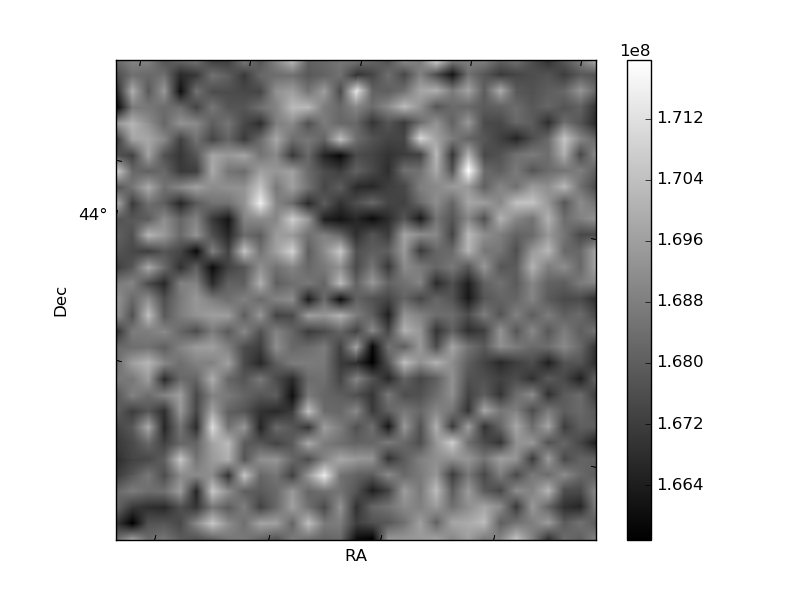
Histogram calculated using DETX and DETY for each event in the final _common_clean file
| Quadrant A | 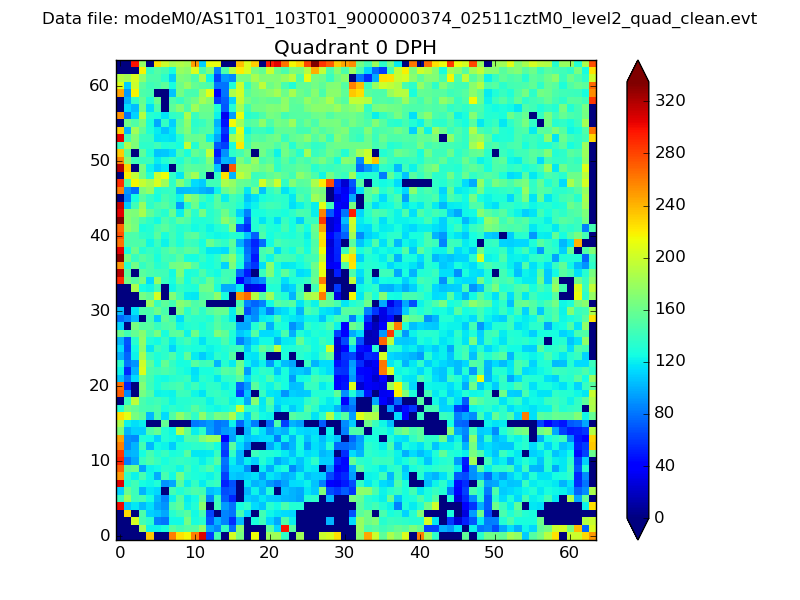 |
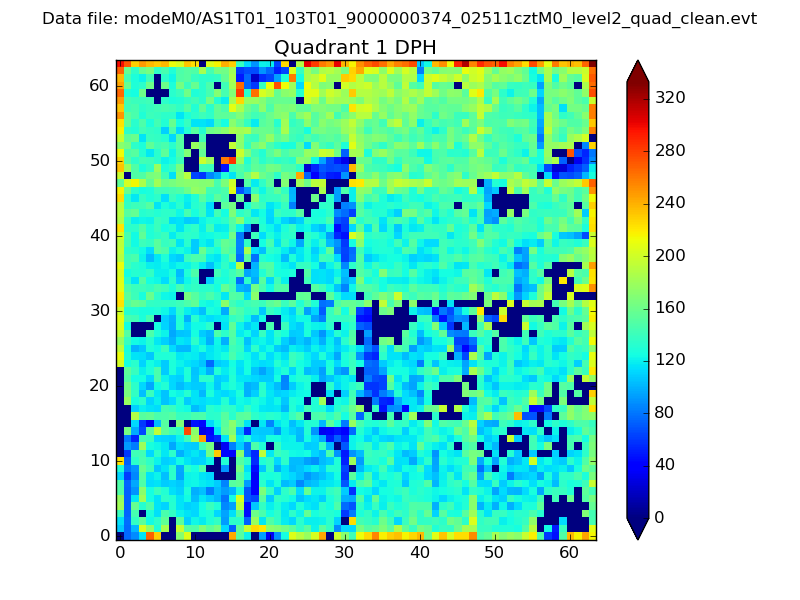 |
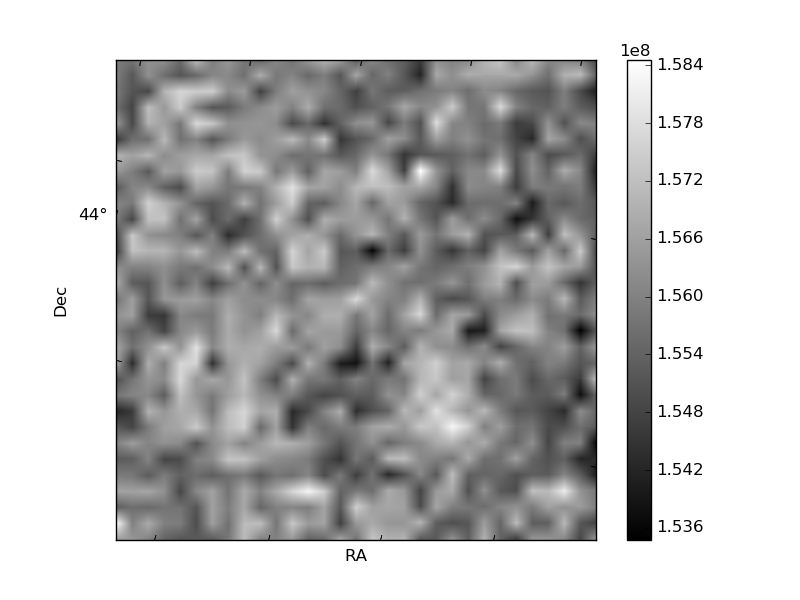
Quadrant B |
|---|---|---|---|
| Quadrant D | 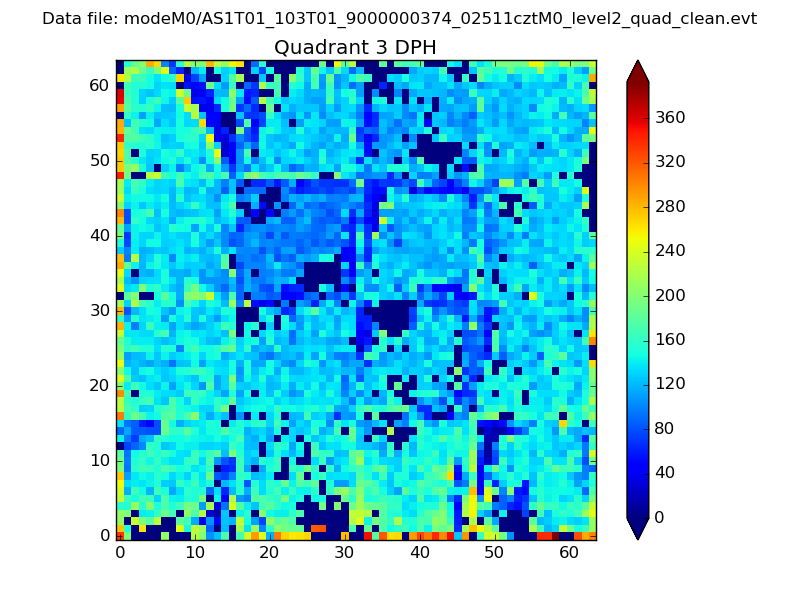 |
 |
Quadrant C |
| Plot type | Count rate plots | Images |
|---|---|---|
| Comparison with Poisson distribution Blue bars denote a histogram of data divided into 1 sec bins. Red curve is a Poisson curve with rate = median count rate of data. |
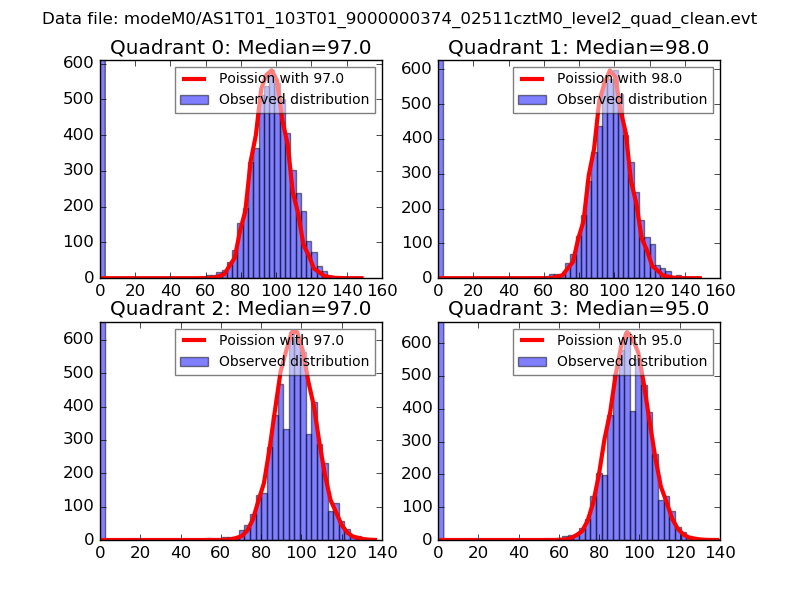 |
 |
| Quadrant-wise count rates Data is divided into 100 sec bins |
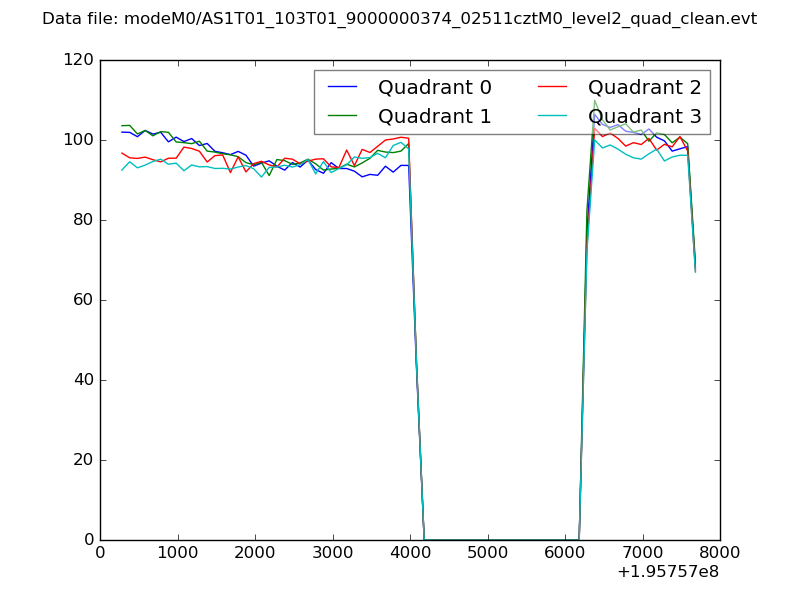 |
|
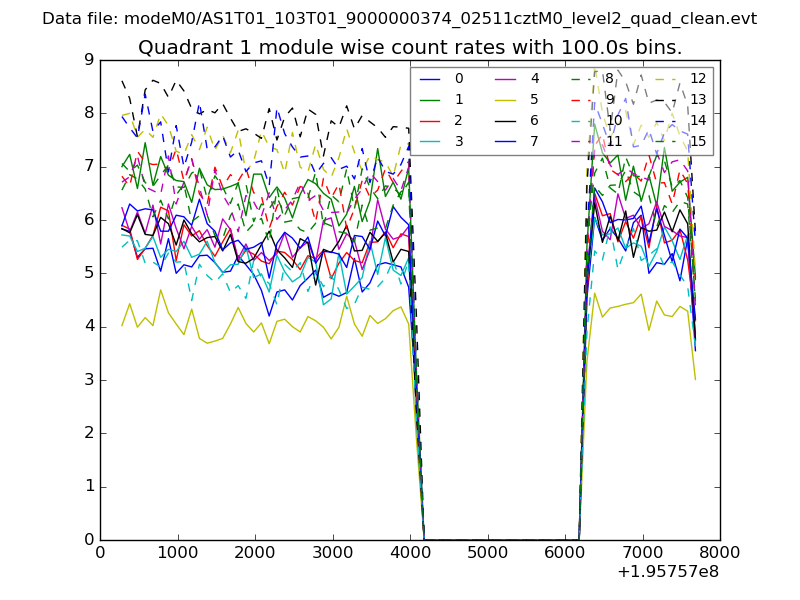
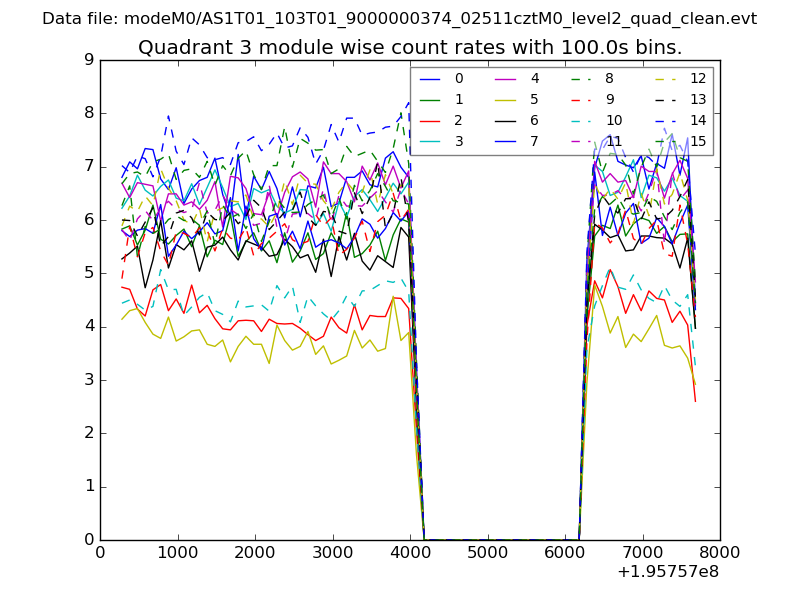
| Module-wise count rates for Quadrant A Data is divided into 100 sec bins |
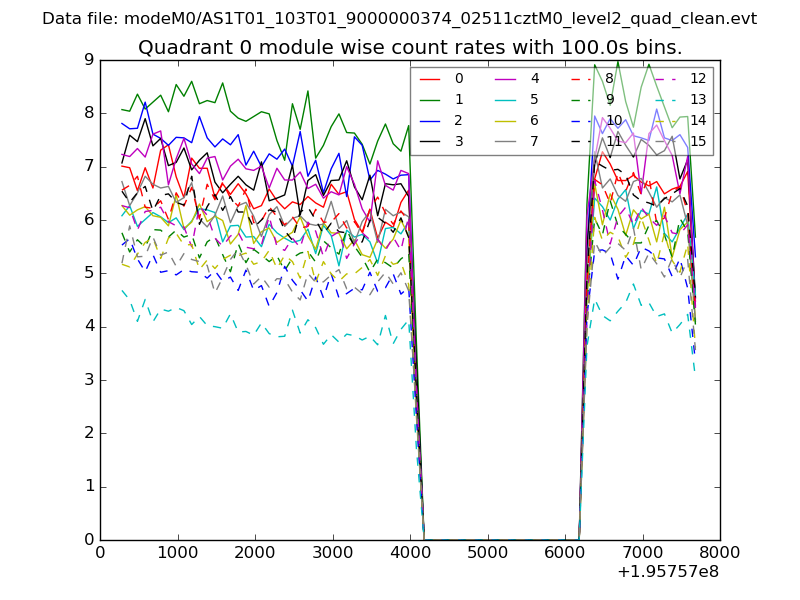 |
 |
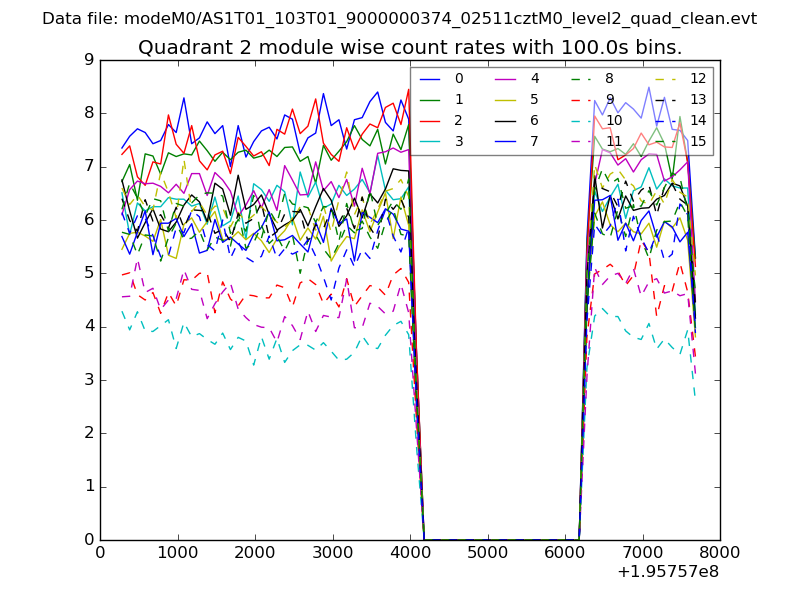
| Module-wise count rates for Quadrant B Data is divided into 100 sec bins |
 |
 |
| Module-wise count rates for Quadrant C Data is divided into 100 sec bins |
 |
 |
| Module-wise count rates for Quadrant D Data is divided into 100 sec bins |
 |
 |
| Parameter | Plot |
|---|---|
| CZT HV Monitor | 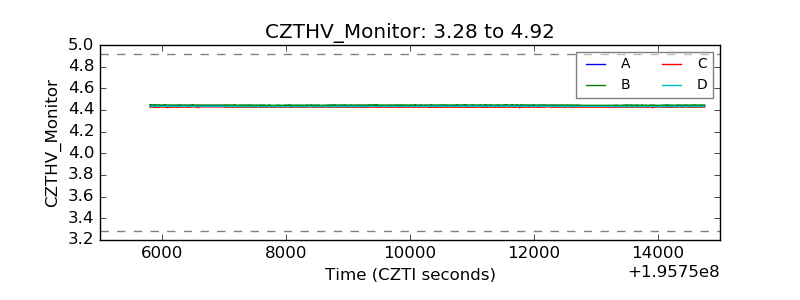 |
| D_VDD | 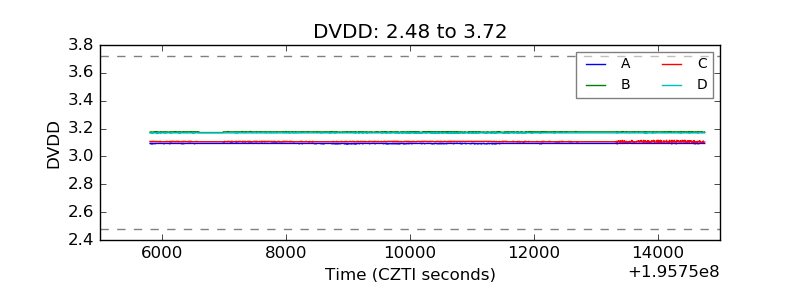 |
| Temperature 1 | 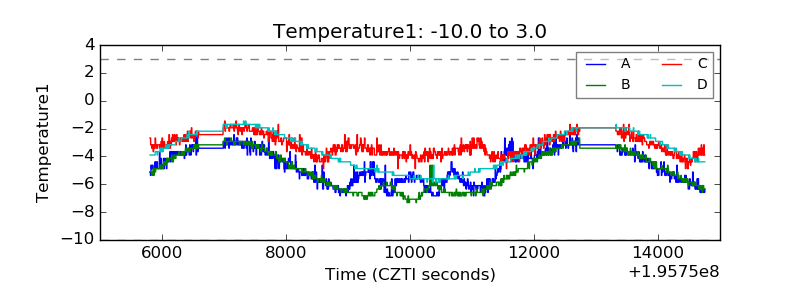 |
| Veto HV Monitor | 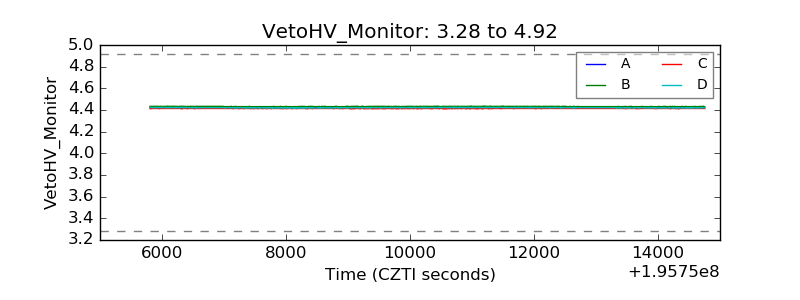 |
| Veto LLD | 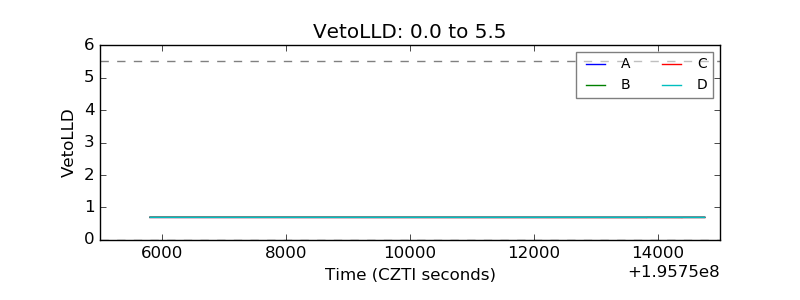 |
| Alpha Counter | 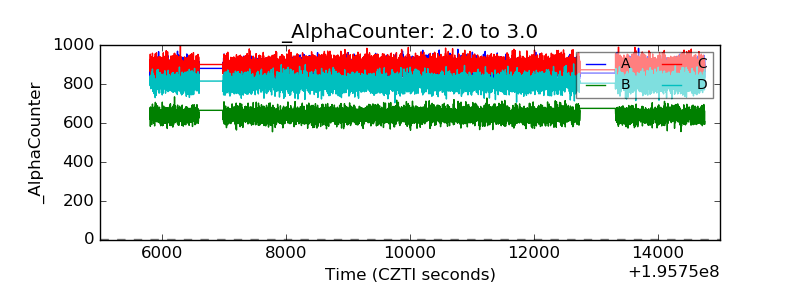 |
| _CPM_Rate | 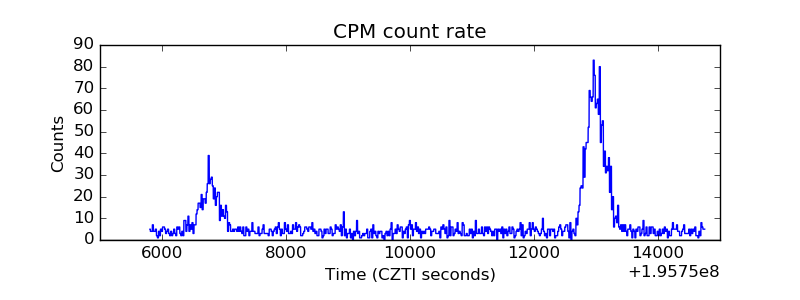 |
| CZT Counter | 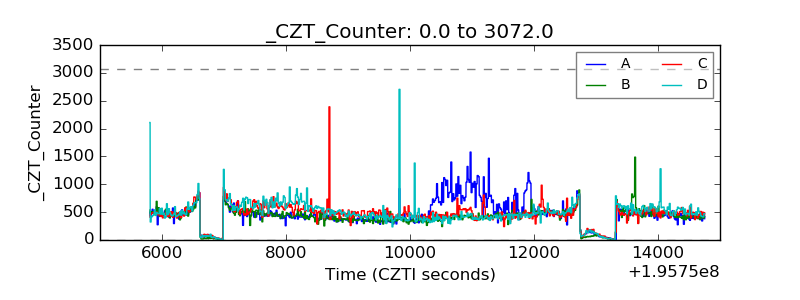 |
| +2.5 Volts monitor |  |
| +5 Volts monitor | 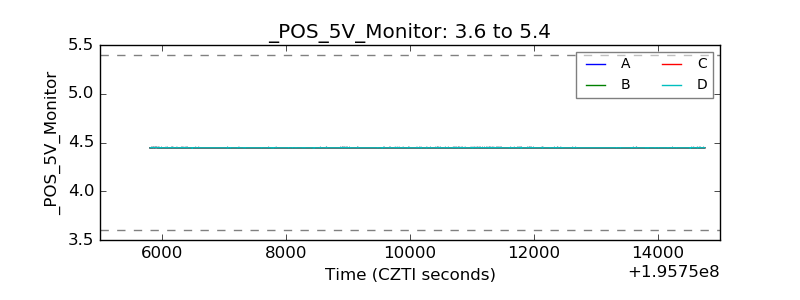 |
| _ROLL_ROT | 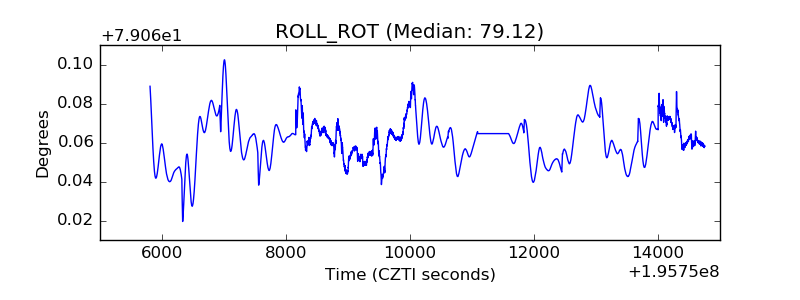 |
| _Roll_DEC | 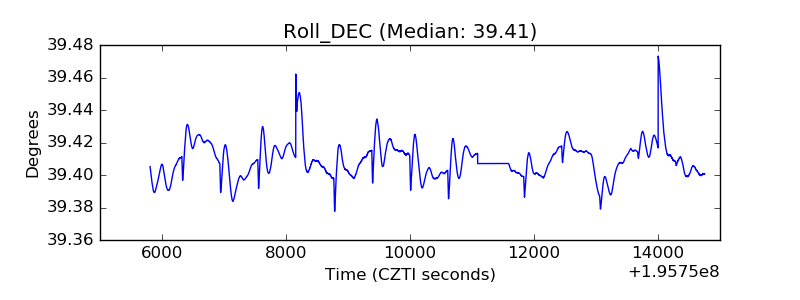 |
| _Roll_RA | 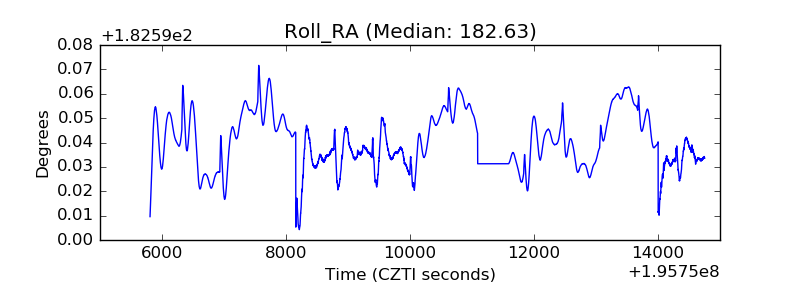 |
| Veto Counter | 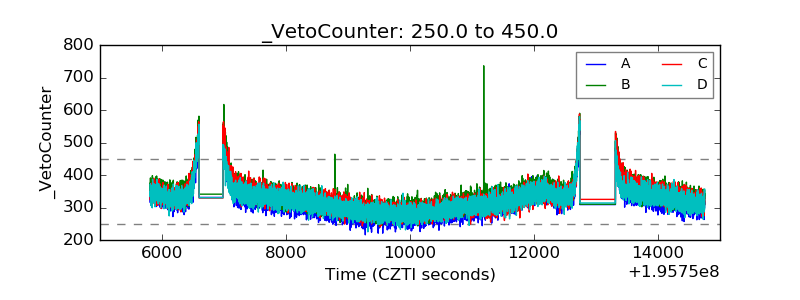 |