| Param | Original file | Final file |
|---|---|---|
| Filename | modeM0/AS1T01_103T01_9000000374_02514cztM0_level2.evt | modeM0/AS1T01_103T01_9000000374_02514cztM0_level2_quad_clean.evt |
| Size (bytes) | 403,505,280 | 77,371,200 |
| Size | 384.8 MB | 73.8 MB |
| Events in quadrant A | 2,792,554 | 472,102 |
| Events in quadrant B | 2,965,898 | 476,125 |
| Events in quadrant C | 2,890,459 | 475,214 |
| Events in quadrant D | 3,124,239 | 461,498 |
| Mode SS | |||
|---|---|---|---|
| Quadrant | BADHDUFLAG | Total packets | Discarded packets |
| A | 0 | 134 | 0 |
| B | 0 | 134 | 0 |
| C | 0 | 134 | 0 |
| D | 0 | 134 | 0 |
| Mode M9 | |||
|---|---|---|---|
| Quadrant | BADHDUFLAG | Total packets | Discarded packets |
| A | 0 | 17 | 0 |
| B | 0 | 17 | 0 |
| C | 0 | 17 | 0 |
| D | 0 | 18 | 0 |
| Mode M0 | |||
|---|---|---|---|
| Quadrant | BADHDUFLAG | Total packets | Discarded packets |
| A | 0 | 13279 | 3 |
| B | 0 | 13540 | 2 |
| C | 0 | 13477 | 2 |
| D | 0 | 14260 | 2 |
| Quadrant | Total seconds | Saturated seconds | Saturation percentage |
|---|---|---|---|
| A | 6564 | 15 | 0.228519% |
| B | 6564 | 19 | 0.289458% |
| C | 6564 | 14 | 0.213285% |
| D | 6564 | 31 | 0.472273% |
Noise dominated data is calculated using 1-second bins in cleaned event files. If a bin has >2000 counts, and if more than 50% of those come from <1% of pixels, then it is considered to be noise-dominated and hence unusable.
| Quadrant | # 1 sec bins | Bins with >0 counts | Bins with >2000 counts | High rate bins dominated by noise | Noise dominated (total time) | Noise dominated (detector-on time) | Marked lightcurve |
|---|---|---|---|---|---|---|---|
| A | 7614 | 6565 | 1 | 1 | 0.01% | 0.02% | 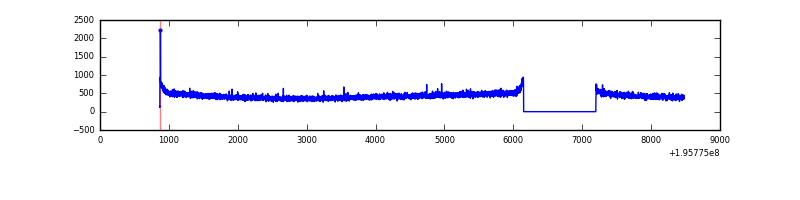 |
| B | 7614 | 6565 | 0 | 0 | 0.00% | 0.00% | 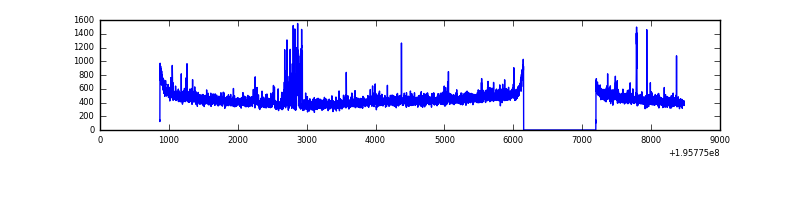 |
| C | 7614 | 6565 | 1 | 1 | 0.01% | 0.02% | 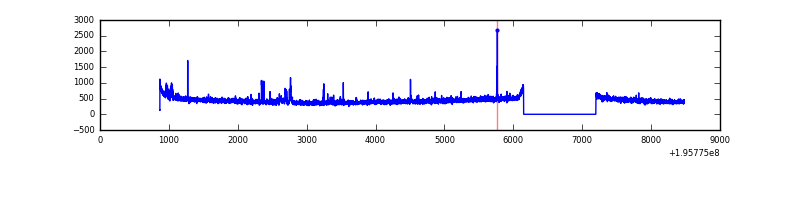 |
| D | 7614 | 6565 | 10 | 10 | 0.13% | 0.15% | 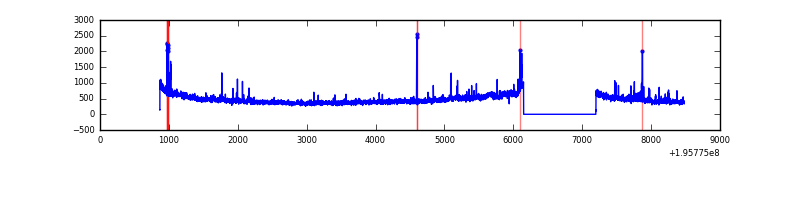 |
Top three noisy pixels from each quadrant. If the there are fewer than three noisy pixels in the level2.evt file, extra rows are filled as -1
| Pixel properties | Quadrant properties | ||||||
|---|---|---|---|---|---|---|---|
| Quadrant | DetID | PixID | Counts | Sigma | Mean | Median | Sigma |
| A | 12 | 194 | 7845 | 48.02 | 724 | 705 | 148.7 |
| A | 0 | 226 | 7784 | 47.61 | 724 | 705 | 148.7 |
| A | 13 | 9 | 4832 | 27.76 | 724 | 705 | 148.7 |
| B | 7 | 205 | 93830 | 658.65 | 738 | 719 | 141.4 |
| B | 5 | 6 | 14478 | 97.33 | 738 | 719 | 141.4 |
| B | 12 | 111 | 11633 | 77.2 | 738 | 719 | 141.4 |
| C | 10 | 65 | 48811 | 286.86 | 713 | 714 | 167.7 |
| C | 2 | 53 | 26804 | 155.6 | 713 | 714 | 167.7 |
| C | 4 | 248 | 9517 | 52.5 | 713 | 714 | 167.7 |
| D | 11 | 131 | 301387 | 1815.68 | 699 | 682 | 165.6 |
| D | 11 | 130 | 76431 | 457.38 | 699 | 682 | 165.6 |
| D | 2 | 184 | 50951 | 303.53 | 699 | 682 | 165.6 |
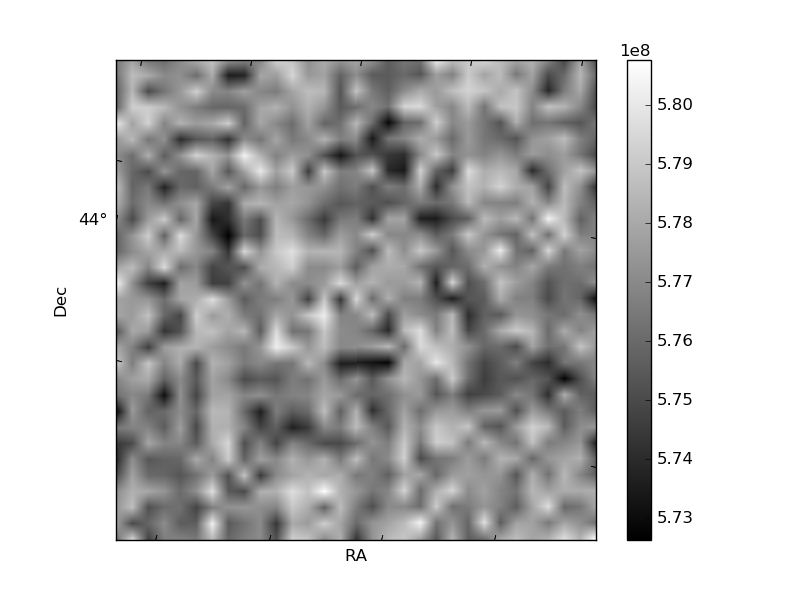
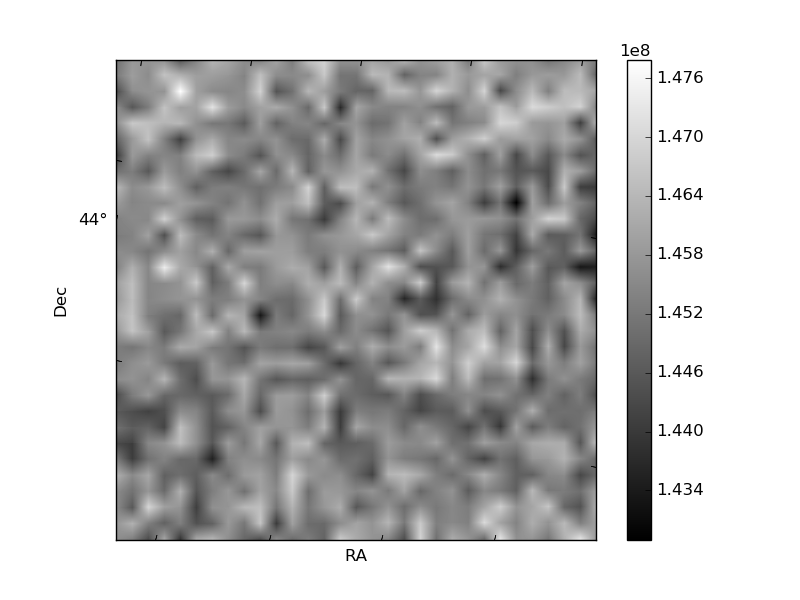
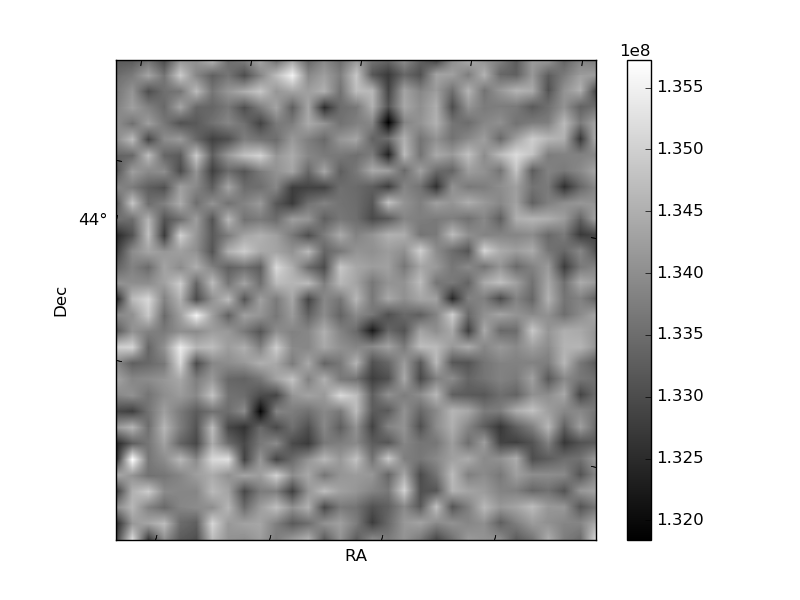
Histogram calculated using DETX and DETY for each event in the final _common_clean file
| Quadrant A | 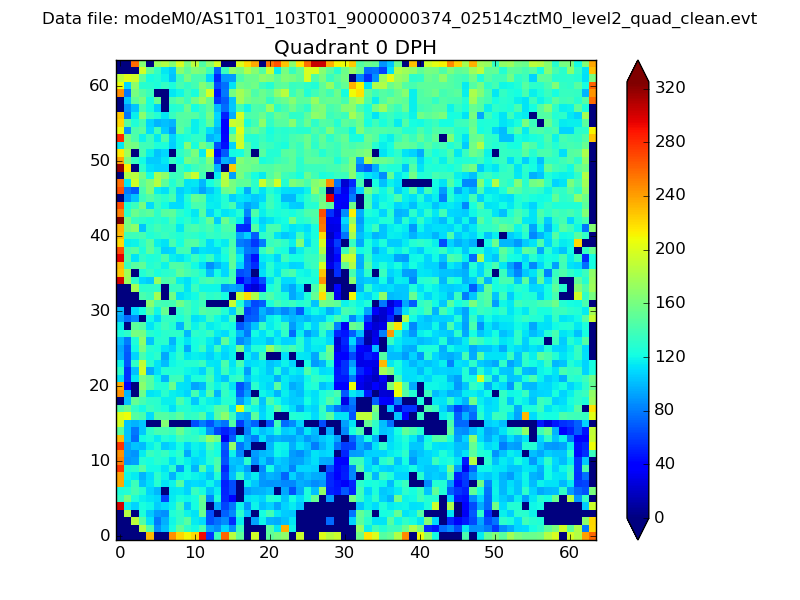 |
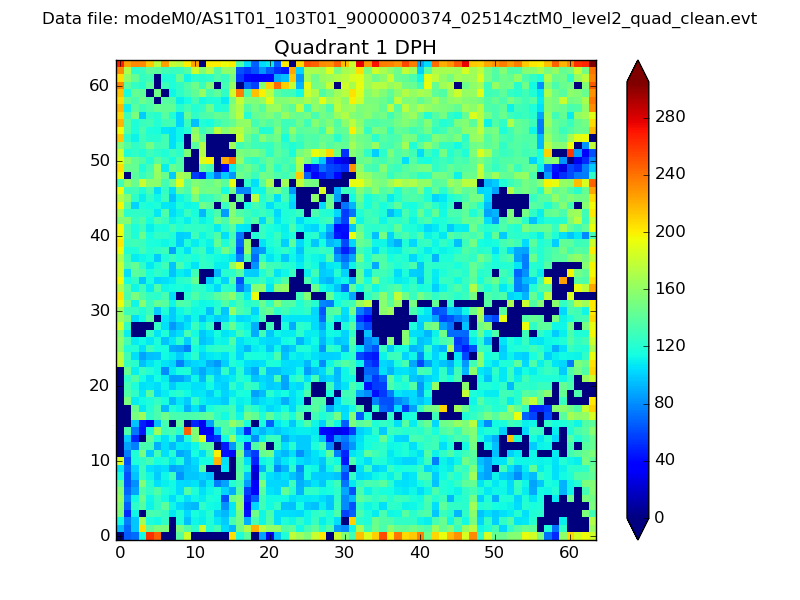 |
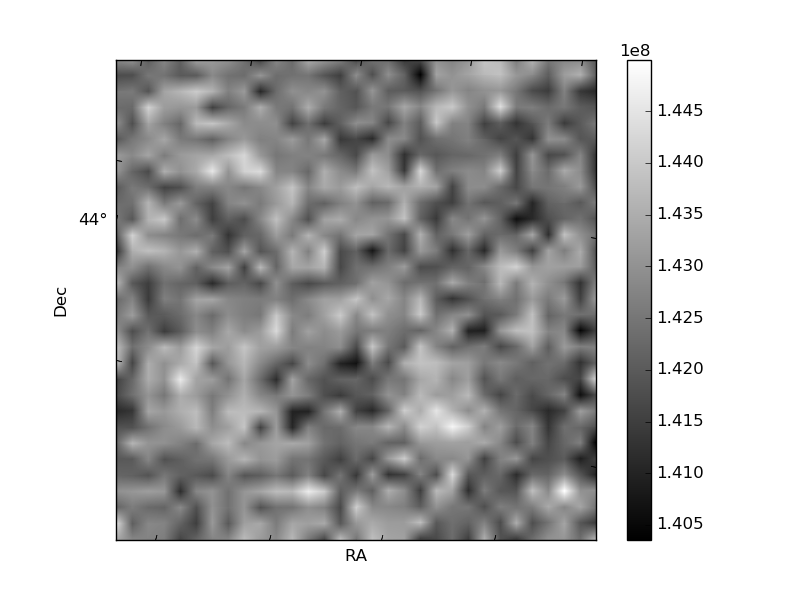
Quadrant B |
|---|---|---|---|
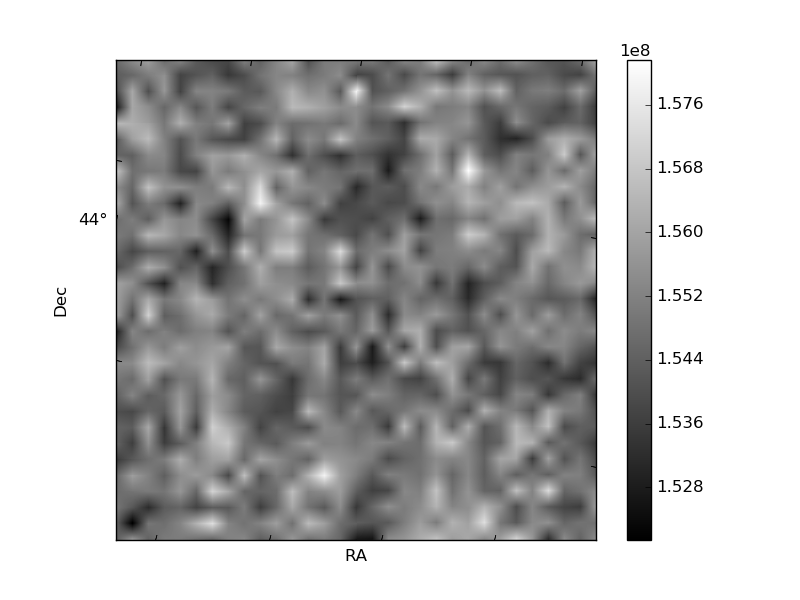
| Quadrant D | 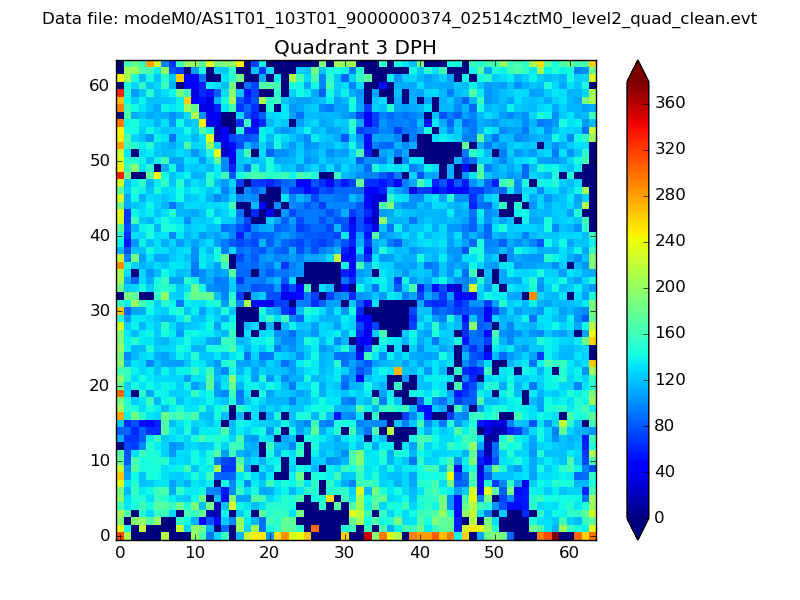 |
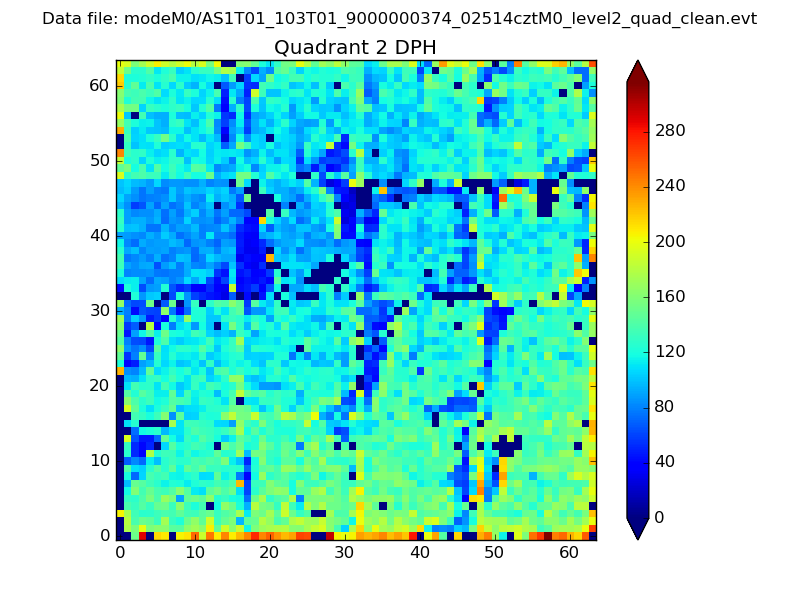 |
Quadrant C |
| Plot type | Count rate plots | Images |
|---|---|---|
| Comparison with Poisson distribution Blue bars denote a histogram of data divided into 1 sec bins. Red curve is a Poisson curve with rate = median count rate of data. |
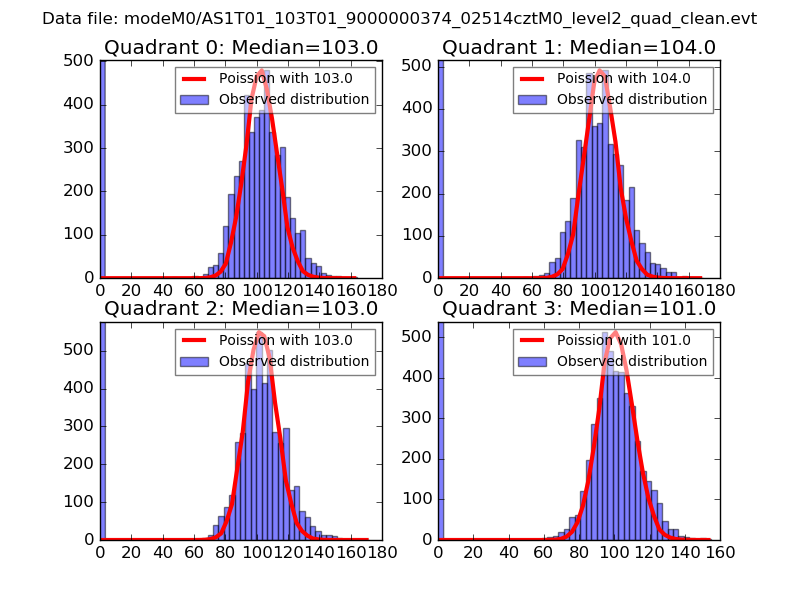 |
 |
| Quadrant-wise count rates Data is divided into 100 sec bins |
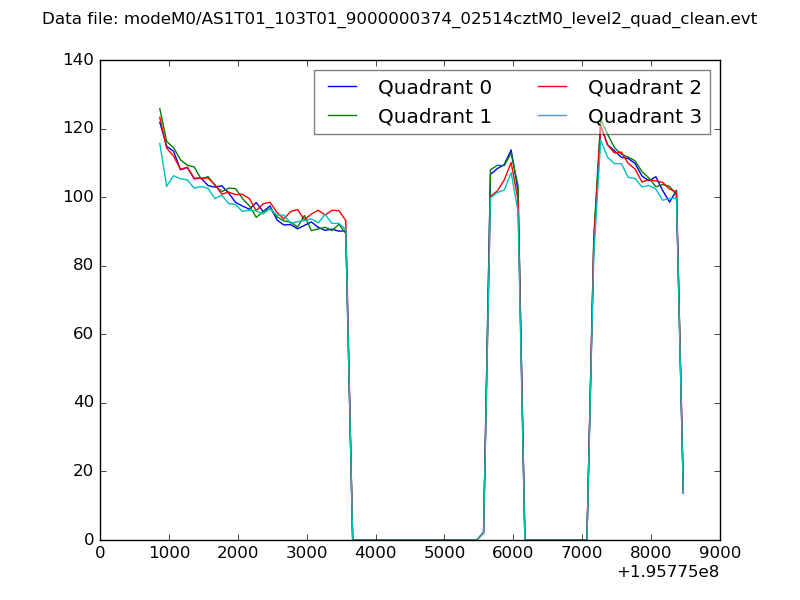 |
|
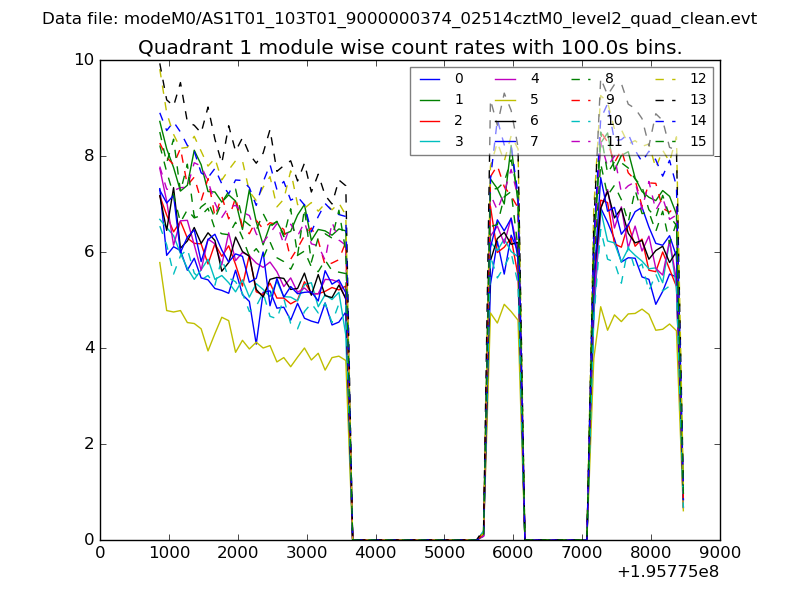
| Module-wise count rates for Quadrant A Data is divided into 100 sec bins |
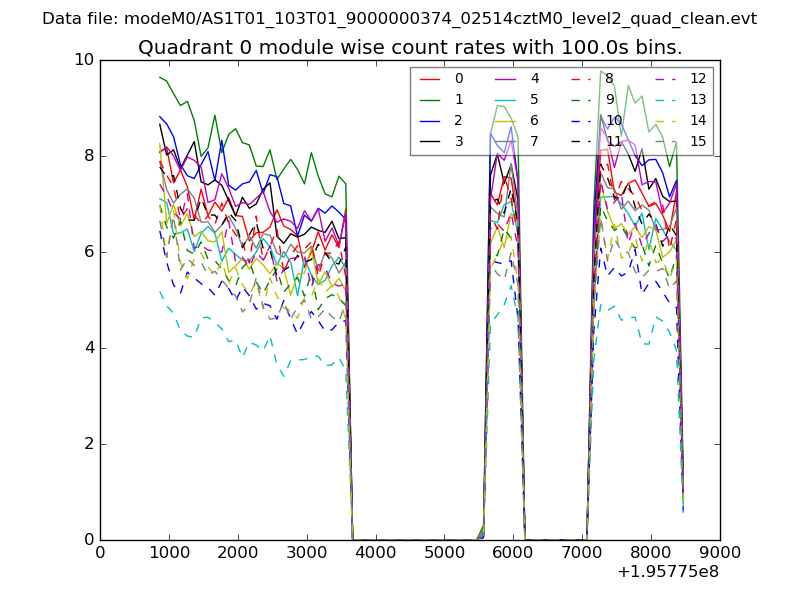 |
 |
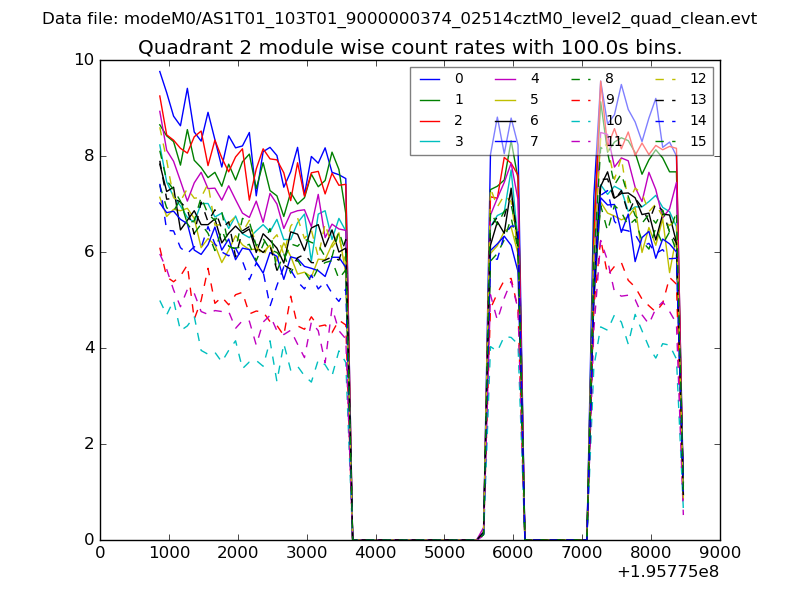
| Module-wise count rates for Quadrant B Data is divided into 100 sec bins |
 |
 |
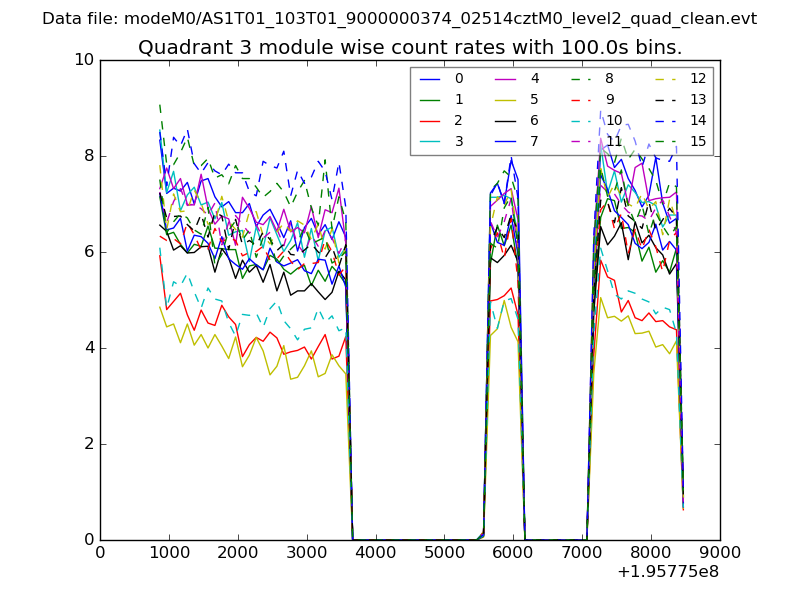
| Module-wise count rates for Quadrant C Data is divided into 100 sec bins |
 |
 |
| Module-wise count rates for Quadrant D Data is divided into 100 sec bins |
 |
 |
| Parameter | Plot |
|---|---|
| CZT HV Monitor | 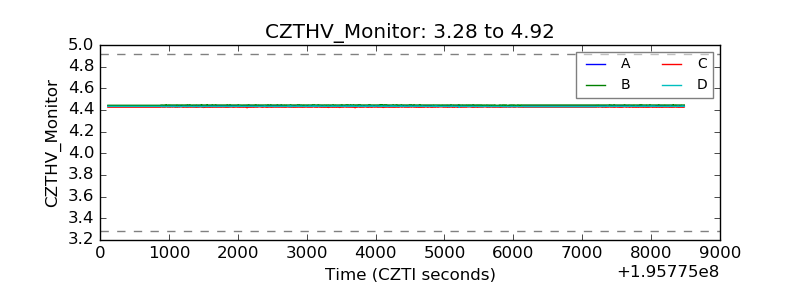 |
| D_VDD | 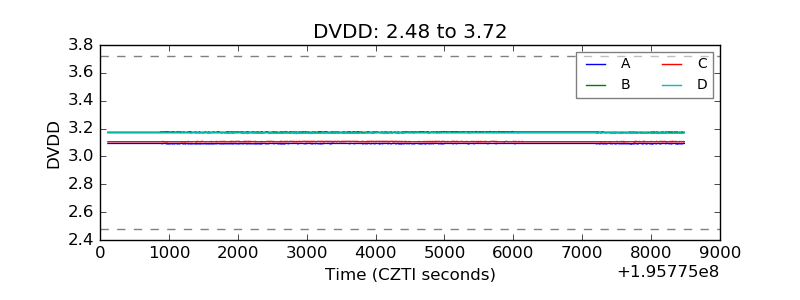 |
| Temperature 1 | 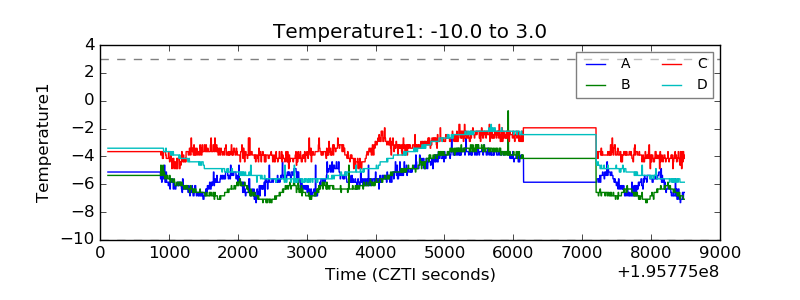 |
| Veto HV Monitor | 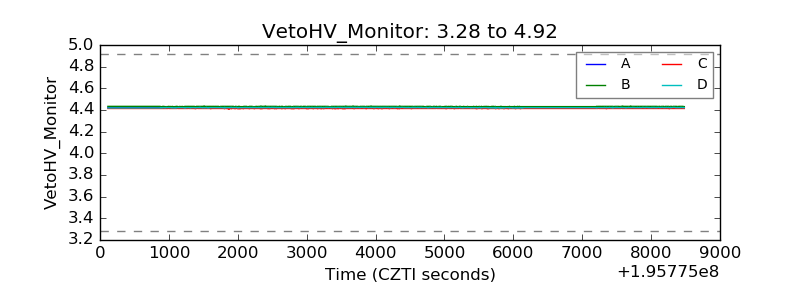 |
| Veto LLD | 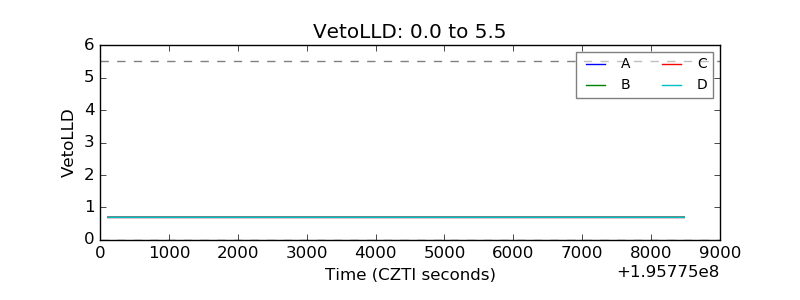 |
| Alpha Counter | 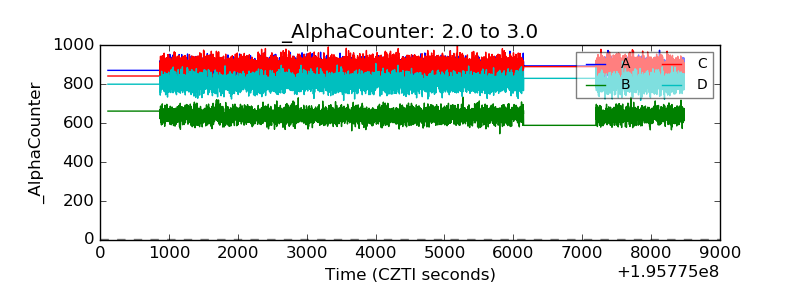 |
| _CPM_Rate | 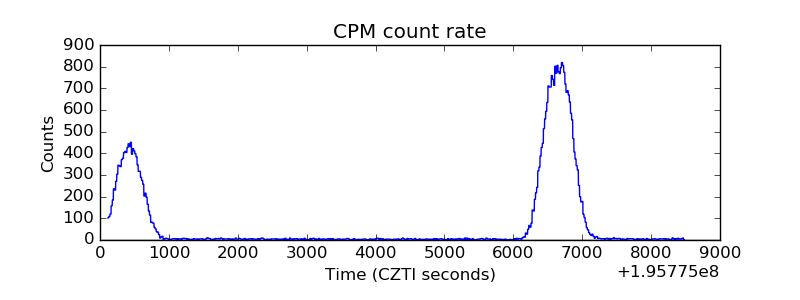 |
| CZT Counter | 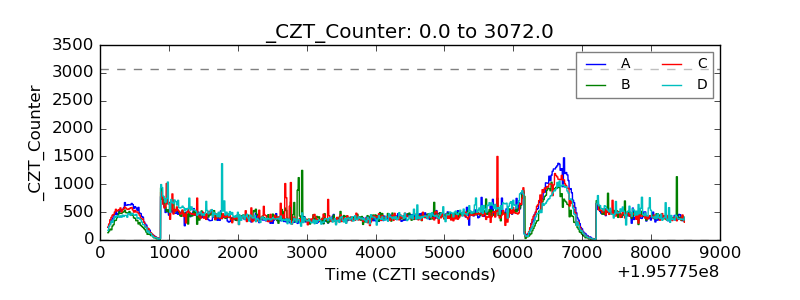 |
| +2.5 Volts monitor |  |
| +5 Volts monitor |  |
| _ROLL_ROT | 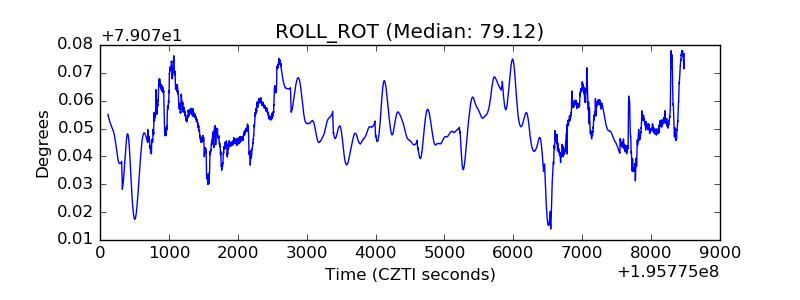 |
| _Roll_DEC | 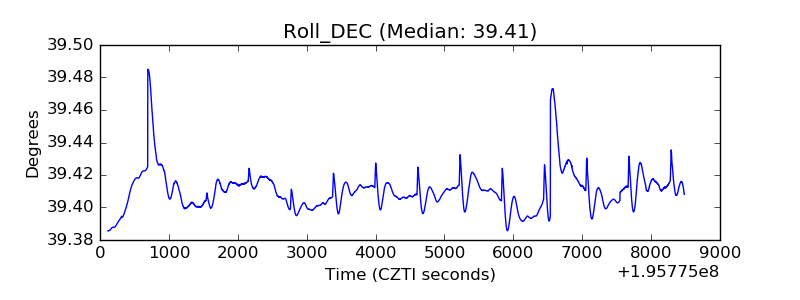 |
| _Roll_RA | 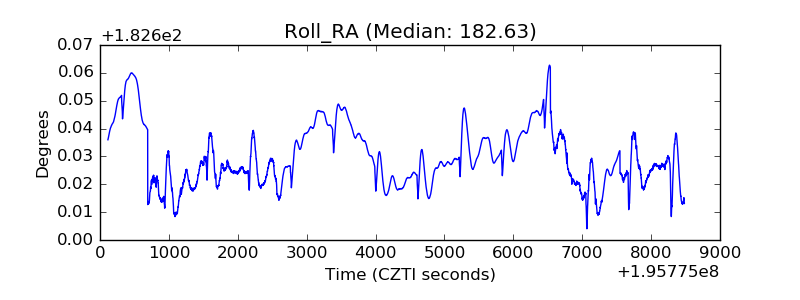 |
| Veto Counter | 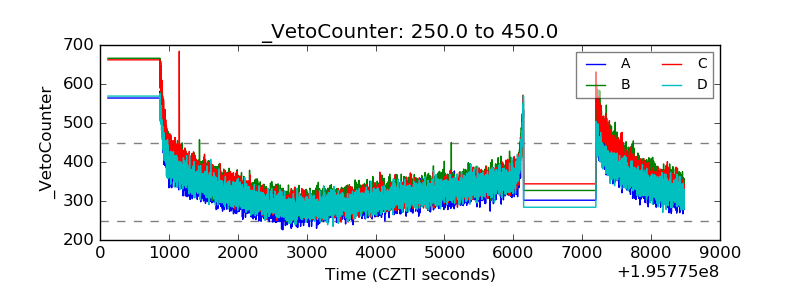 |