| Param | Original file | Final file |
|---|---|---|
| Filename | modeM0/AS1T01_103T01_9000000374_02516cztM0_level2.evt | modeM0/AS1T01_103T01_9000000374_02516cztM0_level2_quad_clean.evt |
| Size (bytes) | 402,649,920 | 79,202,880 |
| Size | 384.0 MB | 75.5 MB |
| Events in quadrant A | 2,831,999 | 487,733 |
| Events in quadrant B | 2,951,411 | 493,066 |
| Events in quadrant C | 2,854,386 | 487,612 |
| Events in quadrant D | 3,110,685 | 473,240 |
| Mode SS | |||
|---|---|---|---|
| Quadrant | BADHDUFLAG | Total packets | Discarded packets |
| A | 0 | 136 | 0 |
| B | 0 | 136 | 0 |
| C | 0 | 136 | 0 |
| D | 0 | 136 | 0 |
| Mode M9 | |||
|---|---|---|---|
| Quadrant | BADHDUFLAG | Total packets | Discarded packets |
| A | 0 | 22 | 0 |
| B | 0 | 22 | 0 |
| C | 0 | 22 | 0 |
| D | 0 | 22 | 0 |
| Mode M0 | |||
|---|---|---|---|
| Quadrant | BADHDUFLAG | Total packets | Discarded packets |
| A | 0 | 13242 | 3 |
| B | 0 | 13445 | 2 |
| C | 0 | 13337 | 2 |
| D | 0 | 14046 | 2 |
| Quadrant | Total seconds | Saturated seconds | Saturation percentage |
|---|---|---|---|
| A | 6544 | 9 | 0.137531% |
| B | 6544 | 25 | 0.382029% |
| C | 6544 | 7 | 0.106968% |
| D | 6544 | 25 | 0.382029% |
Noise dominated data is calculated using 1-second bins in cleaned event files. If a bin has >2000 counts, and if more than 50% of those come from <1% of pixels, then it is considered to be noise-dominated and hence unusable.
| Quadrant | # 1 sec bins | Bins with >0 counts | Bins with >2000 counts | High rate bins dominated by noise | Noise dominated (total time) | Noise dominated (detector-on time) | Marked lightcurve |
|---|---|---|---|---|---|---|---|
| A | 8764 | 6546 | 0 | 0 | 0.00% | 0.00% | 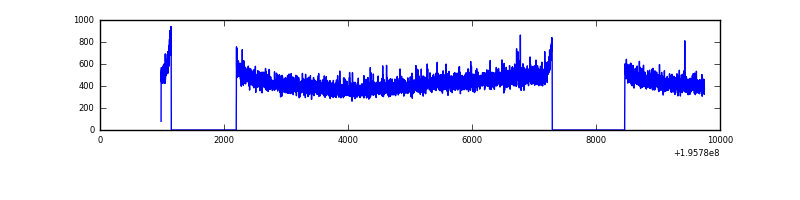 |
| B | 8764 | 6546 | 0 | 0 | 0.00% | 0.00% | 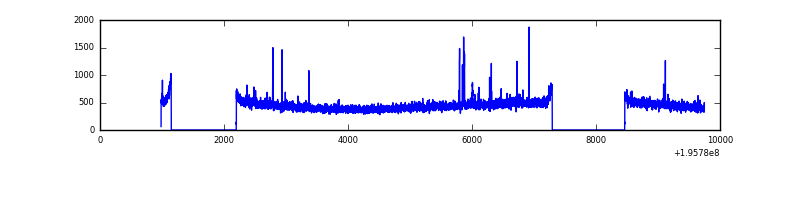 |
| C | 8764 | 6546 | 0 | 0 | 0.00% | 0.00% | 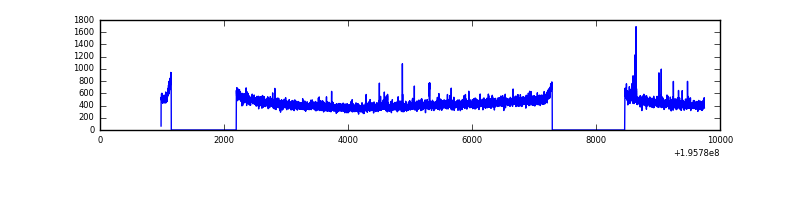 |
| D | 8764 | 6546 | 6 | 6 | 0.07% | 0.09% | 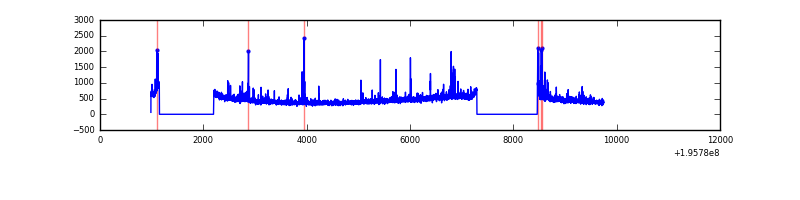 |
Top three noisy pixels from each quadrant. If the there are fewer than three noisy pixels in the level2.evt file, extra rows are filled as -1
| Pixel properties | Quadrant properties | ||||||
|---|---|---|---|---|---|---|---|
| Quadrant | DetID | PixID | Counts | Sigma | Mean | Median | Sigma |
| A | 12 | 194 | 8019 | 48.5 | 735 | 720 | 150.5 |
| A | 0 | 226 | 7717 | 46.49 | 735 | 720 | 150.5 |
| A | 13 | 9 | 3781 | 20.34 | 735 | 720 | 150.5 |
| B | 5 | 172 | 32594 | 224.64 | 746 | 727 | 141.9 |
| B | 12 | 111 | 11555 | 76.33 | 746 | 727 | 141.9 |
| B | 5 | 6 | 9514 | 61.94 | 746 | 727 | 141.9 |
| C | 0 | 207 | 29682 | 172.65 | 716 | 718 | 167.8 |
| C | 10 | 65 | 13331 | 75.18 | 716 | 718 | 167.8 |
| C | 2 | 53 | 7024 | 37.59 | 716 | 718 | 167.8 |
| D | 11 | 131 | 212172 | 1268.7 | 702 | 685 | 166.7 |
| D | 2 | 184 | 72576 | 431.27 | 702 | 685 | 166.7 |
| D | 11 | 130 | 65053 | 386.14 | 702 | 685 | 166.7 |
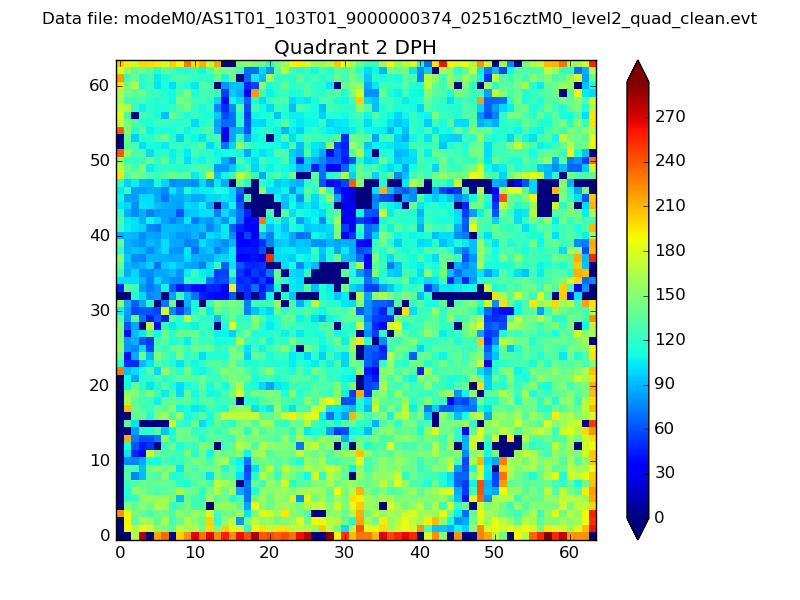
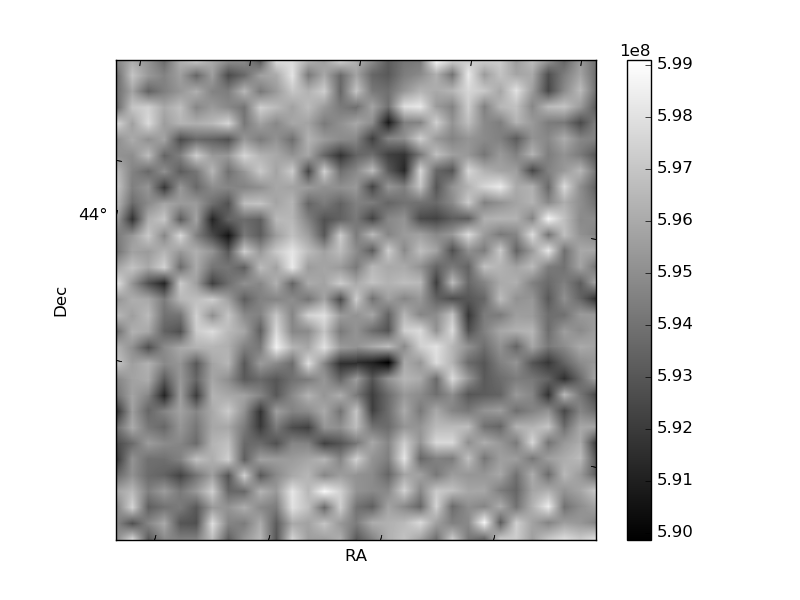
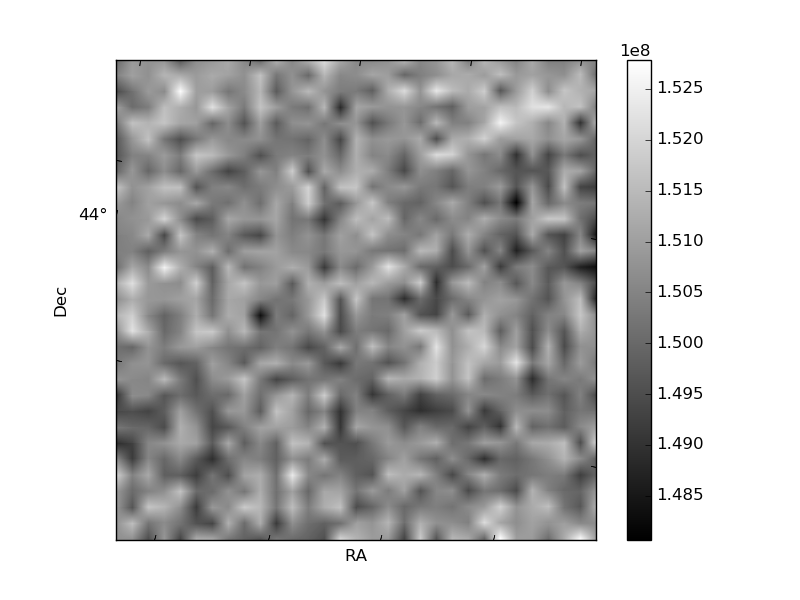
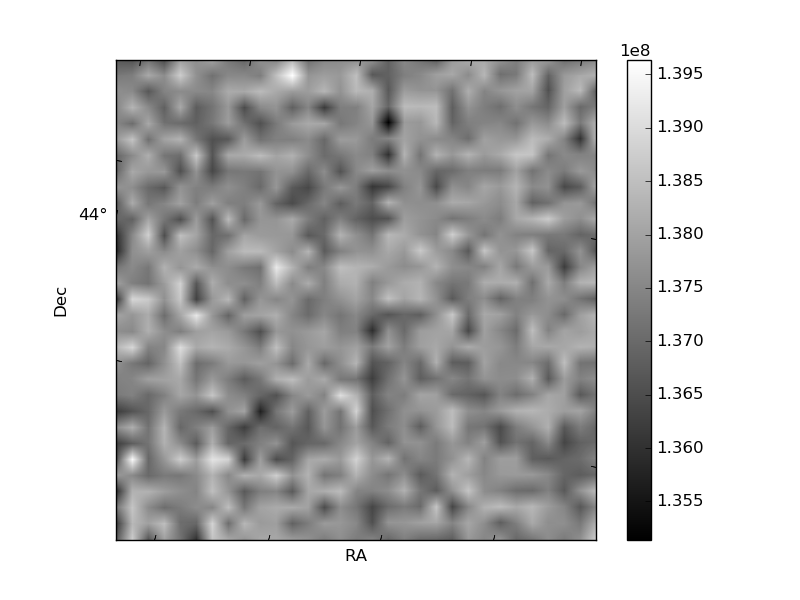
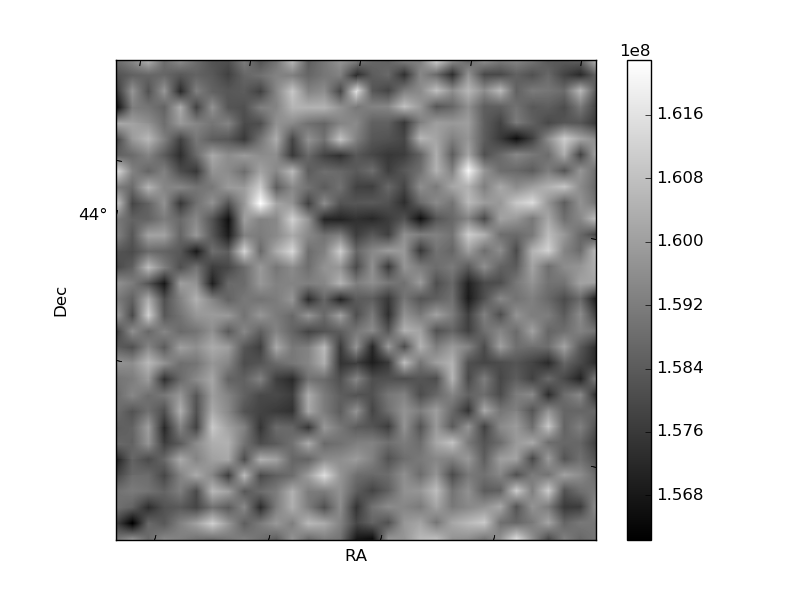
Histogram calculated using DETX and DETY for each event in the final _common_clean file
| Quadrant A | 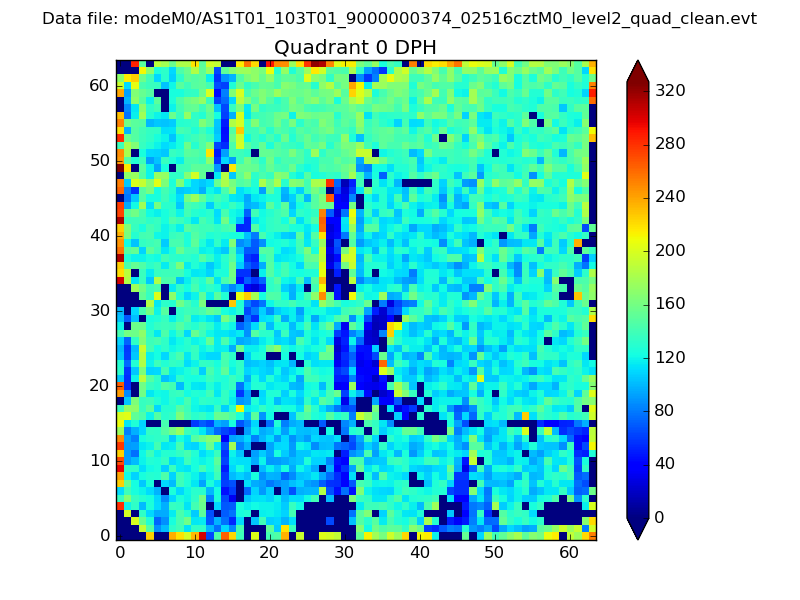 |
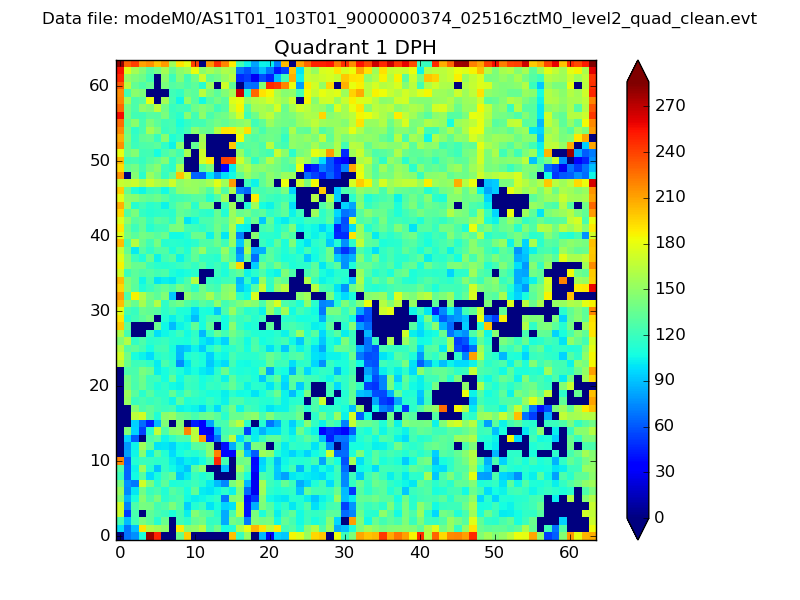 |
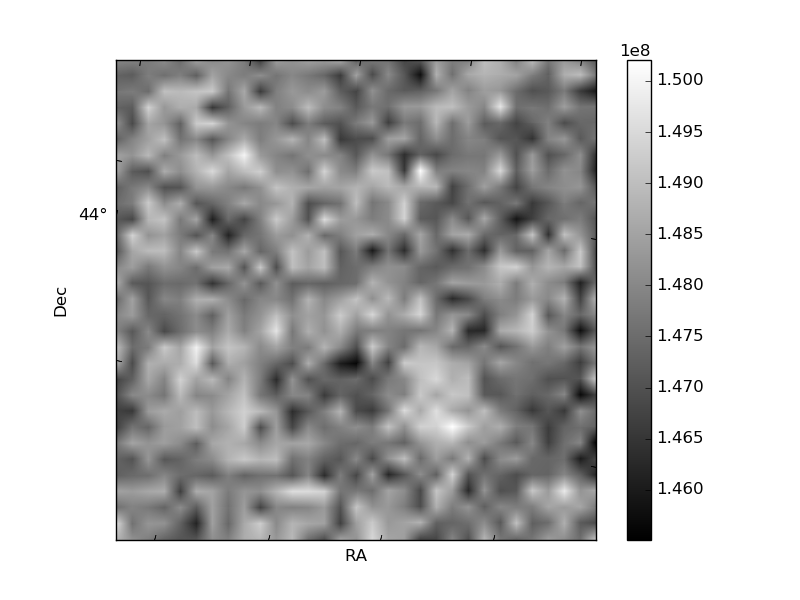
Quadrant B |
|---|---|---|---|
| Quadrant D | 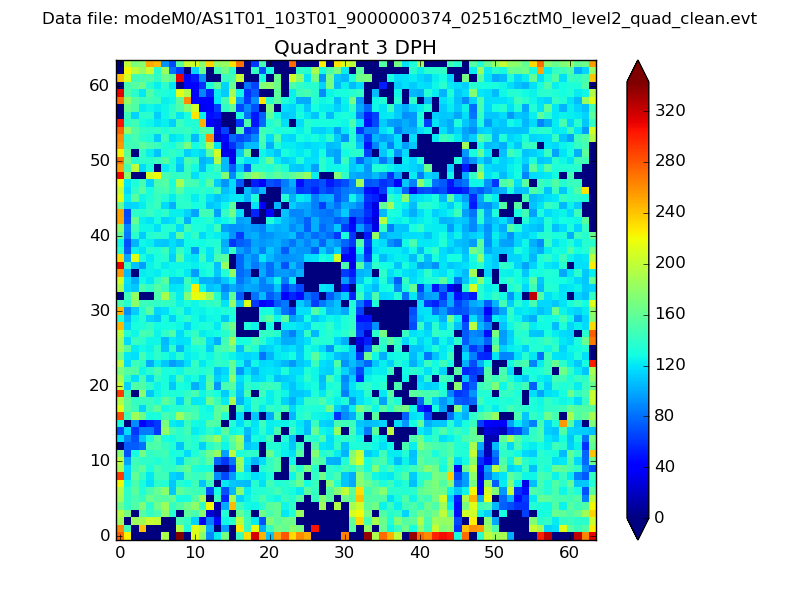 |
 |
Quadrant C |
| Plot type | Count rate plots | Images |
|---|---|---|
| Comparison with Poisson distribution Blue bars denote a histogram of data divided into 1 sec bins. Red curve is a Poisson curve with rate = median count rate of data. |
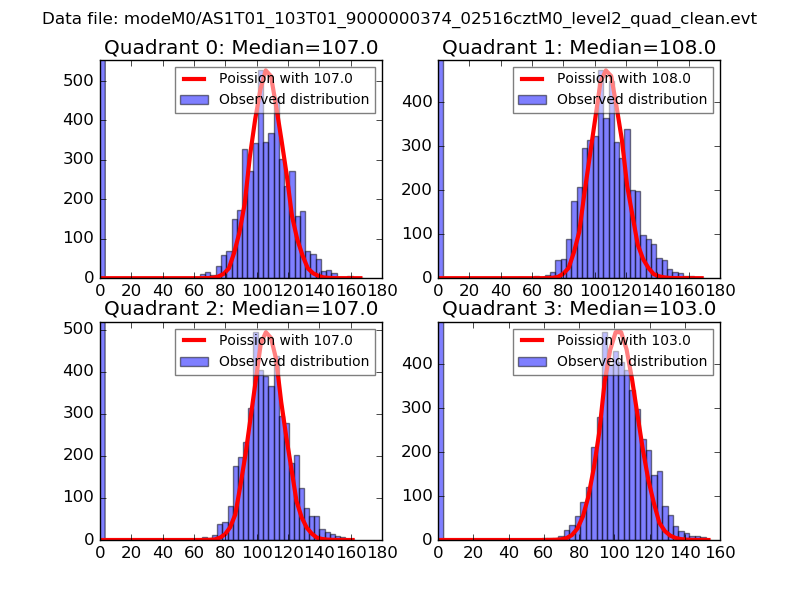 |
 |
| Quadrant-wise count rates Data is divided into 100 sec bins |
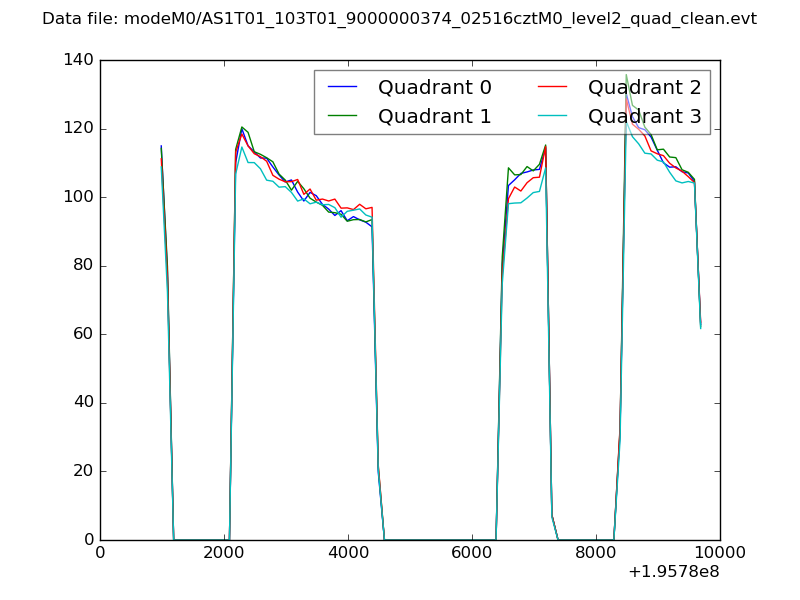 |
|
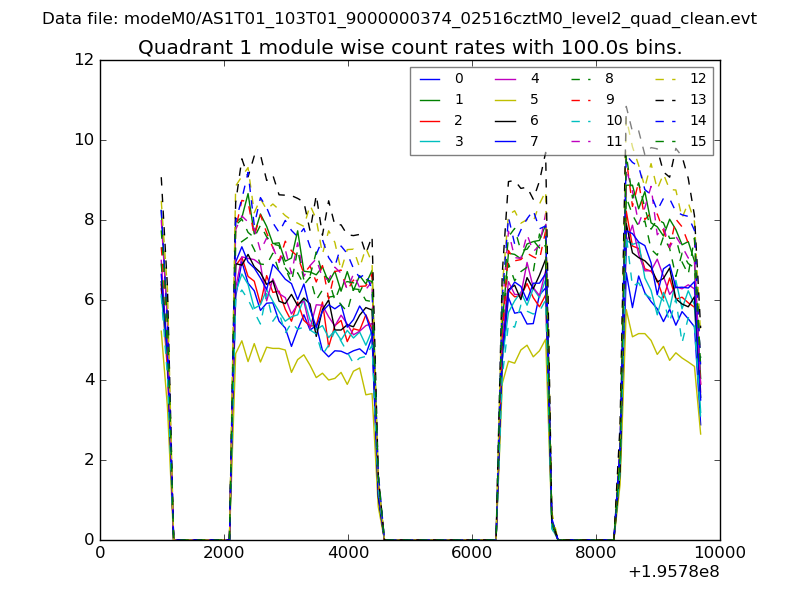
| Module-wise count rates for Quadrant A Data is divided into 100 sec bins |
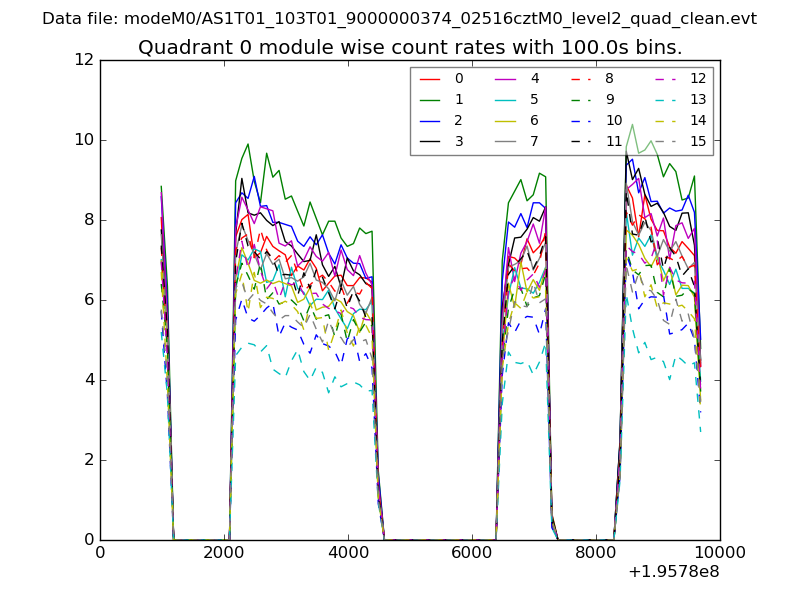 |
 |
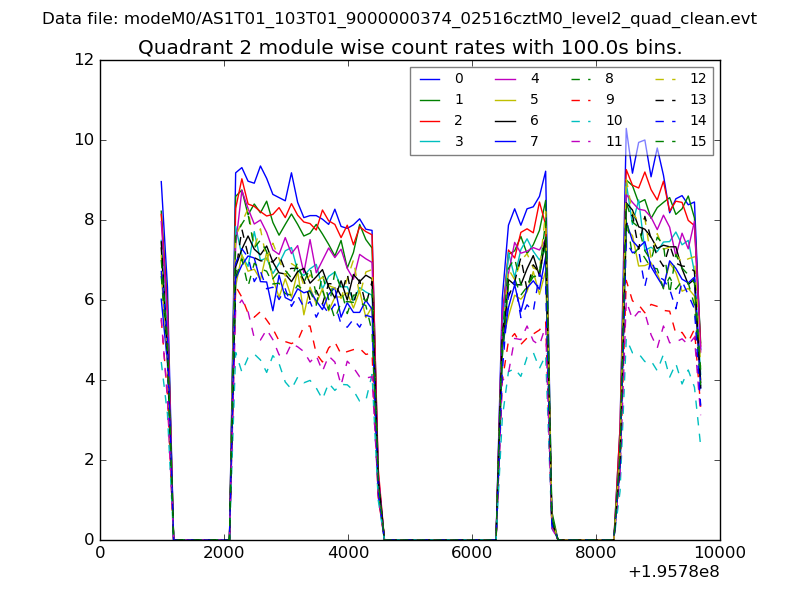
| Module-wise count rates for Quadrant B Data is divided into 100 sec bins |
 |
 |
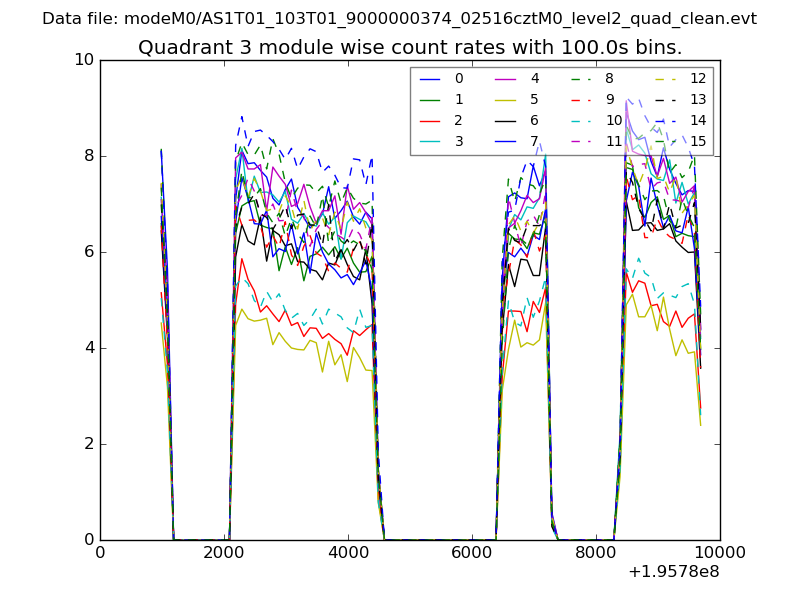
| Module-wise count rates for Quadrant C Data is divided into 100 sec bins |
 |
 |
| Module-wise count rates for Quadrant D Data is divided into 100 sec bins |
 |
 |
| Parameter | Plot |
|---|---|
| CZT HV Monitor | 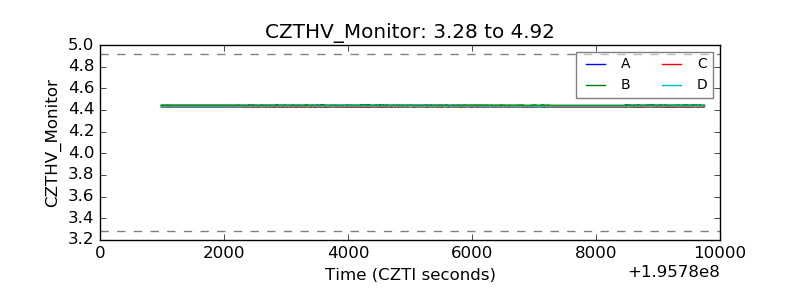 |
| D_VDD | 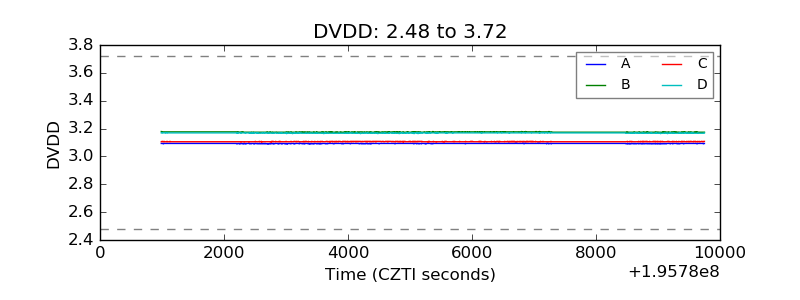 |
| Temperature 1 | 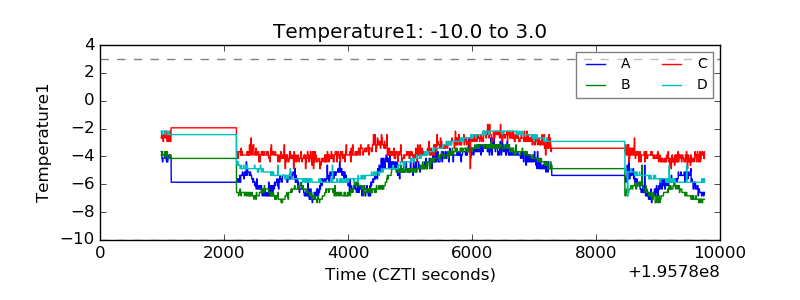 |
| Veto HV Monitor | 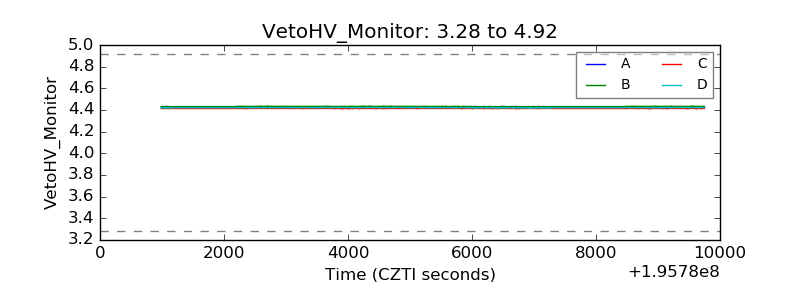 |
| Veto LLD | 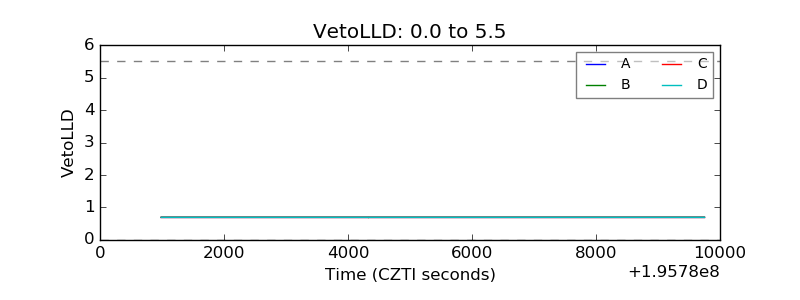 |
| Alpha Counter | 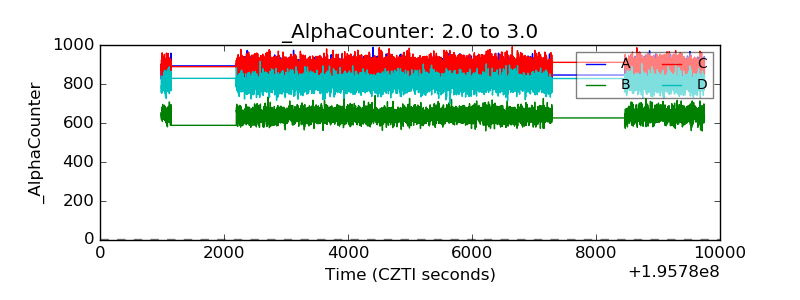 |
| _CPM_Rate | 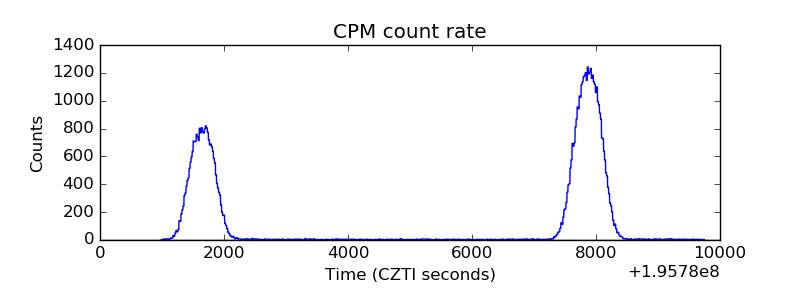 |
| CZT Counter | 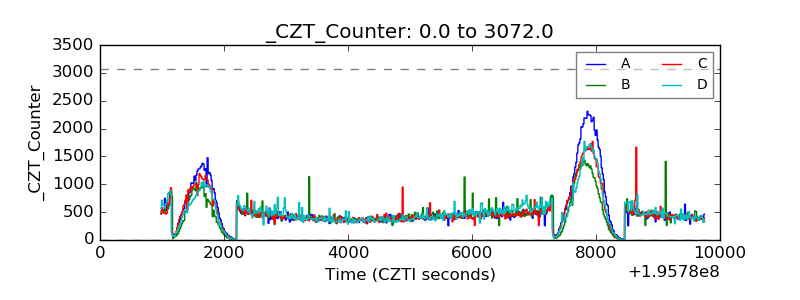 |
| +2.5 Volts monitor |  |
| +5 Volts monitor | 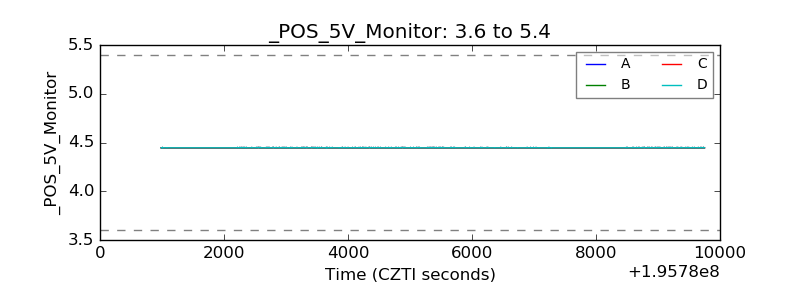 |
| _ROLL_ROT | 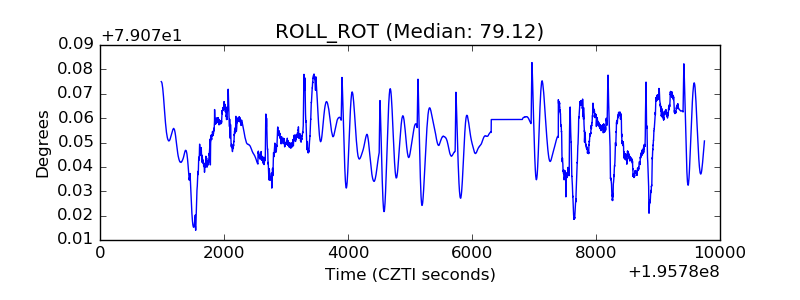 |
| _Roll_DEC | 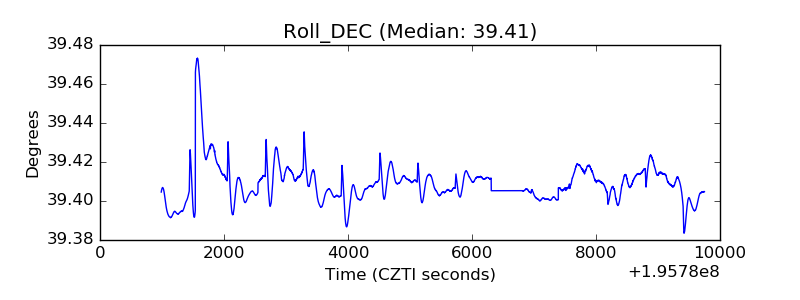 |
| _Roll_RA | 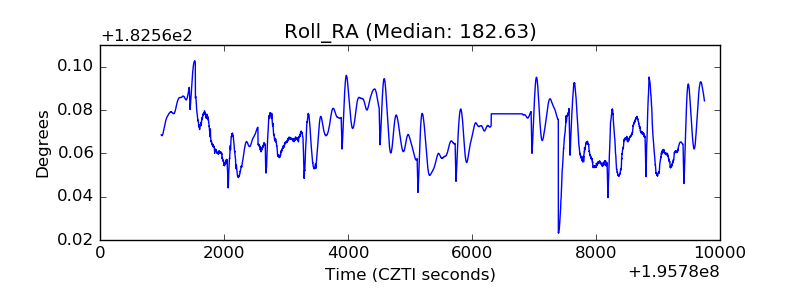 |
| Veto Counter | 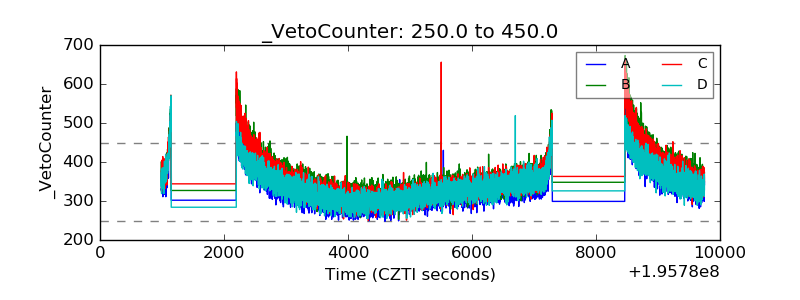 |