| Param | Original file | Final file |
|---|---|---|
| Filename | modeM0/AS1T01_103T01_9000000374_02521cztM0_level2.evt | modeM0/AS1T01_103T01_9000000374_02521cztM0_level2_quad_clean.evt |
| Size (bytes) | 655,436,160 | 61,770,240 |
| Size | 625.1 MB | 58.9 MB |
| Events in quadrant A | 3,309,065 | 369,691 |
| Events in quadrant B | 4,232,684 | 369,891 |
| Events in quadrant C | 3,115,644 | 366,654 |
| Events in quadrant D | 8,711,261 | 268,852 |
| Mode SS | |||
|---|---|---|---|
| Quadrant | BADHDUFLAG | Total packets | Discarded packets |
| A | 0 | 146 | 0 |
| B | 0 | 146 | 0 |
| C | 0 | 146 | 0 |
| D | 0 | 146 | 0 |
| Mode M9 | |||
|---|---|---|---|
| Quadrant | BADHDUFLAG | Total packets | Discarded packets |
| A | 0 | 12 | 0 |
| B | 0 | 12 | 0 |
| C | 0 | 12 | 0 |
| D | 0 | 13 | 0 |
| Mode M0 | |||
|---|---|---|---|
| Quadrant | BADHDUFLAG | Total packets | Discarded packets |
| A | 0 | 14954 | 3 |
| B | 0 | 17598 | 2 |
| C | 0 | 14580 | 2 |
| D | 0 | 30715 | 2 |
| Quadrant | Total seconds | Saturated seconds | Saturation percentage |
|---|---|---|---|
| A | 7089 | 166 | 2.341656% |
| B | 7089 | 229 | 3.230357% |
| C | 7089 | 105 | 1.481168% |
| D | 7089 | 2278 | 32.134293% |
Noise dominated data is calculated using 1-second bins in cleaned event files. If a bin has >2000 counts, and if more than 50% of those come from <1% of pixels, then it is considered to be noise-dominated and hence unusable.
| Quadrant | # 1 sec bins | Bins with >0 counts | Bins with >2000 counts | High rate bins dominated by noise | Noise dominated (total time) | Noise dominated (detector-on time) | Marked lightcurve |
|---|---|---|---|---|---|---|---|
| A | 7834 | 7090 | 1 | 1 | 0.01% | 0.01% | 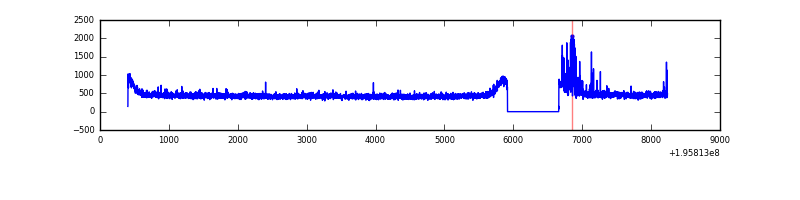 |
| B | 7834 | 7090 | 7 | 7 | 0.09% | 0.10% | 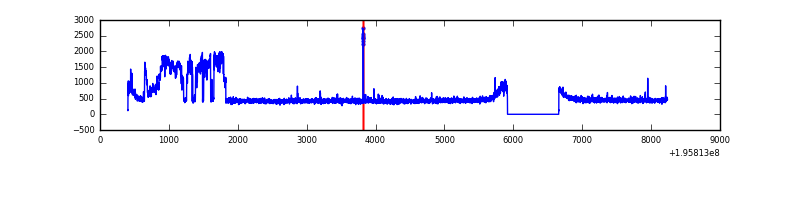 |
| C | 7834 | 7090 | 1 | 1 | 0.01% | 0.01% | 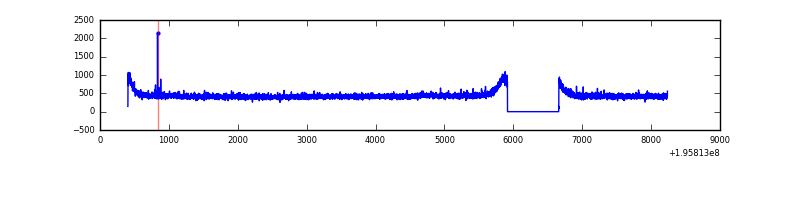 |
| D | 7834 | 7089 | 1544 | 1544 | 19.71% | 21.78% | 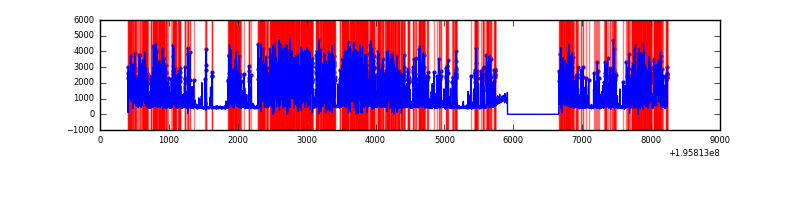 |
Top three noisy pixels from each quadrant. If the there are fewer than three noisy pixels in the level2.evt file, extra rows are filled as -1
| Pixel properties | Quadrant properties | ||||||
|---|---|---|---|---|---|---|---|
| Quadrant | DetID | PixID | Counts | Sigma | Mean | Median | Sigma |
| A | 15 | 236 | 138445 | 809.51 | 820 | 799 | 170.0 |
| A | 0 | 226 | 9416 | 50.68 | 820 | 799 | 170.0 |
| A | 12 | 194 | 8932 | 47.83 | 820 | 799 | 170.0 |
| B | 6 | 36 | 981564 | 6128.17 | 824 | 803 | 160.0 |
| B | 7 | 205 | 44342 | 272.05 | 824 | 803 | 160.0 |
| B | 5 | 251 | 13406 | 78.75 | 824 | 803 | 160.0 |
| C | 12 | 4 | 7744 | 37.4 | 791 | 792 | 185.9 |
| C | 13 | 61 | 7106 | 33.97 | 791 | 792 | 185.9 |
| C | 1 | 3 | 5972 | 27.87 | 791 | 792 | 185.9 |
| D | 11 | 130 | 6009557 | 39547.97 | 638 | 622 | 151.9 |
| D | 11 | 131 | 204108 | 1339.25 | 638 | 622 | 151.9 |
| D | 7 | 67 | 33928 | 219.2 | 638 | 622 | 151.9 |
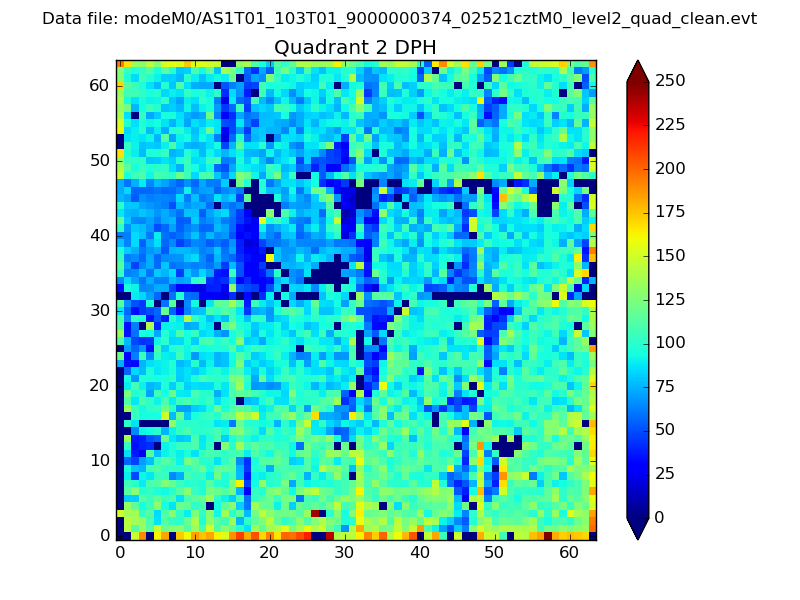
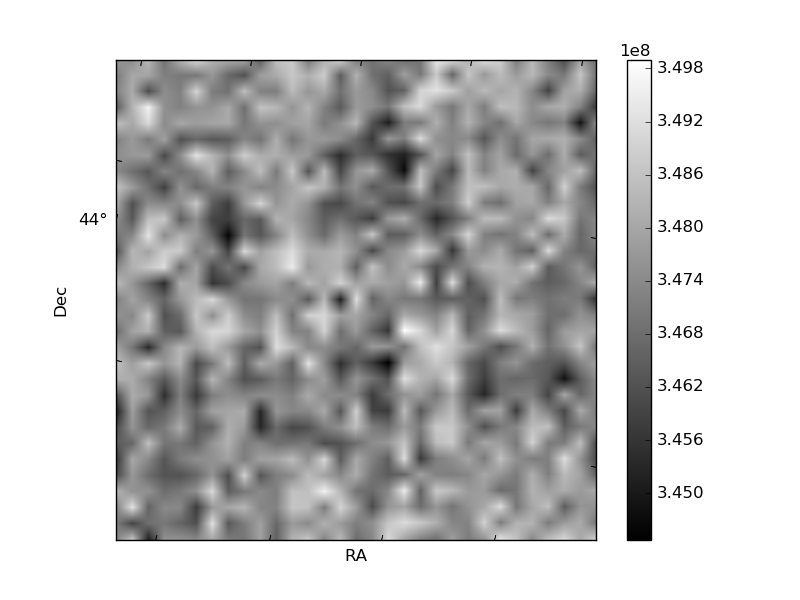
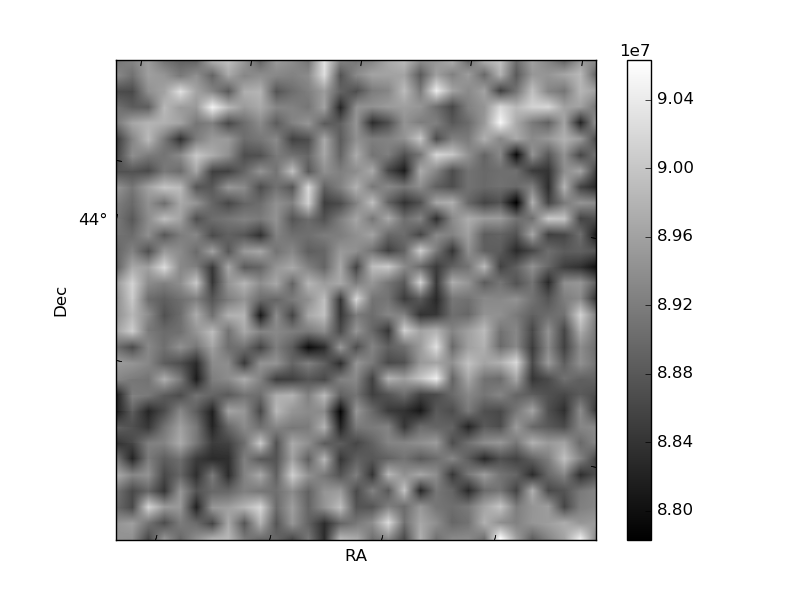
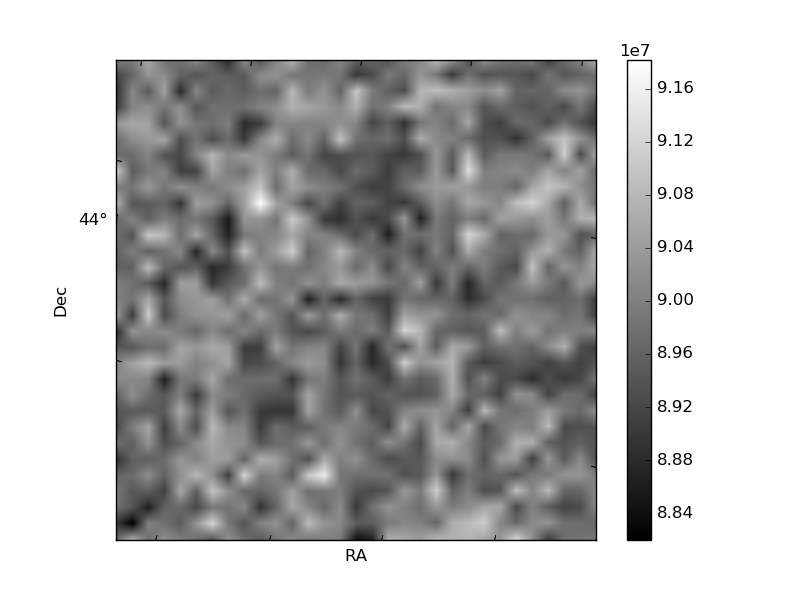
Histogram calculated using DETX and DETY for each event in the final _common_clean file
| Quadrant A | 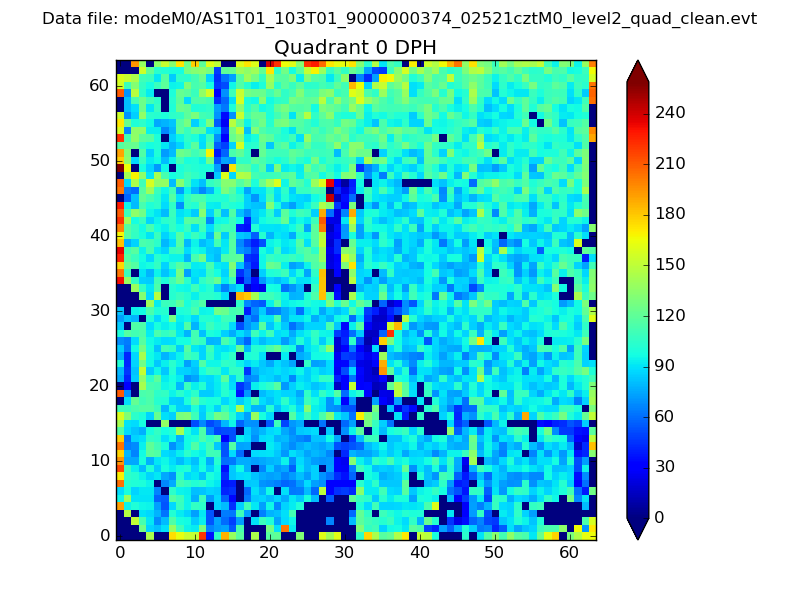 |
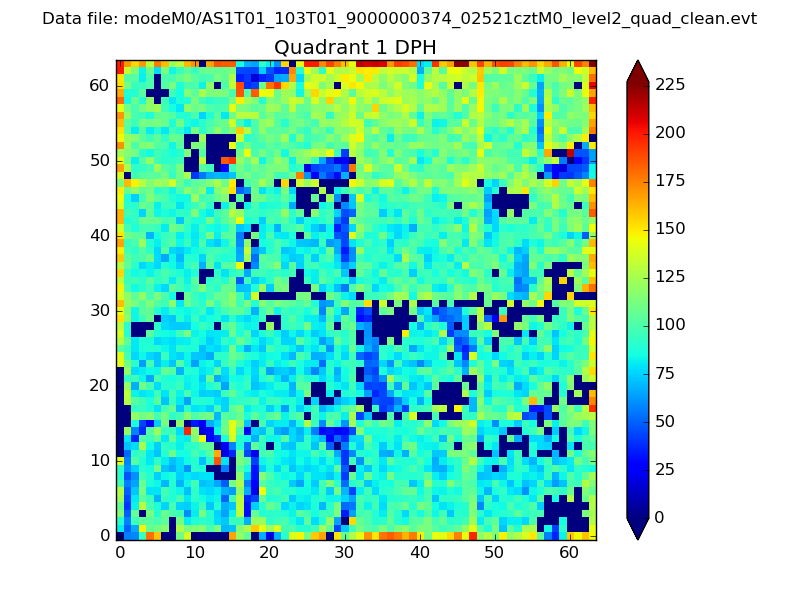 |
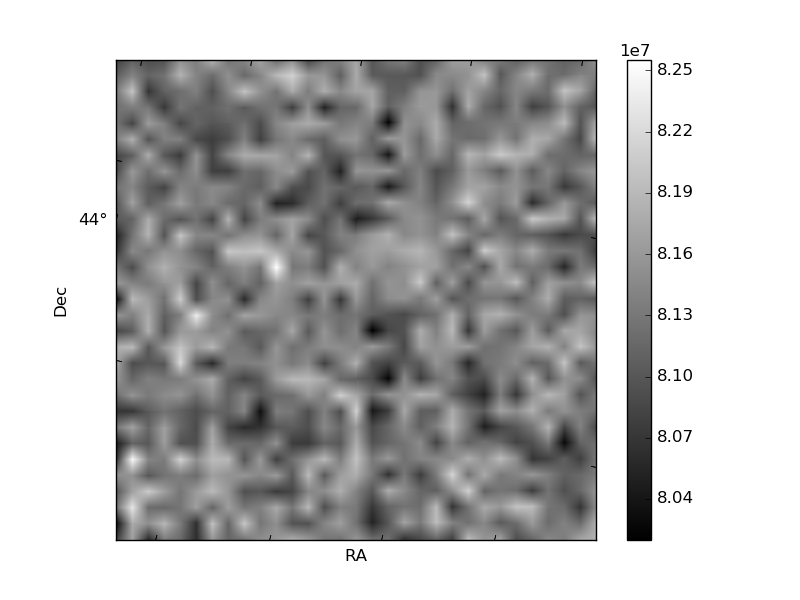
Quadrant B |
|---|---|---|---|
| Quadrant D | 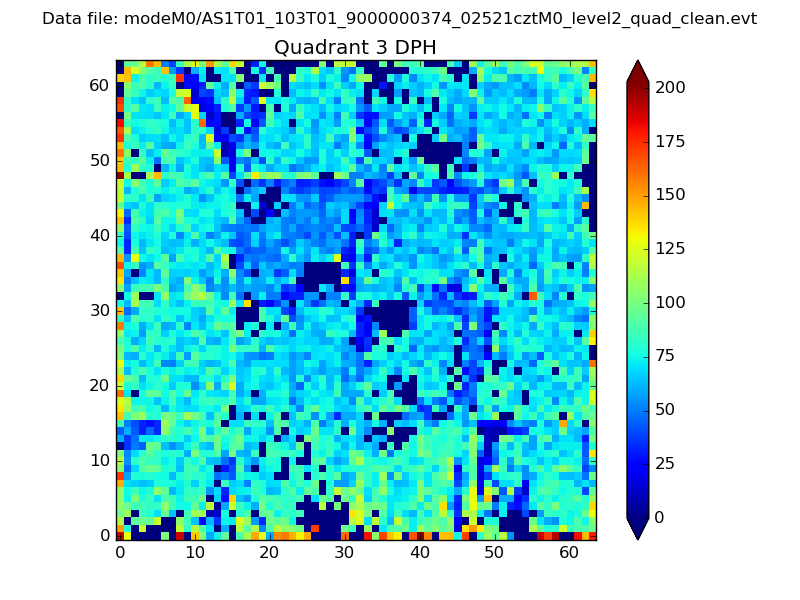 |
 |
Quadrant C |
| Plot type | Count rate plots | Images |
|---|---|---|
| Comparison with Poisson distribution Blue bars denote a histogram of data divided into 1 sec bins. Red curve is a Poisson curve with rate = median count rate of data. |
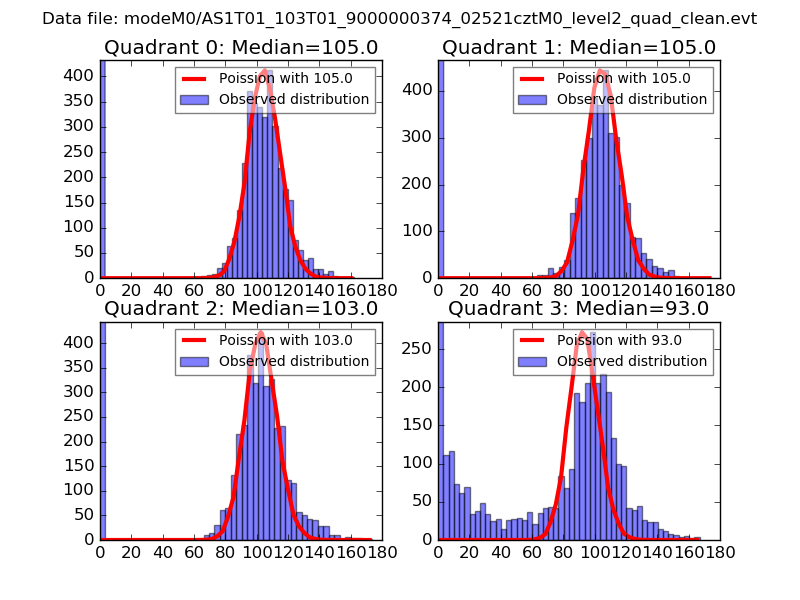 |
 |
| Quadrant-wise count rates Data is divided into 100 sec bins |
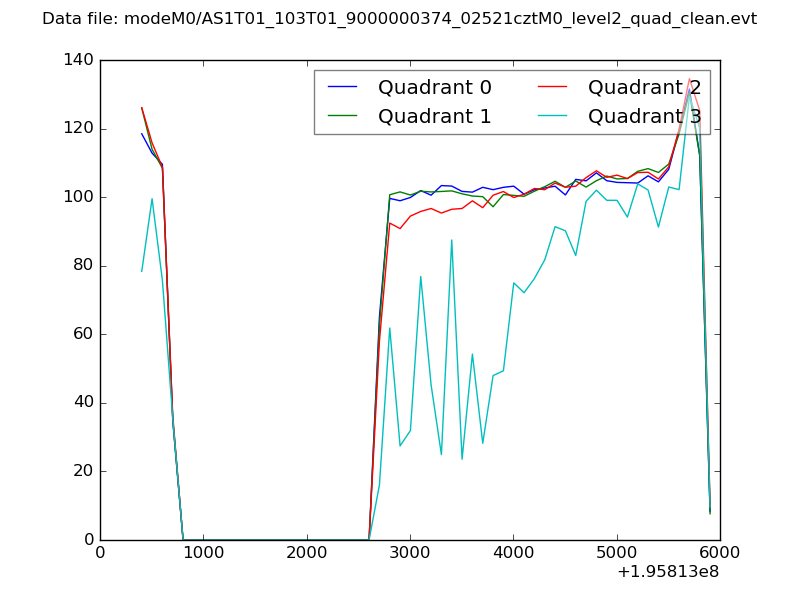 |
|
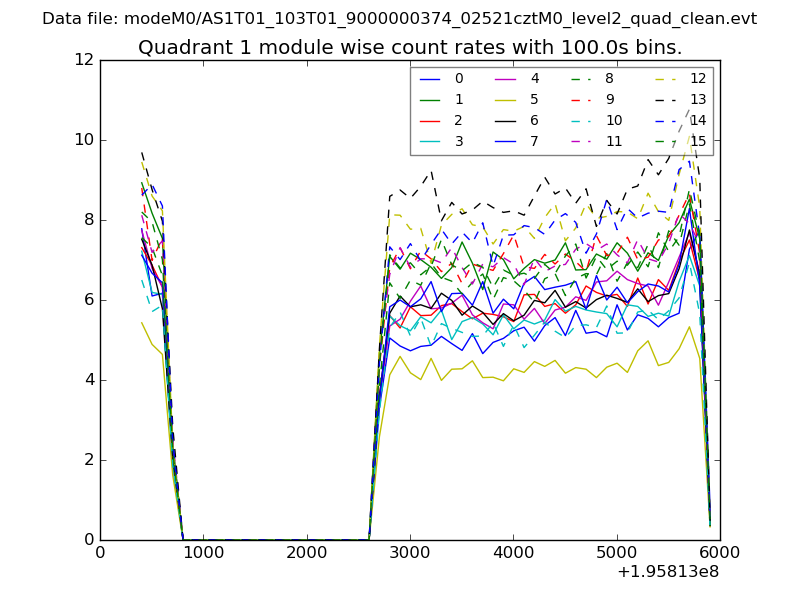
| Module-wise count rates for Quadrant A Data is divided into 100 sec bins |
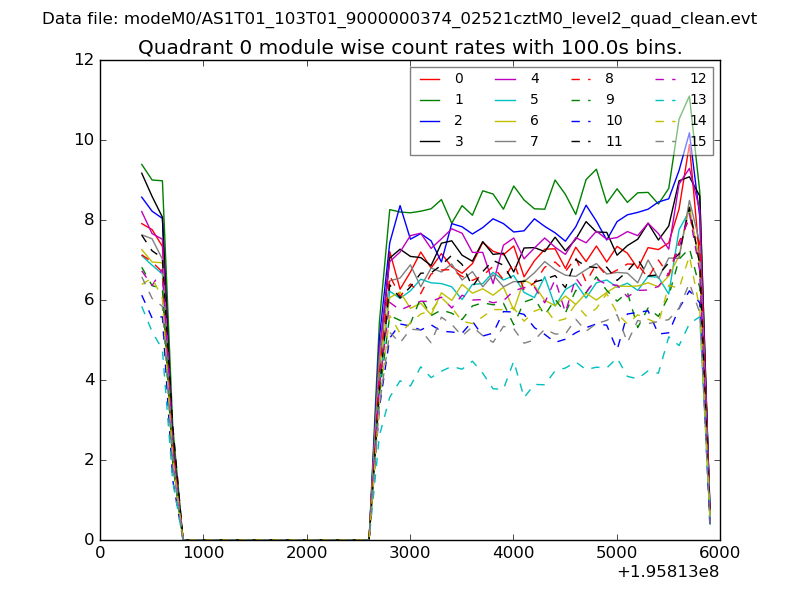 |
 |
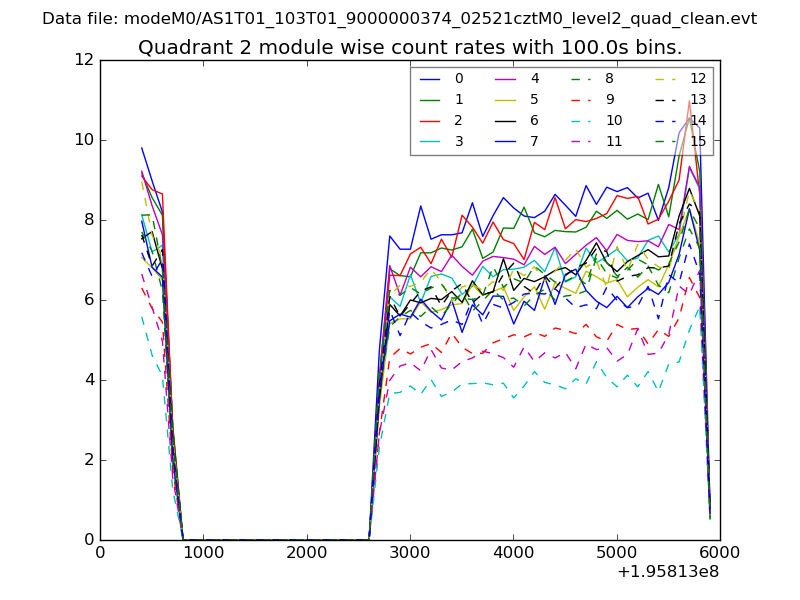
| Module-wise count rates for Quadrant B Data is divided into 100 sec bins |
 |
 |
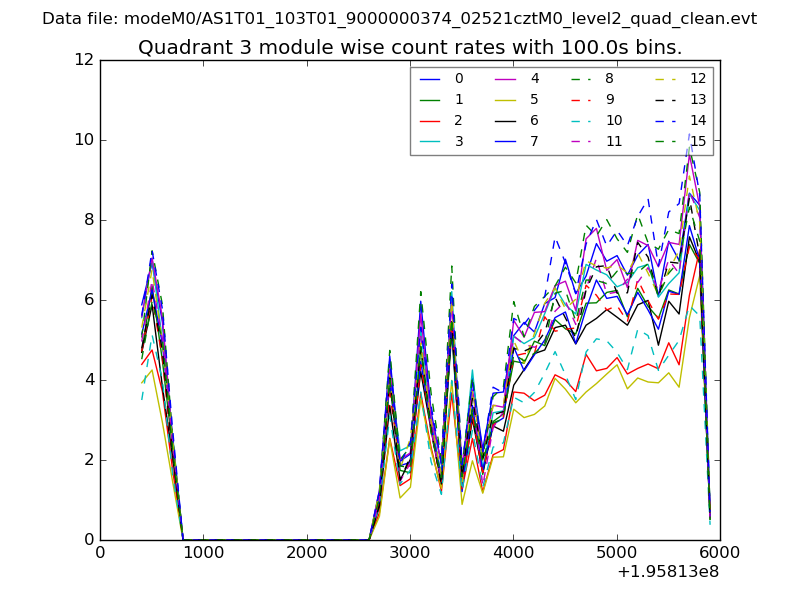
| Module-wise count rates for Quadrant C Data is divided into 100 sec bins |
 |
 |
| Module-wise count rates for Quadrant D Data is divided into 100 sec bins |
 |
 |
| Parameter | Plot |
|---|---|
| CZT HV Monitor | 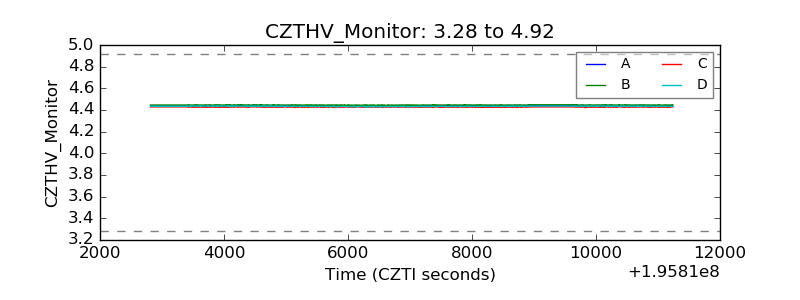 |
| D_VDD | 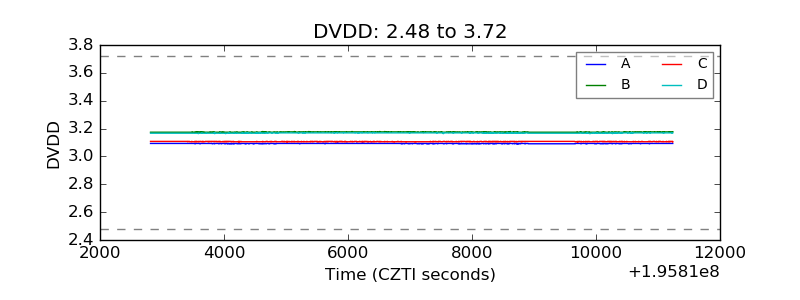 |
| Temperature 1 | 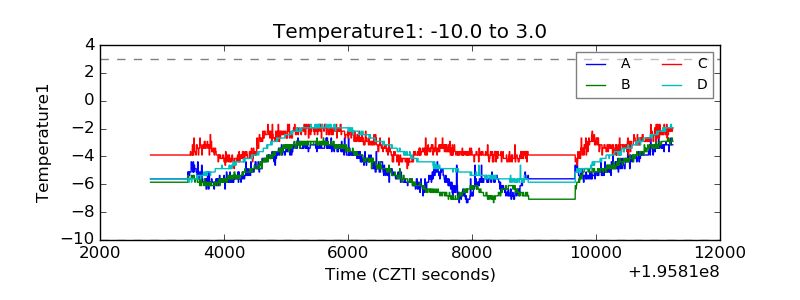 |
| Veto HV Monitor | 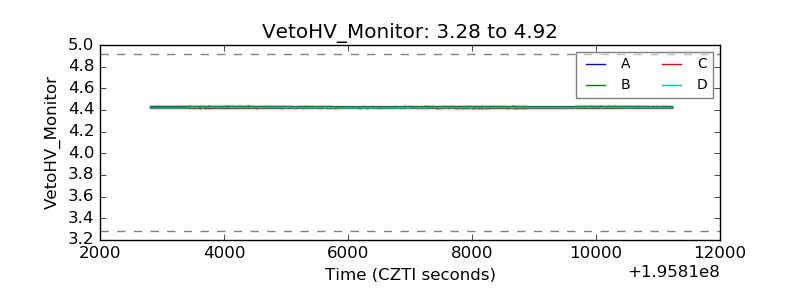 |
| Veto LLD | 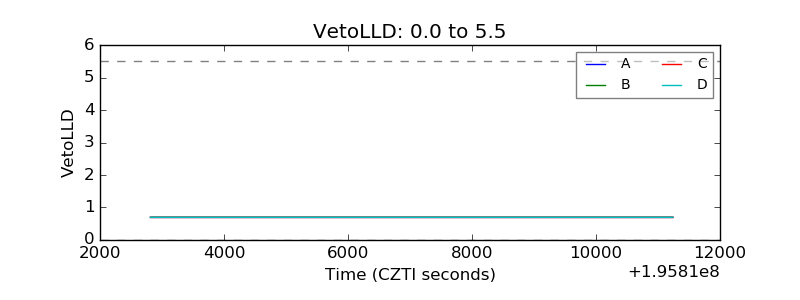 |
| Alpha Counter | 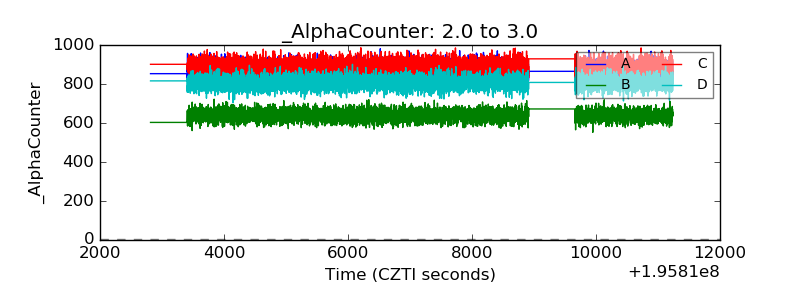 |
| _CPM_Rate | 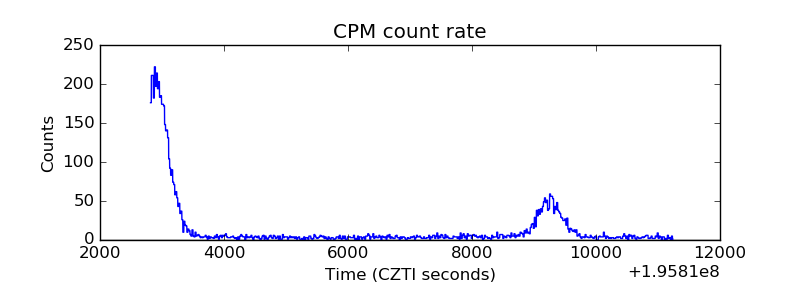 |
| CZT Counter | 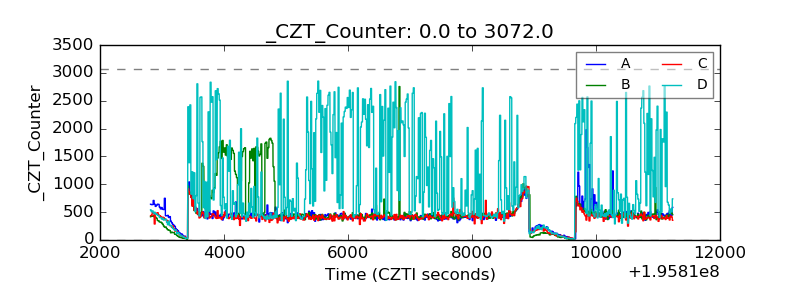 |
| +2.5 Volts monitor | 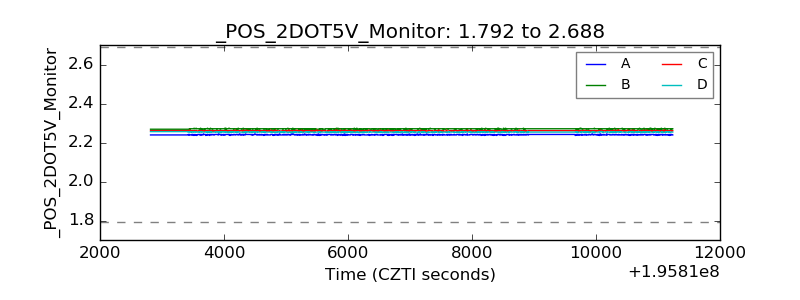 |
| +5 Volts monitor |  |
| _ROLL_ROT | 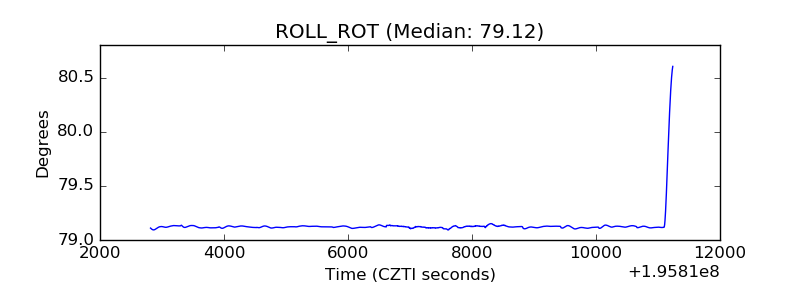 |
| _Roll_DEC | 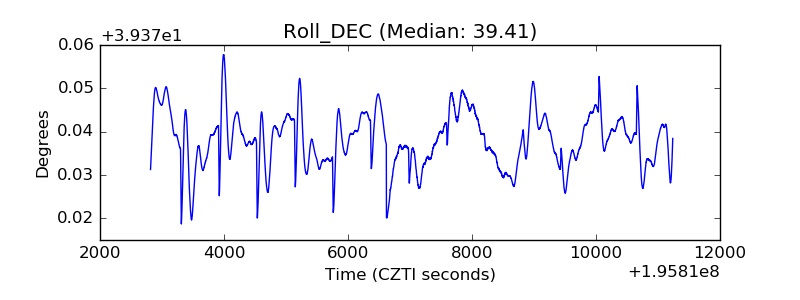 |
| _Roll_RA | 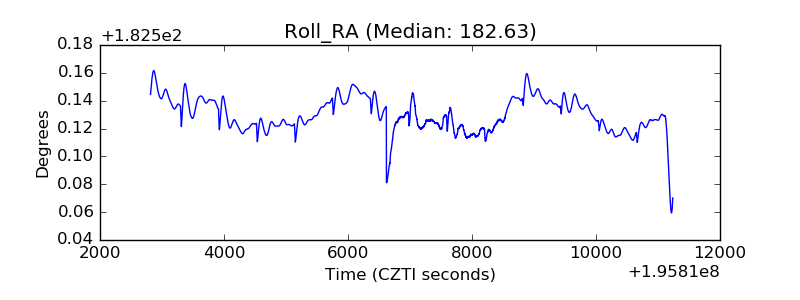 |
| Veto Counter | 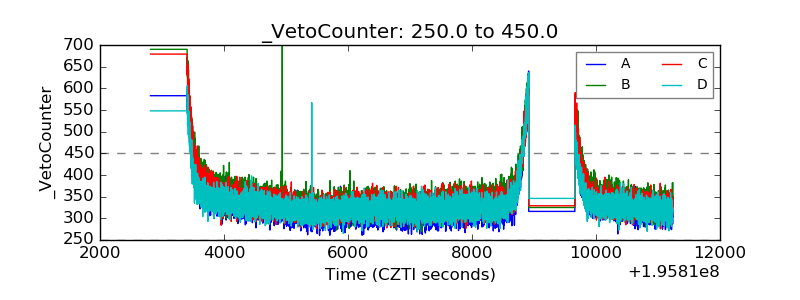 |