| Param | Original file | Final file |
|---|---|---|
| Filename | modeM0/AS1T01_103T01_9000000374_02522cztM0_level2.evt | modeM0/AS1T01_103T01_9000000374_02522cztM0_level2_quad_clean.evt |
| Size (bytes) | 717,886,080 | 64,209,600 |
| Size | 684.6 MB | 61.2 MB |
| Events in quadrant A | 3,641,807 | 391,941 |
| Events in quadrant B | 3,559,161 | 391,799 |
| Events in quadrant C | 3,714,026 | 388,952 |
| Events in quadrant D | 10,308,802 | 239,926 |
| Mode SS | |||
|---|---|---|---|
| Quadrant | BADHDUFLAG | Total packets | Discarded packets |
| A | 0 | 154 | 0 |
| B | 0 | 154 | 0 |
| C | 0 | 154 | 0 |
| D | 0 | 154 | 0 |
| Mode M9 | |||
|---|---|---|---|
| Quadrant | BADHDUFLAG | Total packets | Discarded packets |
| A | 0 | 4 | 0 |
| B | 0 | 4 | 0 |
| C | 0 | 4 | 0 |
| D | 0 | 5 | 0 |
| Mode M0 | |||
|---|---|---|---|
| Quadrant | BADHDUFLAG | Total packets | Discarded packets |
| A | 0 | 16406 | 4 |
| B | 0 | 15994 | 3 |
| C | 0 | 16779 | 3 |
| D | 0 | 35806 | 3 |
| Quadrant | Total seconds | Saturated seconds | Saturation percentage |
|---|---|---|---|
| A | 7625 | 320 | 4.196721% |
| B | 7625 | 284 | 3.724590% |
| C | 7625 | 327 | 4.288525% |
| D | 7625 | 3078 | 40.367213% |
Noise dominated data is calculated using 1-second bins in cleaned event files. If a bin has >2000 counts, and if more than 50% of those come from <1% of pixels, then it is considered to be noise-dominated and hence unusable.
| Quadrant | # 1 sec bins | Bins with >0 counts | Bins with >2000 counts | High rate bins dominated by noise | Noise dominated (total time) | Noise dominated (detector-on time) | Marked lightcurve |
|---|---|---|---|---|---|---|---|
| A | 7800 | 7627 | 10 | 10 | 0.13% | 0.13% | 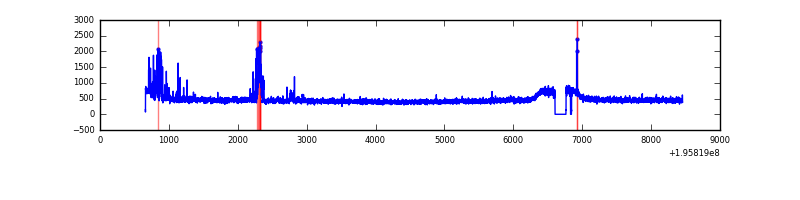 |
| B | 7800 | 7627 | 1 | 1 | 0.01% | 0.01% | 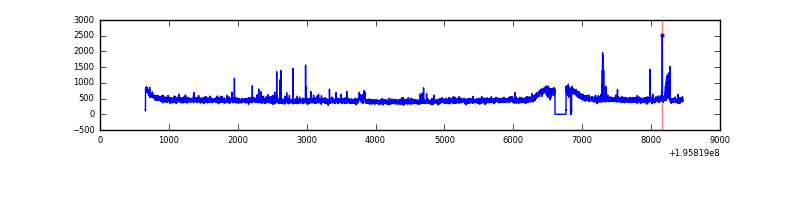 |
| C | 7800 | 7627 | 85 | 85 | 1.09% | 1.11% | 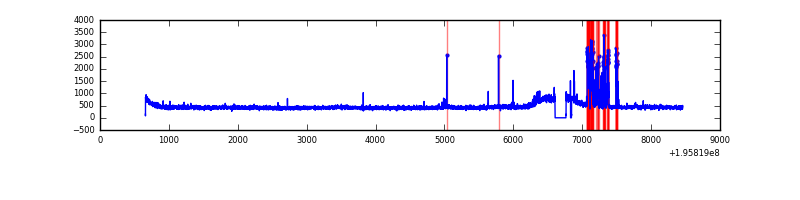 |
| D | 7800 | 7626 | 2039 | 2039 | 26.14% | 26.74% | 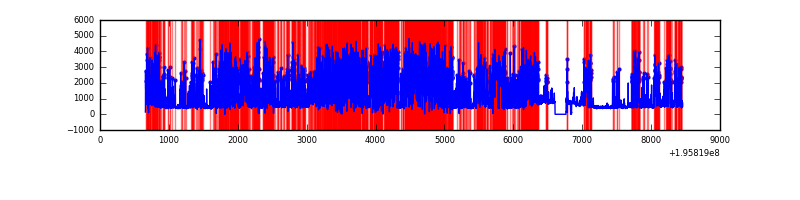 |
Top three noisy pixels from each quadrant. If the there are fewer than three noisy pixels in the level2.evt file, extra rows are filled as -1
| Pixel properties | Quadrant properties | ||||||
|---|---|---|---|---|---|---|---|
| Quadrant | DetID | PixID | Counts | Sigma | Mean | Median | Sigma |
| A | 15 | 236 | 237539 | 1303.47 | 884 | 864 | 181.6 |
| A | 12 | 194 | 9655 | 48.42 | 884 | 864 | 181.6 |
| A | 0 | 226 | 9250 | 46.19 | 884 | 864 | 181.6 |
| B | 7 | 205 | 78039 | 443.24 | 895 | 868 | 174.1 |
| B | 12 | 111 | 14192 | 76.53 | 895 | 868 | 174.1 |
| B | 5 | 172 | 14017 | 75.52 | 895 | 868 | 174.1 |
| C | 14 | 223 | 355400 | 1770.07 | 854 | 852 | 200.3 |
| C | 10 | 200 | 8699 | 39.18 | 854 | 852 | 200.3 |
| C | 13 | 61 | 7740 | 34.39 | 854 | 852 | 200.3 |
| D | 11 | 130 | 6971250 | 44273.72 | 663 | 643 | 157.4 |
| D | 2 | 209 | 429365 | 2723.02 | 663 | 643 | 157.4 |
| D | 11 | 131 | 274609 | 1740.09 | 663 | 643 | 157.4 |
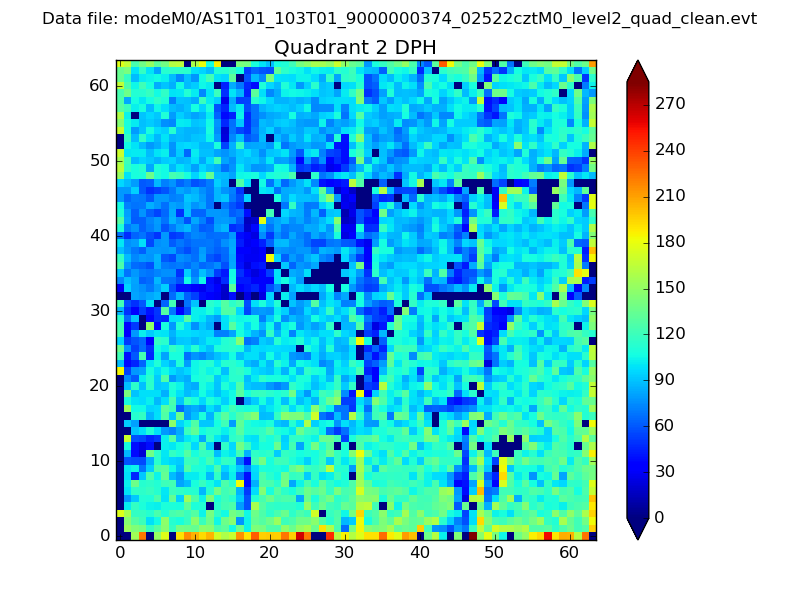
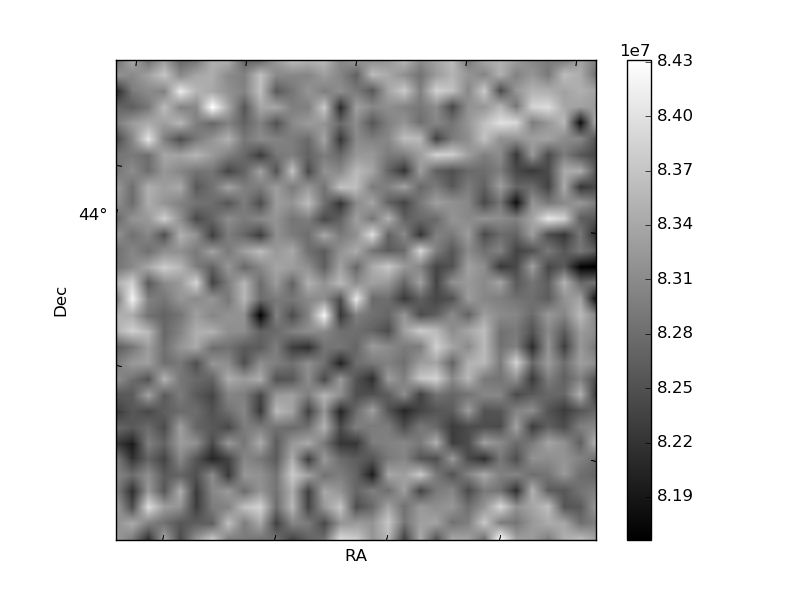
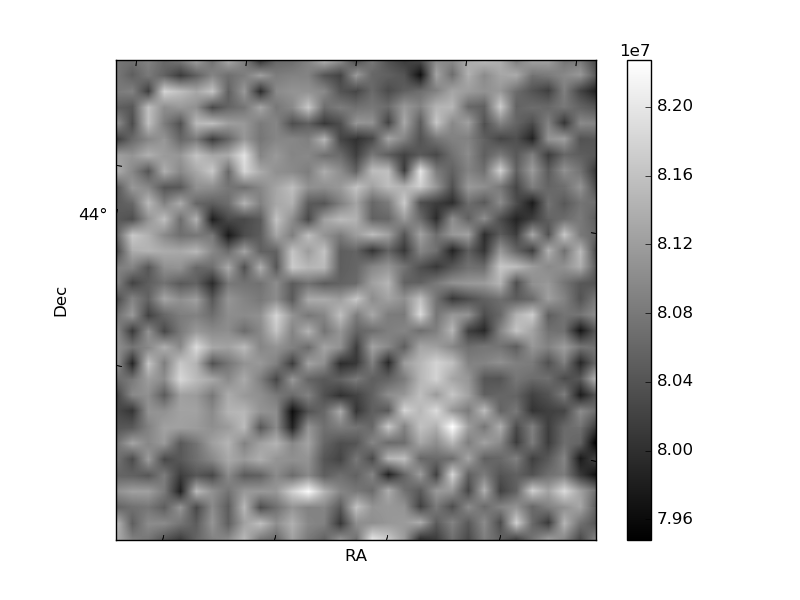
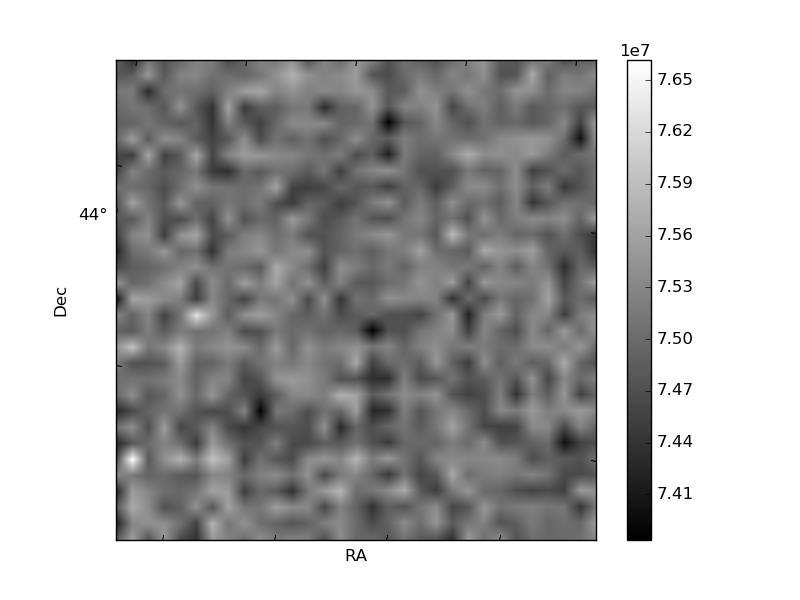
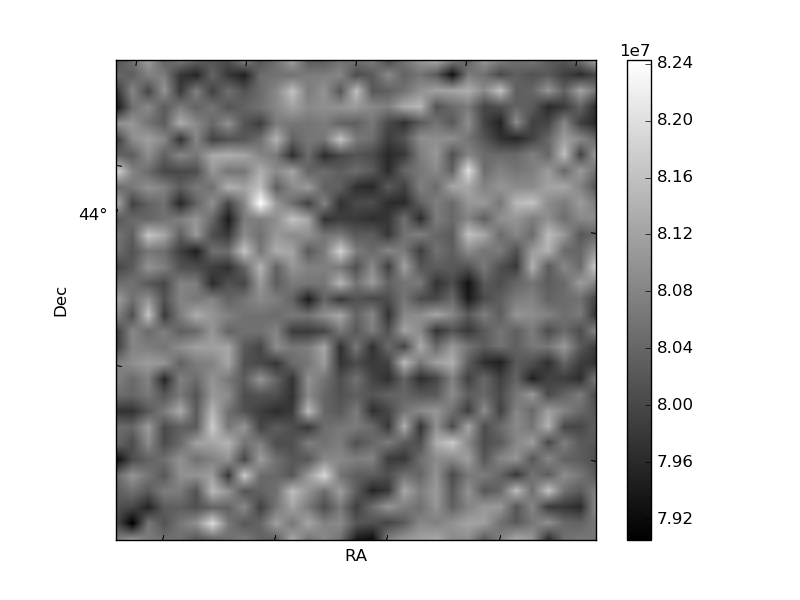
Histogram calculated using DETX and DETY for each event in the final _common_clean file
| Quadrant A | 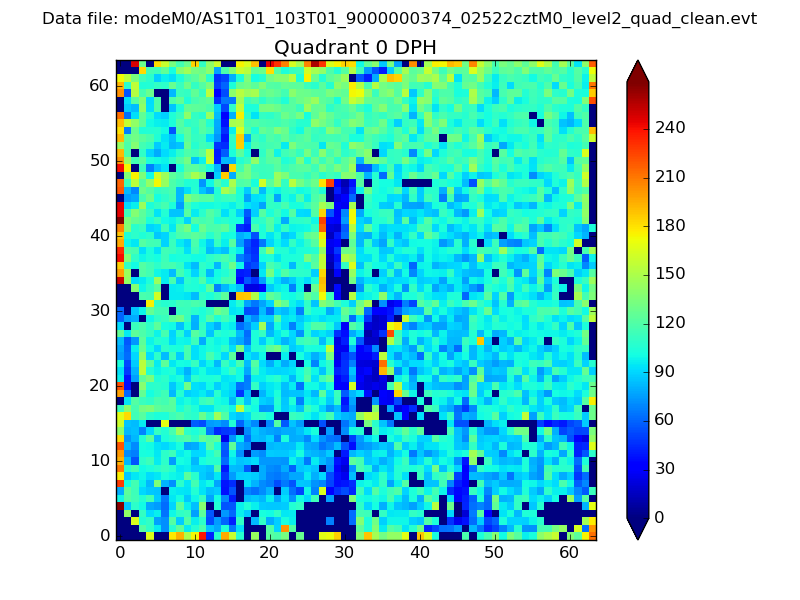 |
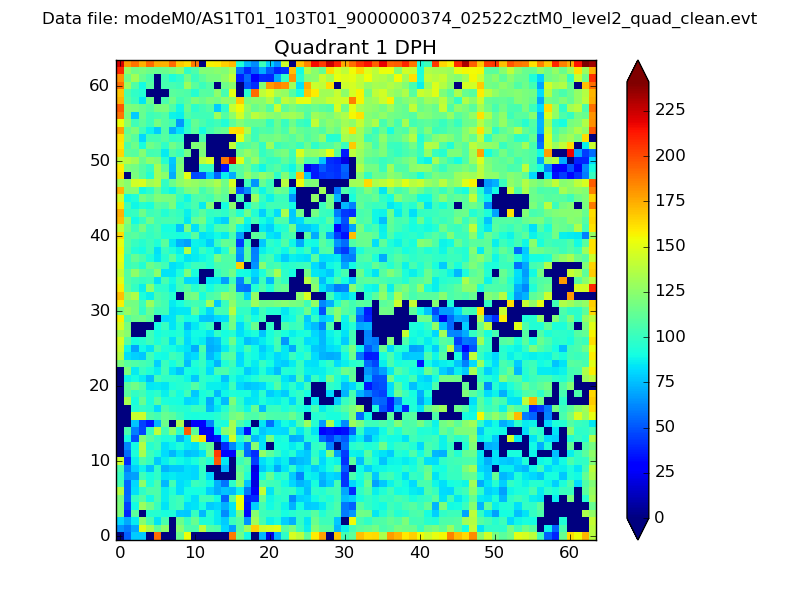 |
Quadrant B |
|---|---|---|---|
| Quadrant D | 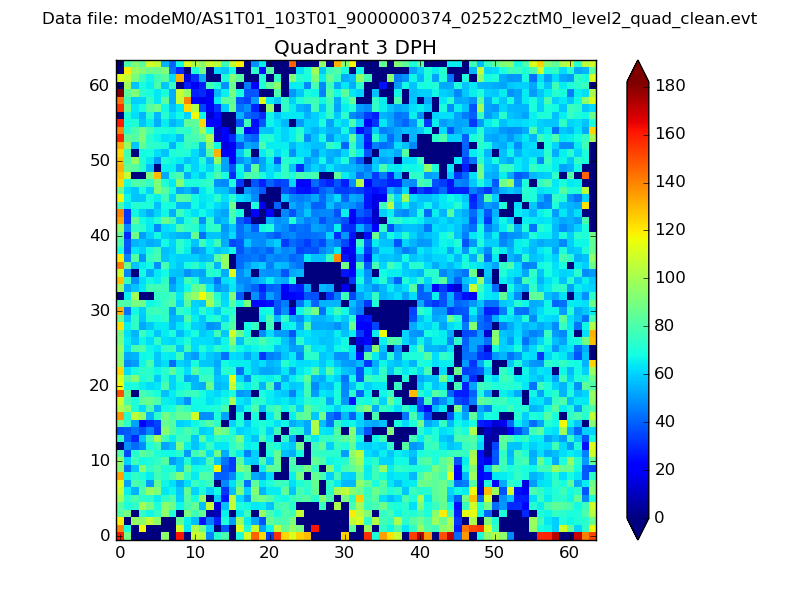 |
 |
Quadrant C |
| Plot type | Count rate plots | Images |
|---|---|---|
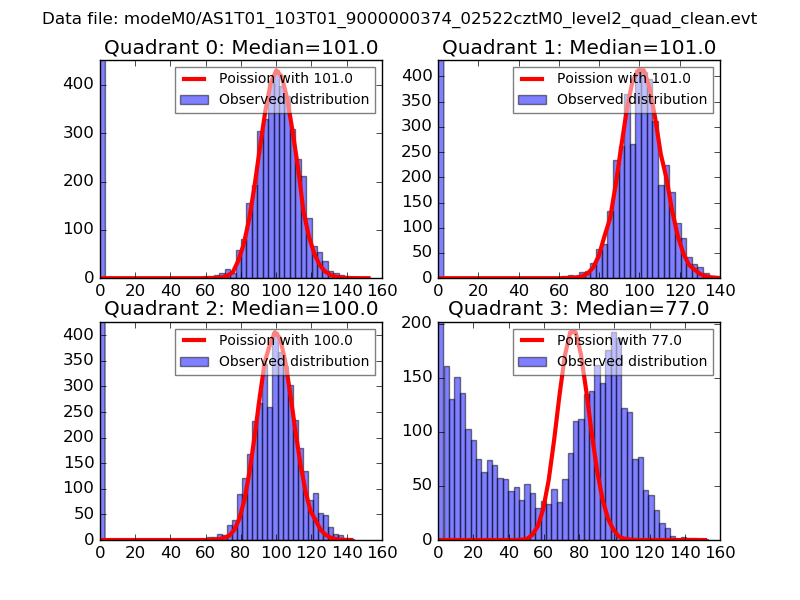
| Comparison with Poisson distribution Blue bars denote a histogram of data divided into 1 sec bins. Red curve is a Poisson curve with rate = median count rate of data. |
 |
 |
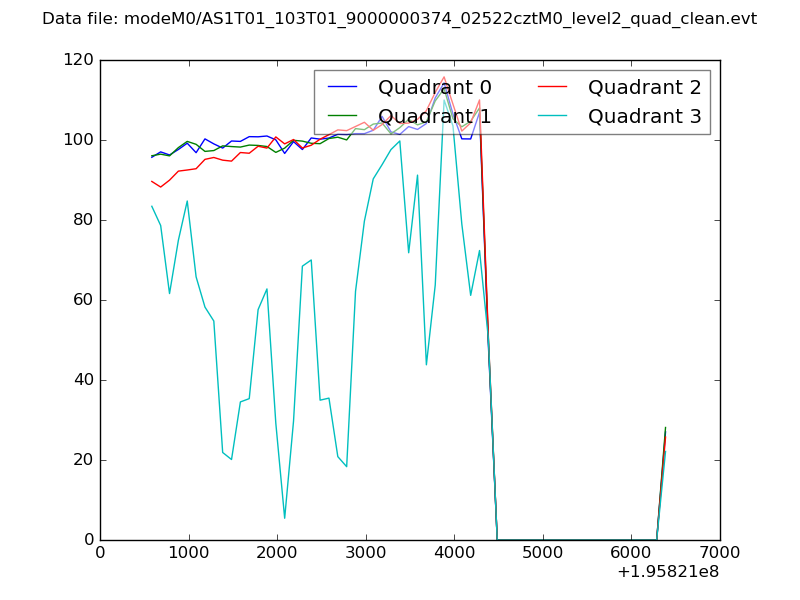
| Quadrant-wise count rates Data is divided into 100 sec bins |
 |
|
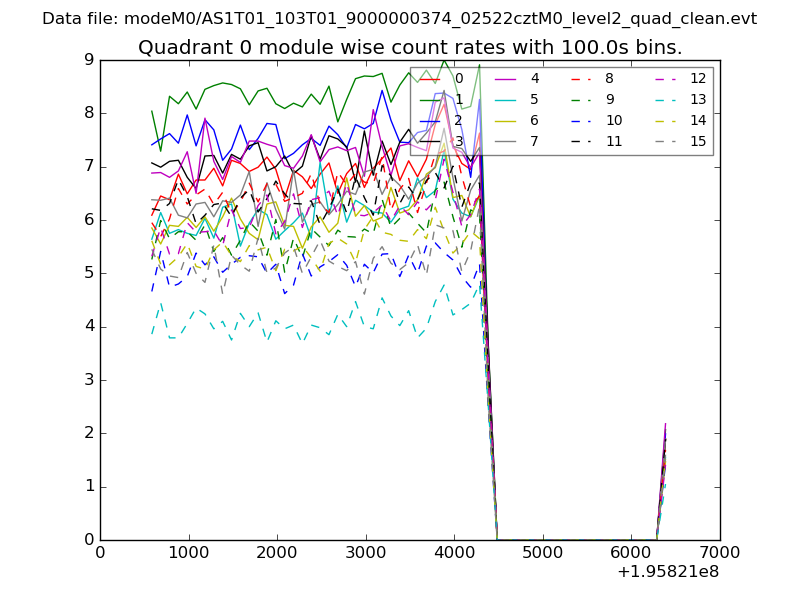
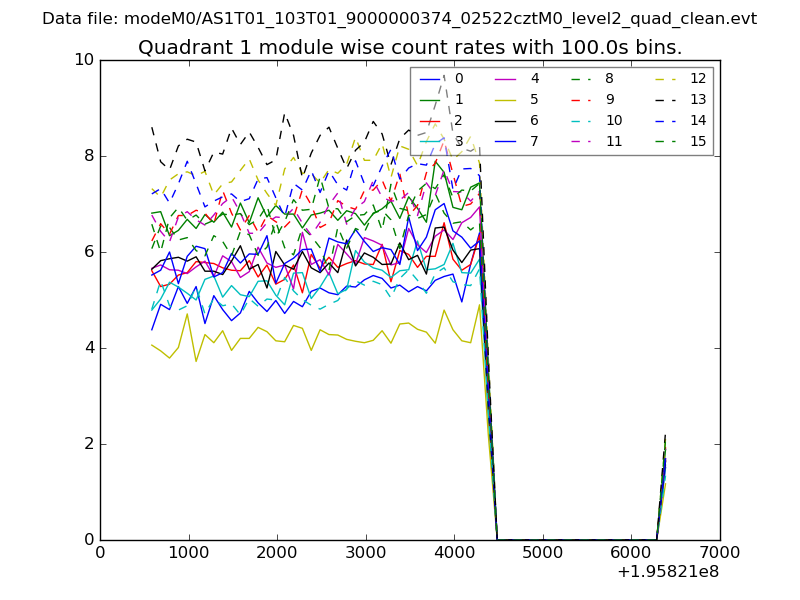
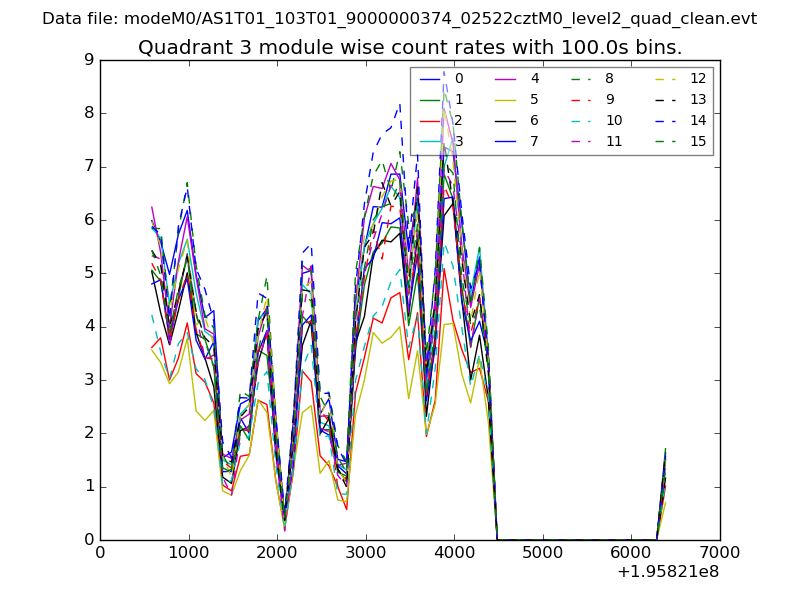
| Module-wise count rates for Quadrant A Data is divided into 100 sec bins |
 |
 |
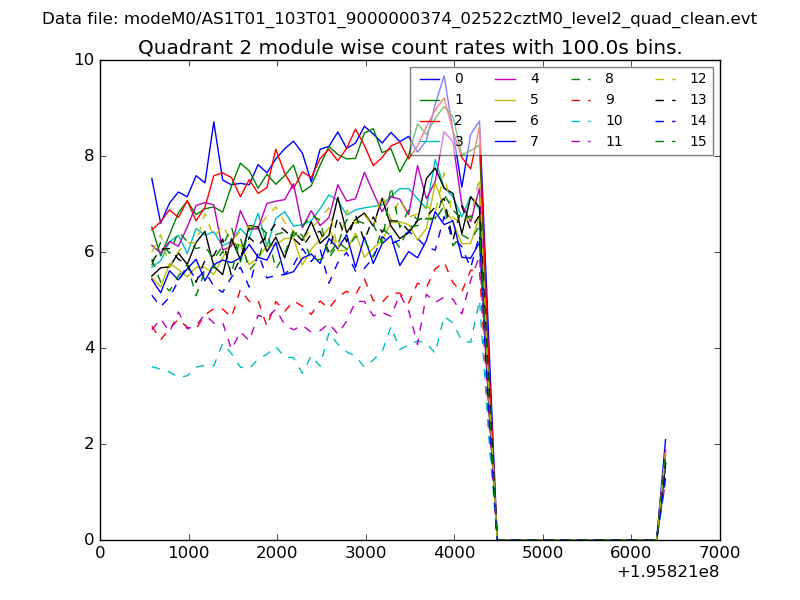
| Module-wise count rates for Quadrant B Data is divided into 100 sec bins |
 |
 |
| Module-wise count rates for Quadrant C Data is divided into 100 sec bins |
 |
 |
| Module-wise count rates for Quadrant D Data is divided into 100 sec bins |
 |
 |
| Parameter | Plot |
|---|---|
| CZT HV Monitor | 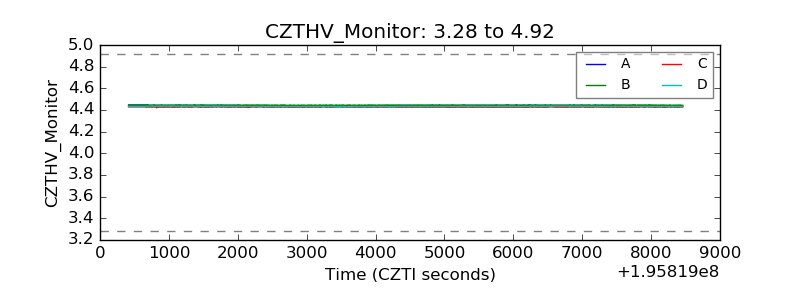 |
| D_VDD | 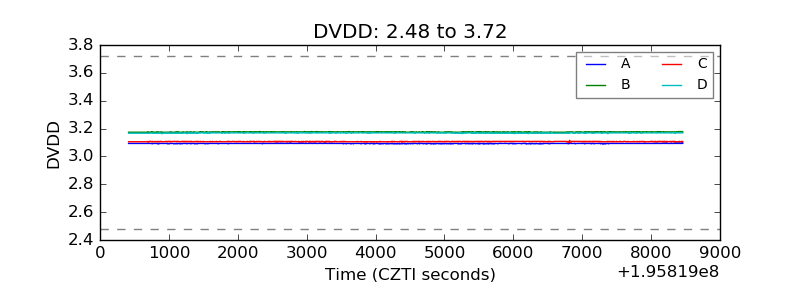 |
| Temperature 1 | 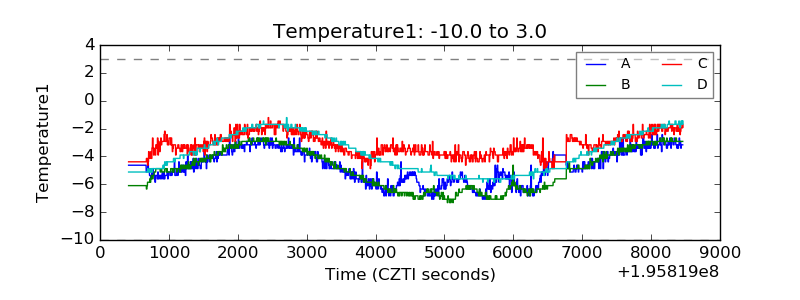 |
| Veto HV Monitor | 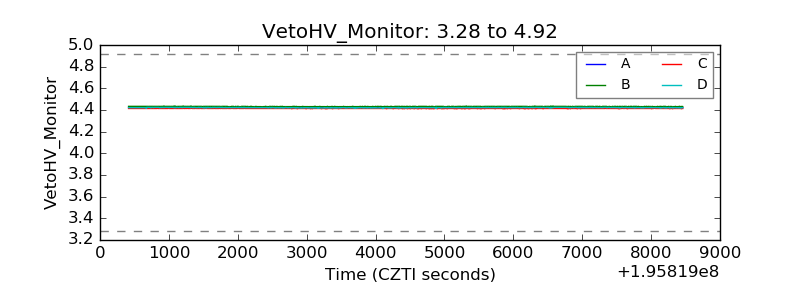 |
| Veto LLD | 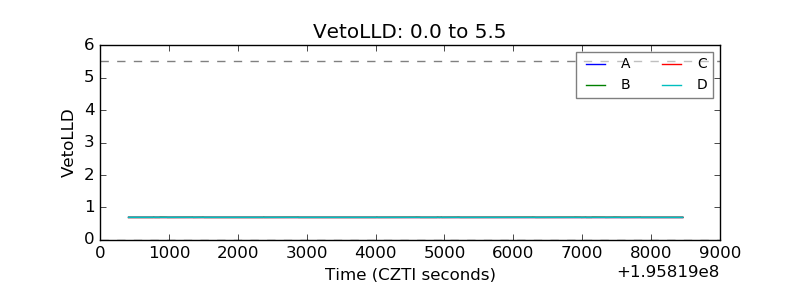 |
| Alpha Counter | 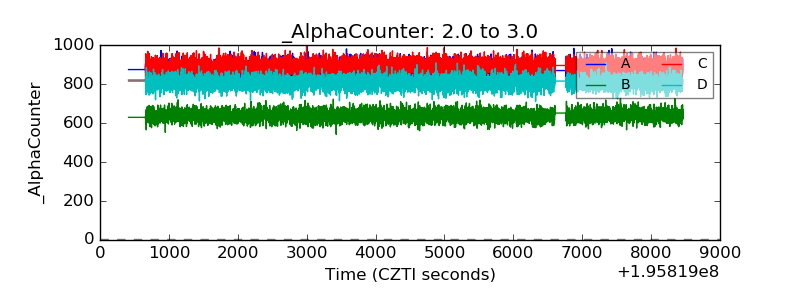 |
| _CPM_Rate | 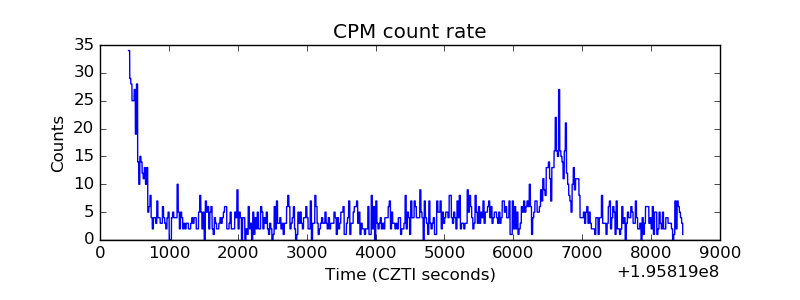 |
| CZT Counter | 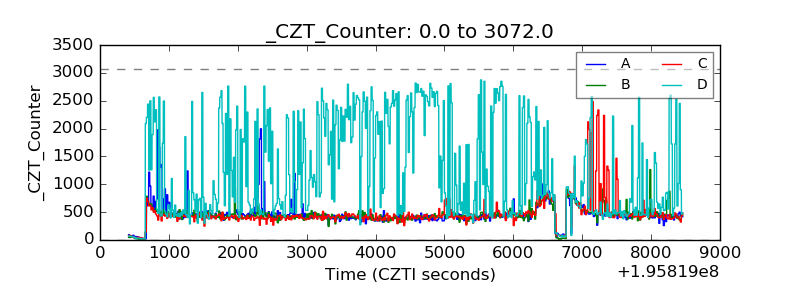 |
| +2.5 Volts monitor |  |
| +5 Volts monitor | 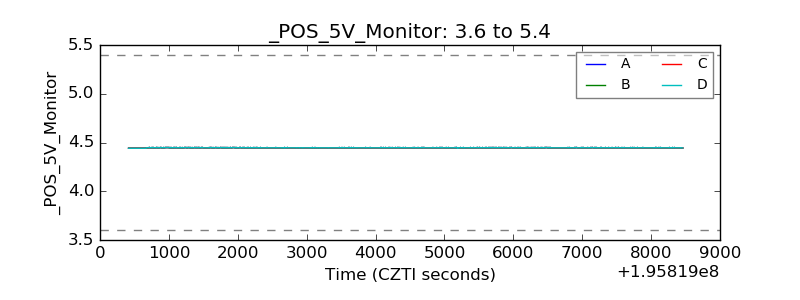 |
| _ROLL_ROT | 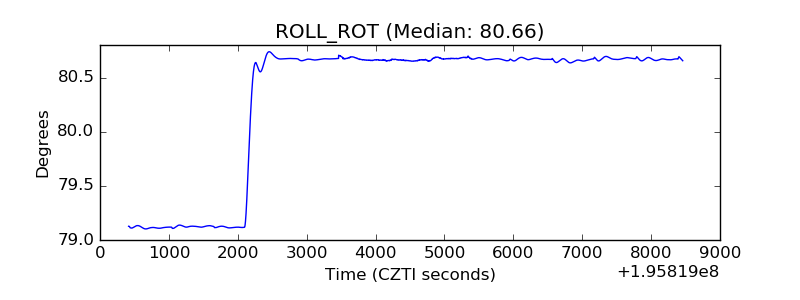 |
| _Roll_DEC | 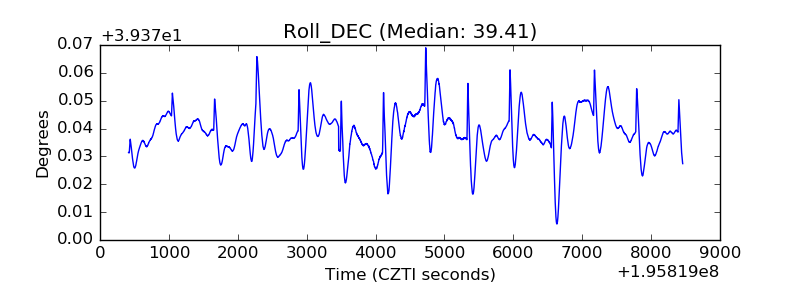 |
| _Roll_RA | 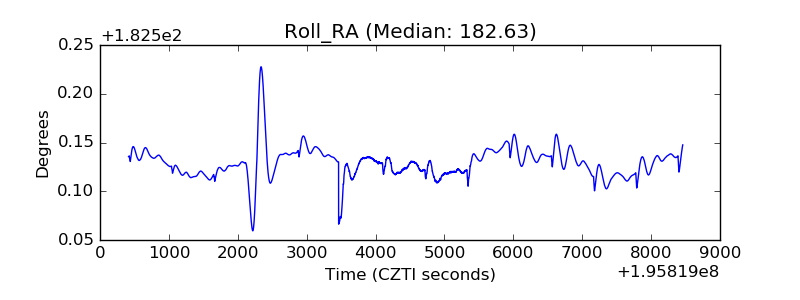 |
| Veto Counter | 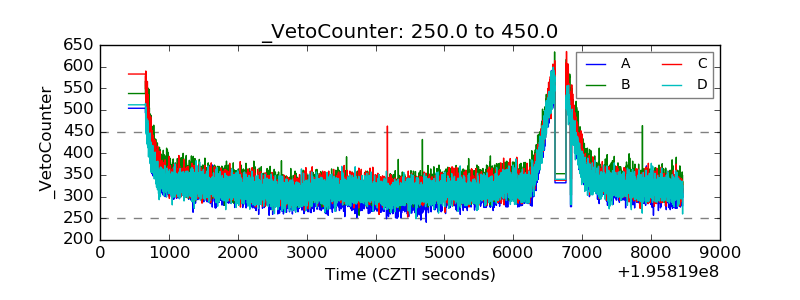 |