| Param | Original file | Final file |
|---|---|---|
| Filename | modeM0/AS1T01_103T01_9000000374_02523cztM0_level2.evt | modeM0/AS1T01_103T01_9000000374_02523cztM0_level2_quad_clean.evt |
| Size (bytes) | 597,476,160 | 74,085,120 |
| Size | 569.8 MB | 70.7 MB |
| Events in quadrant A | 3,628,344 | 434,356 |
| Events in quadrant B | 3,725,363 | 434,381 |
| Events in quadrant C | 3,881,030 | 427,573 |
| Events in quadrant D | 6,315,525 | 389,241 |
| Mode SS | |||
|---|---|---|---|
| Quadrant | BADHDUFLAG | Total packets | Discarded packets |
| A | 0 | 160 | 0 |
| B | 0 | 160 | 0 |
| C | 0 | 160 | 0 |
| D | 0 | 160 | 0 |
| Mode M9 | |||
|---|---|---|---|
| Quadrant | BADHDUFLAG | Total packets | Discarded packets |
| A | 1 | 251318637792 | 0 |
| B | 1 | -1 | -1 |
| C | 1 | -1 | -1 |
| D | 1 | -1 | -1 |
| Mode M0 | |||
|---|---|---|---|
| Quadrant | BADHDUFLAG | Total packets | Discarded packets |
| A | 0 | 16692 | 3 |
| B | 0 | 16835 | 2 |
| C | 0 | 17565 | 2 |
| D | 0 | 24294 | 2 |
| Quadrant | Total seconds | Saturated seconds | Saturation percentage |
|---|---|---|---|
| A | 8018 | 260 | 3.242704% |
| B | 8018 | 268 | 3.342479% |
| C | 8018 | 281 | 3.504615% |
| D | 8018 | 965 | 12.035420% |
Noise dominated data is calculated using 1-second bins in cleaned event files. If a bin has >2000 counts, and if more than 50% of those come from <1% of pixels, then it is considered to be noise-dominated and hence unusable.
| Quadrant | # 1 sec bins | Bins with >0 counts | Bins with >2000 counts | High rate bins dominated by noise | Noise dominated (total time) | Noise dominated (detector-on time) | Marked lightcurve |
|---|---|---|---|---|---|---|---|
| A | 8033 | 8019 | 2 | 2 | 0.02% | 0.02% | 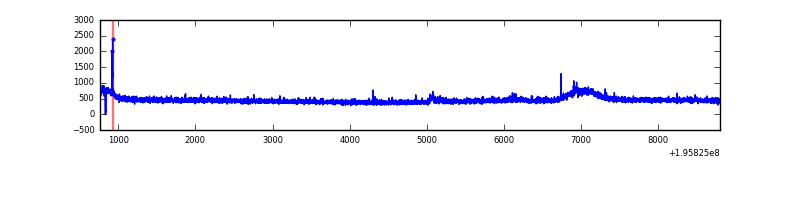 |
| B | 8033 | 8019 | 1 | 1 | 0.01% | 0.01% | 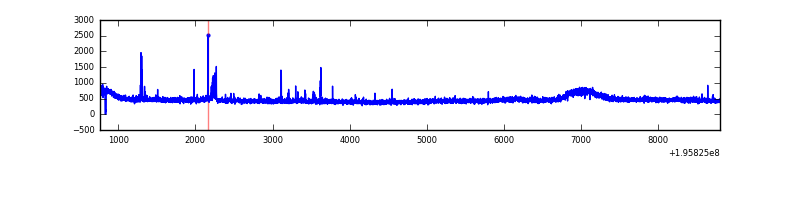 |
| C | 8033 | 8019 | 83 | 83 | 1.03% | 1.04% | 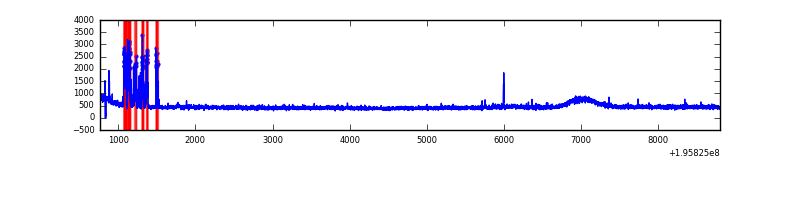 |
| D | 8033 | 8019 | 689 | 689 | 8.58% | 8.59% | 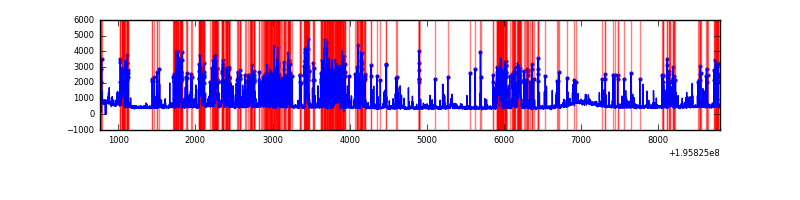 |
Top three noisy pixels from each quadrant. If the there are fewer than three noisy pixels in the level2.evt file, extra rows are filled as -1
| Pixel properties | Quadrant properties | ||||||
|---|---|---|---|---|---|---|---|
| Quadrant | DetID | PixID | Counts | Sigma | Mean | Median | Sigma |
| A | 15 | 109 | 16304 | 80.24 | 934 | 912 | 191.8 |
| A | 12 | 194 | 10345 | 49.17 | 934 | 912 | 191.8 |
| A | 0 | 226 | 10276 | 48.81 | 934 | 912 | 191.8 |
| B | 7 | 205 | 61385 | 333.79 | 943 | 919 | 181.2 |
| B | 5 | 6 | 22147 | 117.18 | 943 | 919 | 181.2 |
| B | 12 | 111 | 14694 | 76.04 | 943 | 919 | 181.2 |
| C | 14 | 223 | 319539 | 1513.7 | 902 | 900 | 210.5 |
| C | 10 | 82 | 10906 | 47.53 | 902 | 900 | 210.5 |
| C | 10 | 200 | 8439 | 35.81 | 902 | 900 | 210.5 |
| D | 11 | 130 | 2629159 | 12688.99 | 860 | 834 | 207.1 |
| D | 11 | 131 | 282552 | 1360.07 | 860 | 834 | 207.1 |
| D | 2 | 184 | 57673 | 274.41 | 860 | 834 | 207.1 |
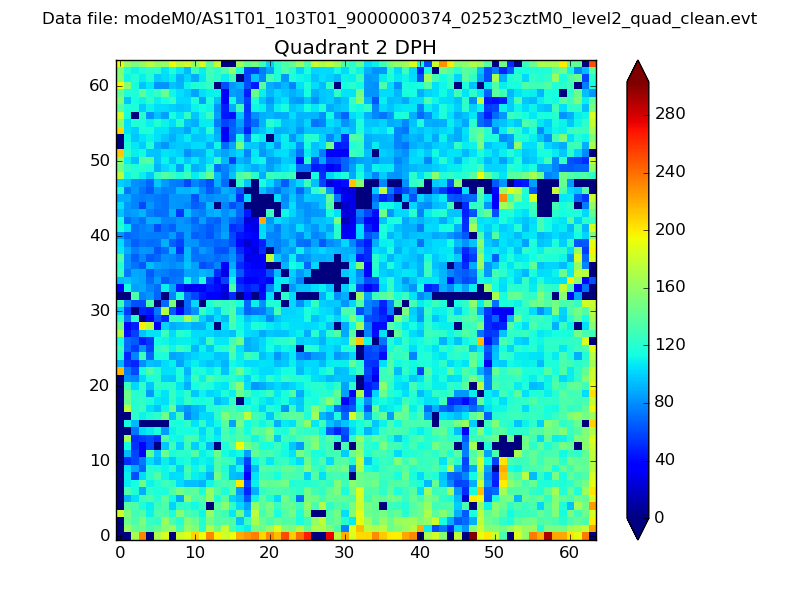
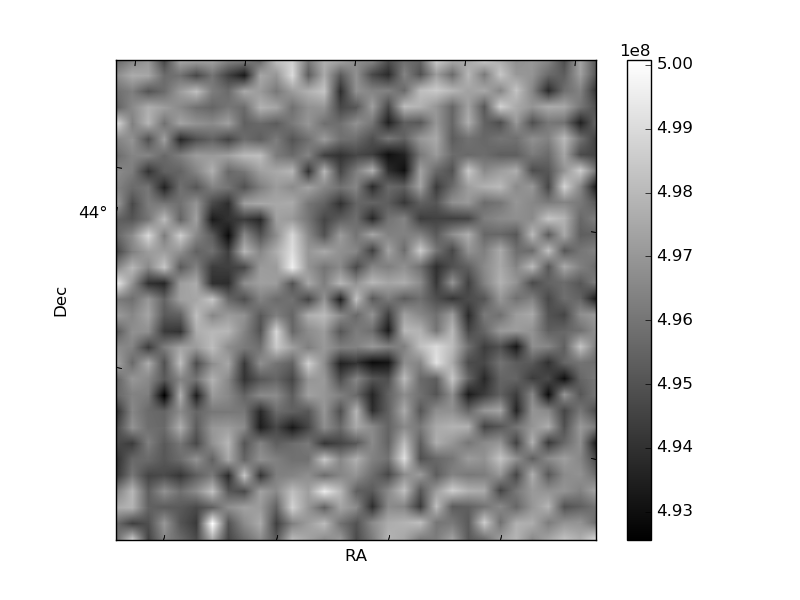
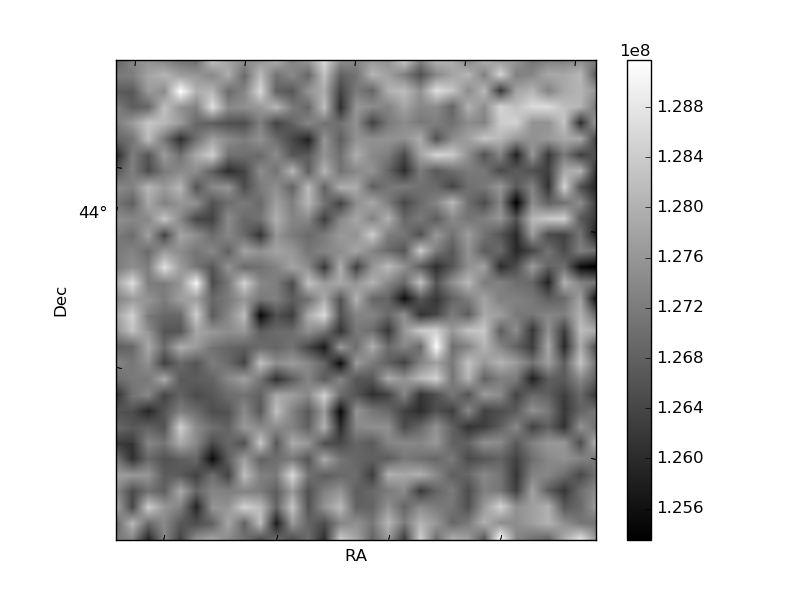
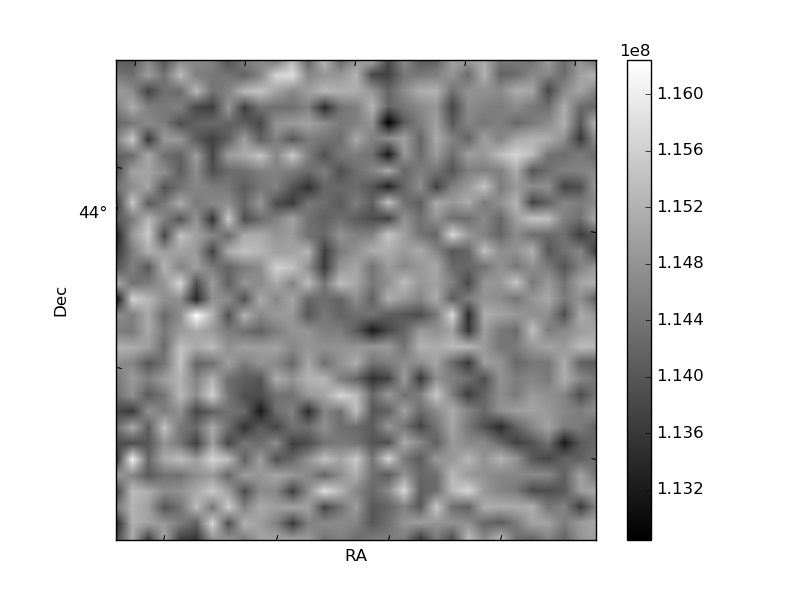
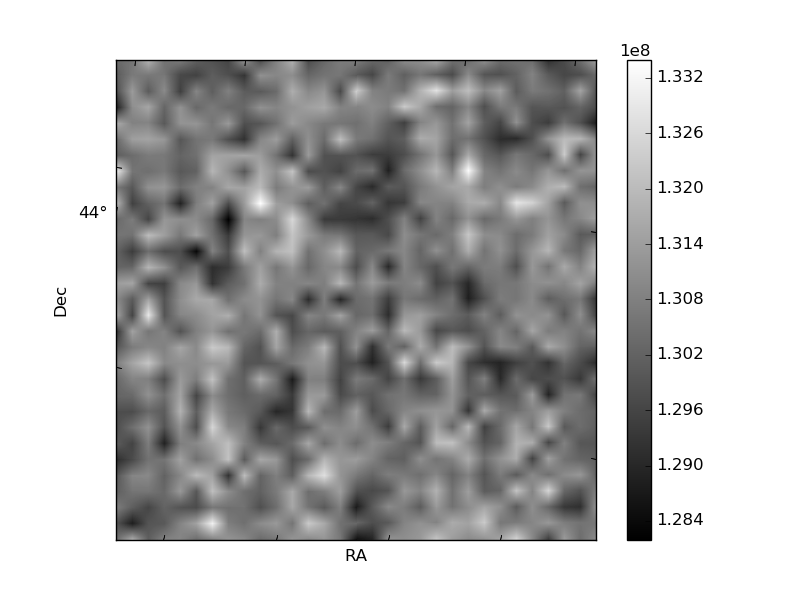
Histogram calculated using DETX and DETY for each event in the final _common_clean file
| Quadrant A | 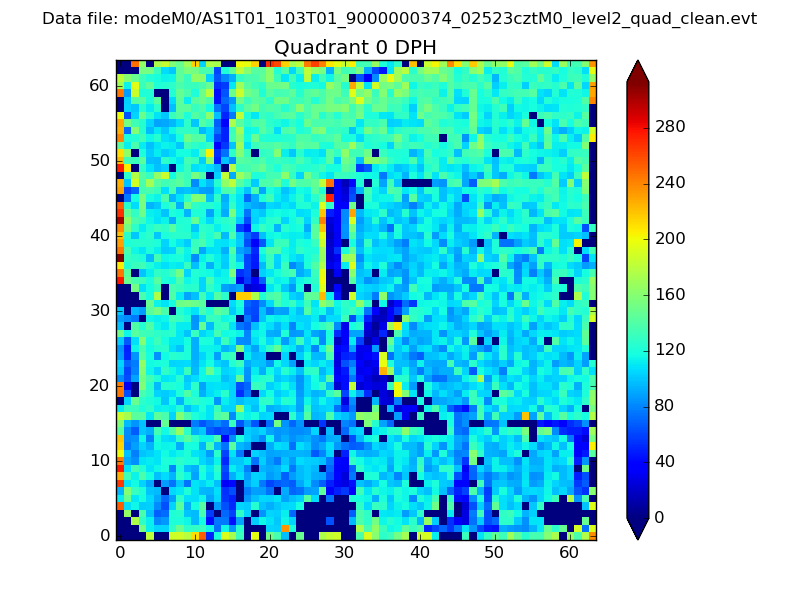 |
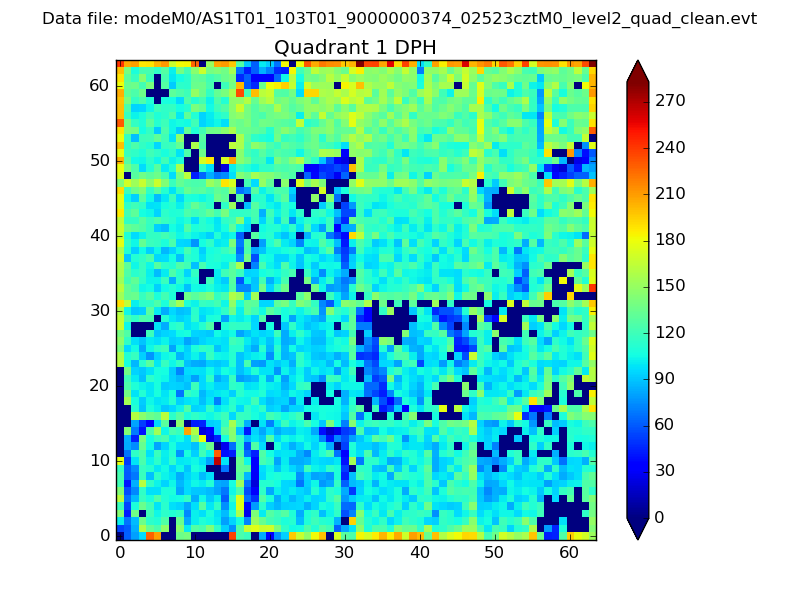 |
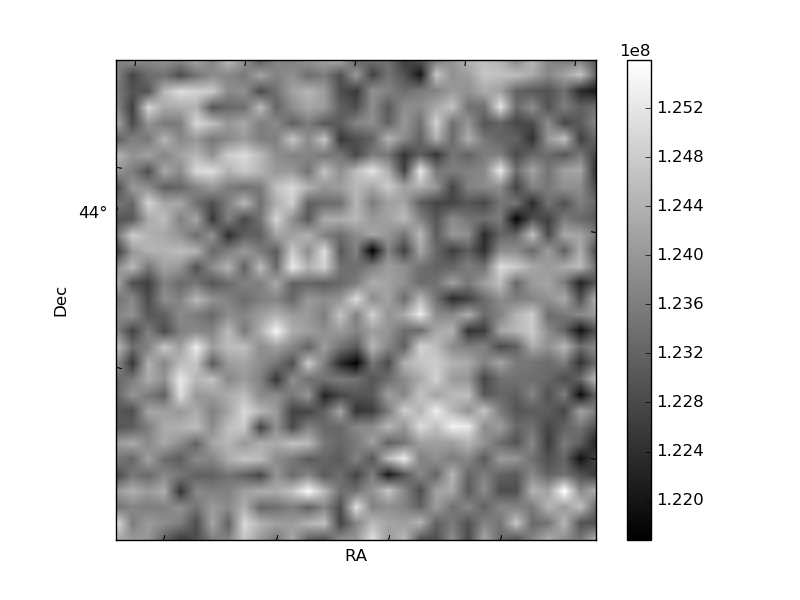
Quadrant B |
|---|---|---|---|
| Quadrant D | 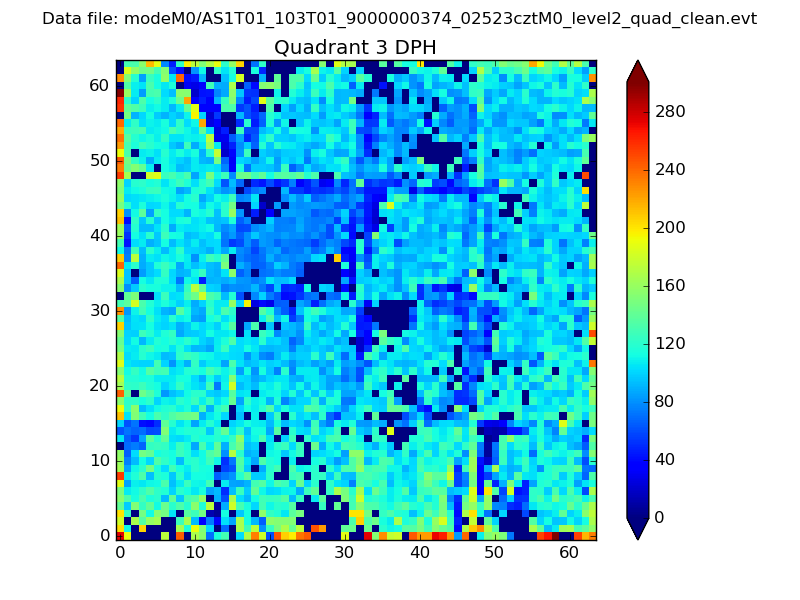 |
 |
Quadrant C |
| Plot type | Count rate plots | Images |
|---|---|---|
| Comparison with Poisson distribution Blue bars denote a histogram of data divided into 1 sec bins. Red curve is a Poisson curve with rate = median count rate of data. |
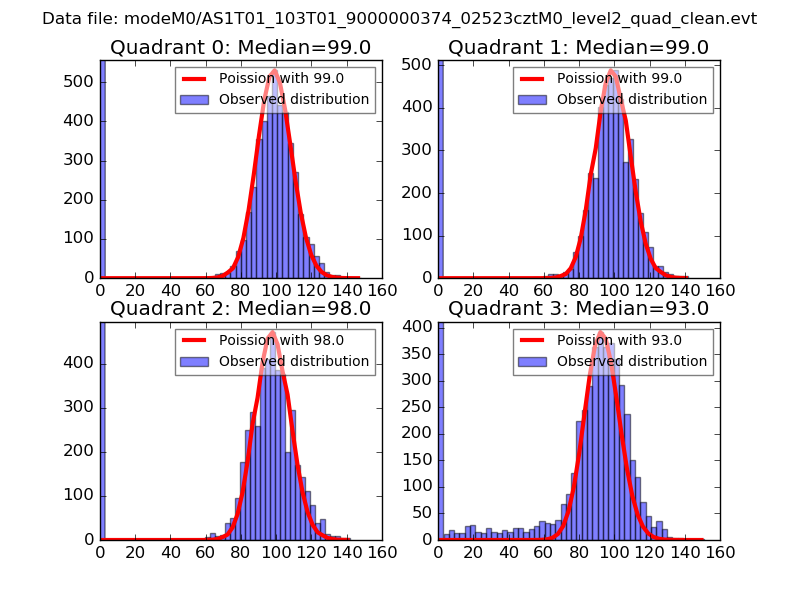 |
 |
| Quadrant-wise count rates Data is divided into 100 sec bins |
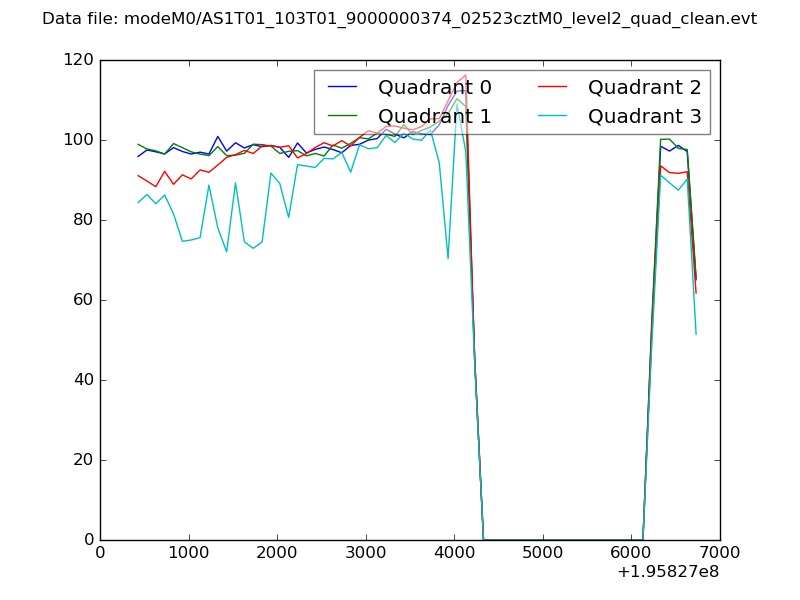 |
|
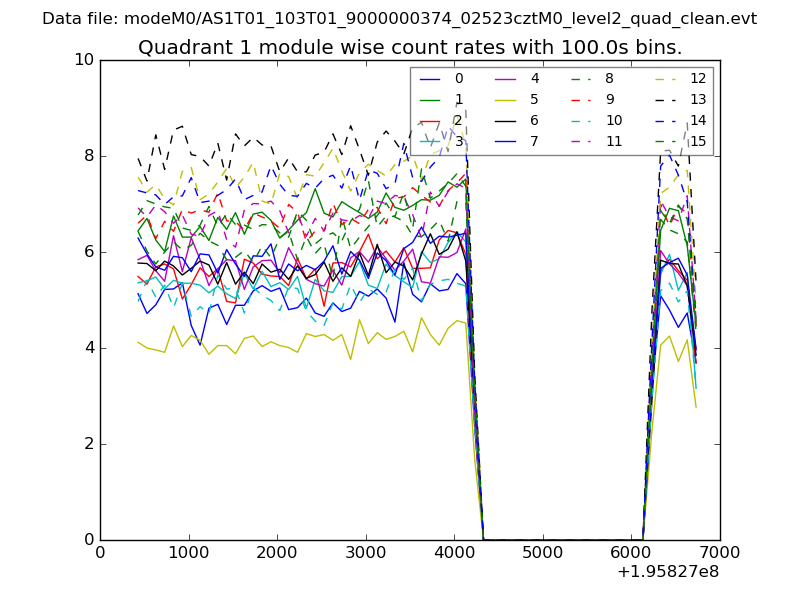
| Module-wise count rates for Quadrant A Data is divided into 100 sec bins |
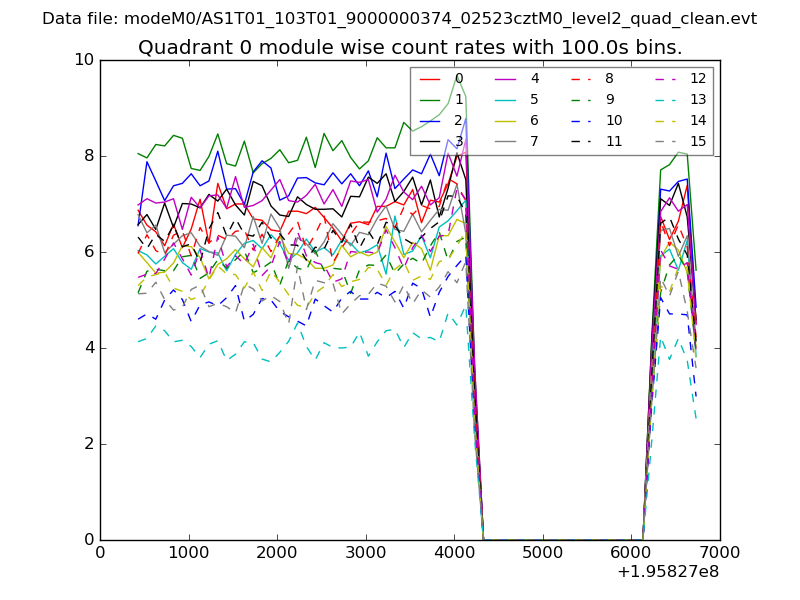 |
 |
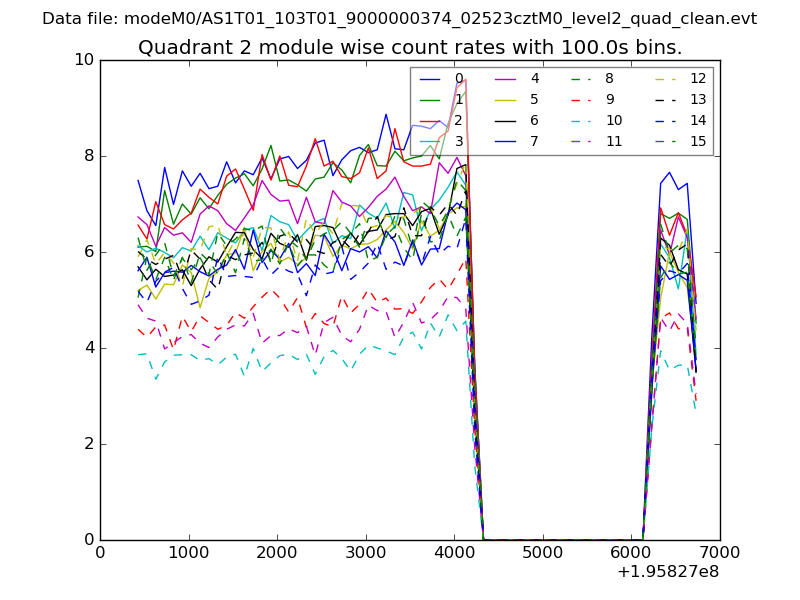
| Module-wise count rates for Quadrant B Data is divided into 100 sec bins |
 |
 |
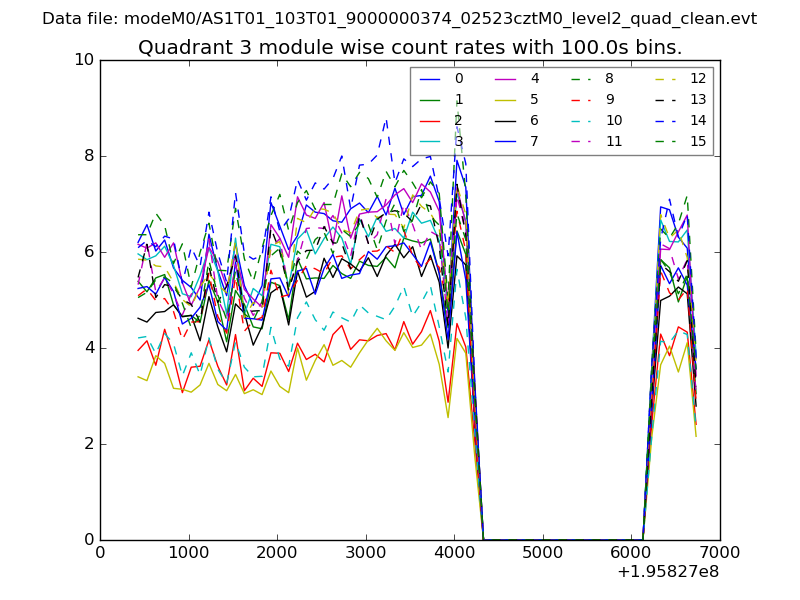
| Module-wise count rates for Quadrant C Data is divided into 100 sec bins |
 |
 |
| Module-wise count rates for Quadrant D Data is divided into 100 sec bins |
 |
 |
| Parameter | Plot |
|---|---|
| CZT HV Monitor | 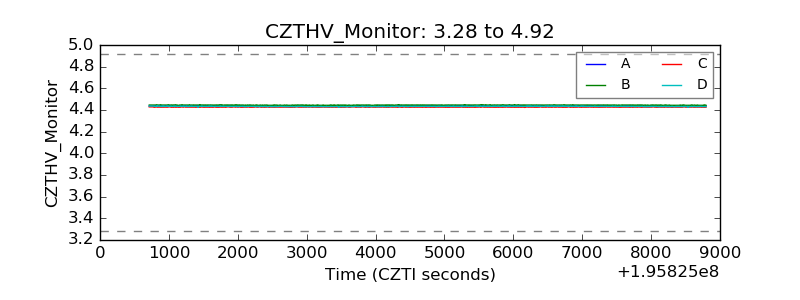 |
| D_VDD | 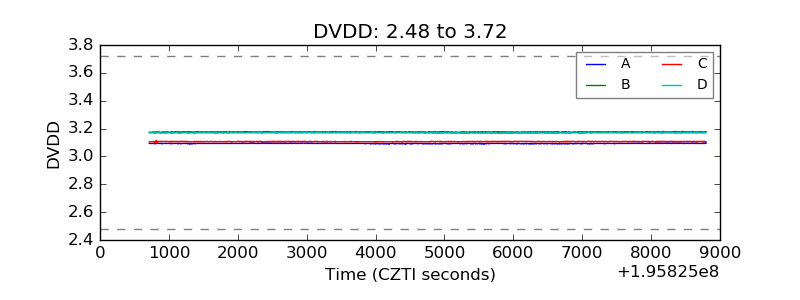 |
| Temperature 1 | 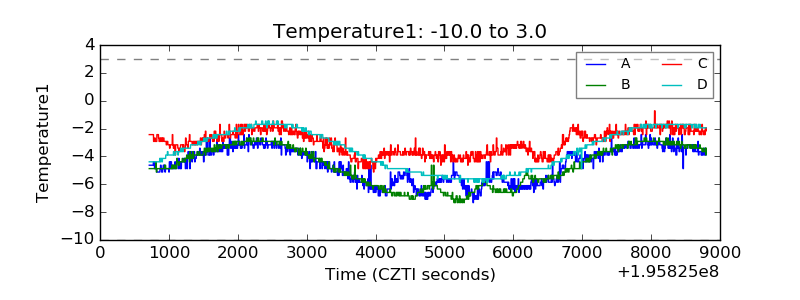 |
| Veto HV Monitor | 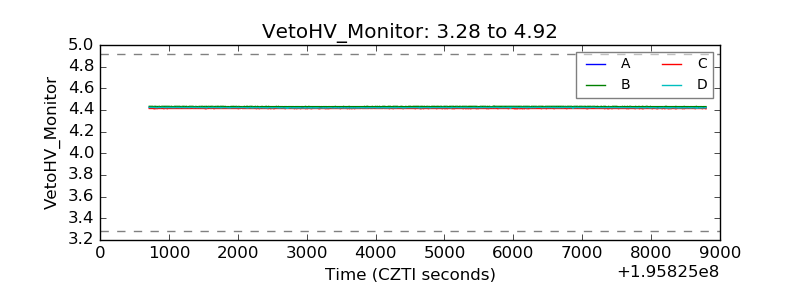 |
| Veto LLD | 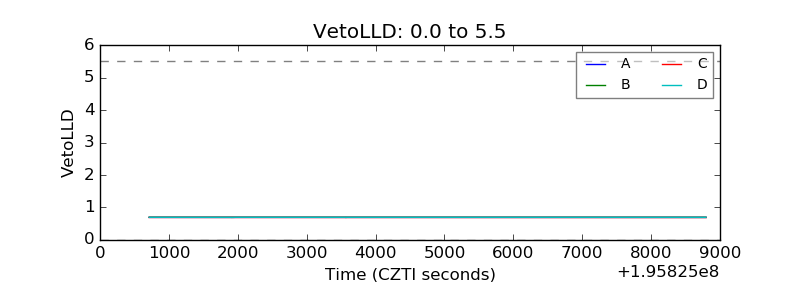 |
| Alpha Counter | 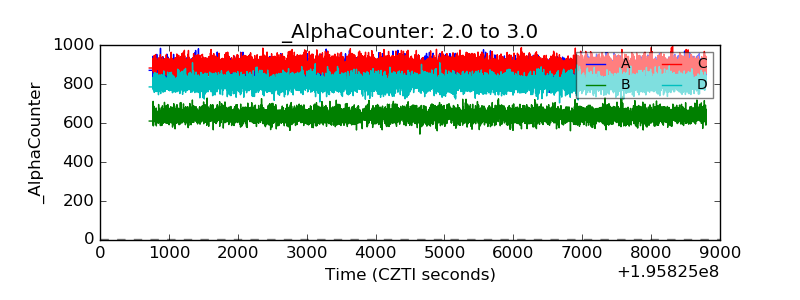 |
| _CPM_Rate | 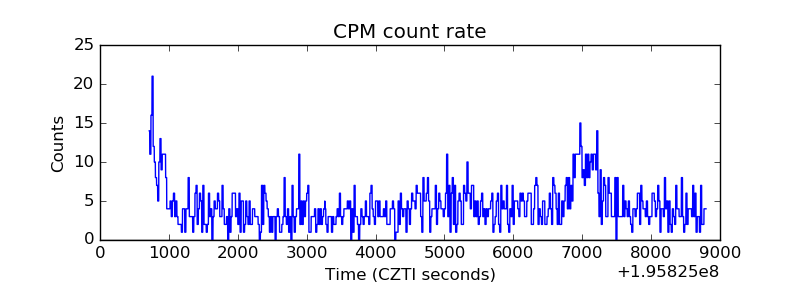 |
| CZT Counter | 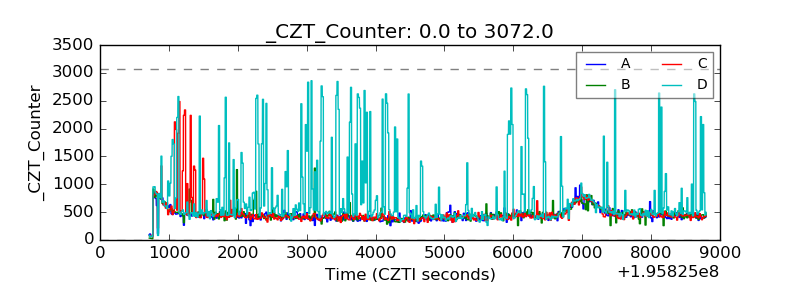 |
| +2.5 Volts monitor |  |
| +5 Volts monitor | 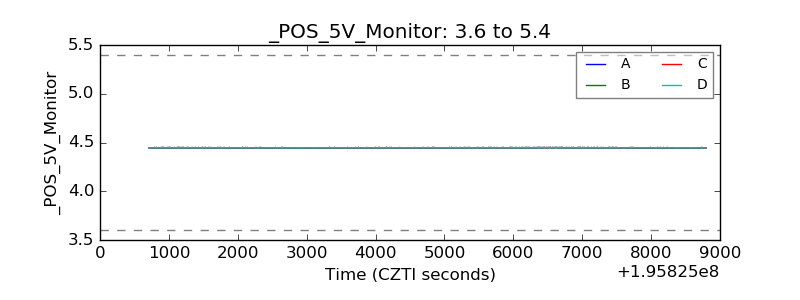 |
| _ROLL_ROT | 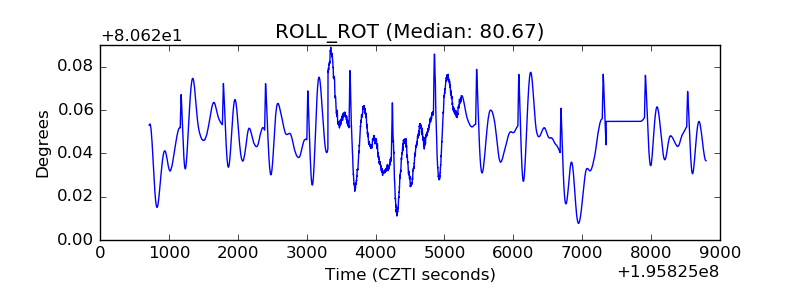 |
| _Roll_DEC | 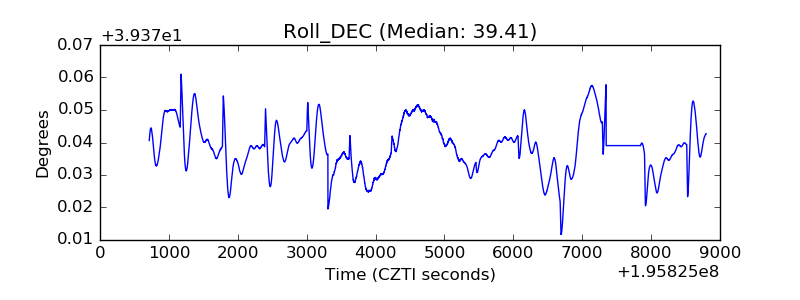 |
| _Roll_RA | 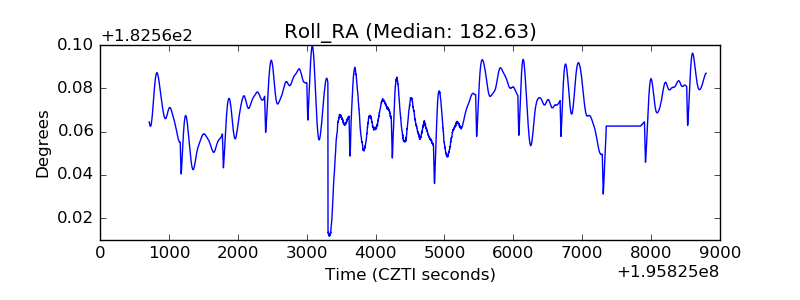 |
| Veto Counter | 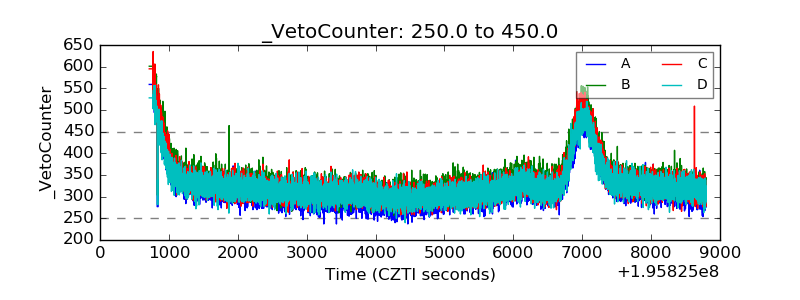 |