| Param | Original file | Final file |
|---|---|---|
| Filename | modeM0/AS1T01_103T01_9000000374_02527cztM0_level2.evt | modeM0/AS1T01_103T01_9000000374_02527cztM0_level2_quad_clean.evt |
| Size (bytes) | 737,628,480 | 122,860,800 |
| Size | 703.5 MB | 117.2 MB |
| Events in quadrant A | 4,825,584 | 742,105 |
| Events in quadrant B | 5,019,050 | 743,038 |
| Events in quadrant C | 4,989,895 | 741,162 |
| Events in quadrant D | 6,731,914 | 706,099 |
| Mode SS | |||
|---|---|---|---|
| Quadrant | BADHDUFLAG | Total packets | Discarded packets |
| A | 0 | 230 | 0 |
| B | 0 | 230 | 0 |
| C | 0 | 230 | 0 |
| D | 0 | 230 | 0 |
| Mode M9 | |||
|---|---|---|---|
| Quadrant | BADHDUFLAG | Total packets | Discarded packets |
| A | 0 | 5 | 0 |
| B | 0 | 5 | 0 |
| C | 0 | 5 | 0 |
| D | 0 | 5 | 0 |
| Mode M0 | |||
|---|---|---|---|
| Quadrant | BADHDUFLAG | Total packets | Discarded packets |
| A | 0 | 23021 | 1 |
| B | 0 | 23390 | 1 |
| C | 0 | 23168 | 1 |
| D | 0 | 27953 | 1 |
| Quadrant | Total seconds | Saturated seconds | Saturation percentage |
|---|---|---|---|
| A | 11393 | 41 | 0.359870% |
| B | 11393 | 85 | 0.746072% |
| C | 11393 | 40 | 0.351093% |
| D | 11393 | 526 | 4.616870% |
Noise dominated data is calculated using 1-second bins in cleaned event files. If a bin has >2000 counts, and if more than 50% of those come from <1% of pixels, then it is considered to be noise-dominated and hence unusable.
| Quadrant | # 1 sec bins | Bins with >0 counts | Bins with >2000 counts | High rate bins dominated by noise | Noise dominated (total time) | Noise dominated (detector-on time) | Marked lightcurve |
|---|---|---|---|---|---|---|---|
| A | 11918 | 11394 | 0 | 0 | 0.00% | 0.00% | 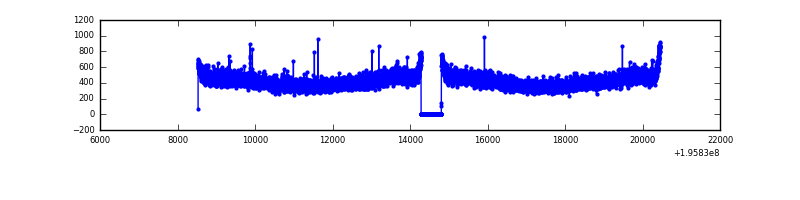 |
| B | 11918 | 11394 | 47 | 47 | 0.39% | 0.41% | 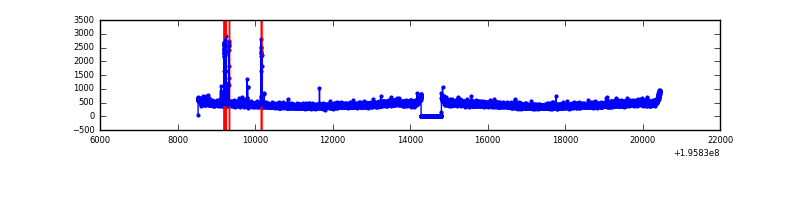 |
| C | 11918 | 11394 | 2 | 2 | 0.02% | 0.02% | 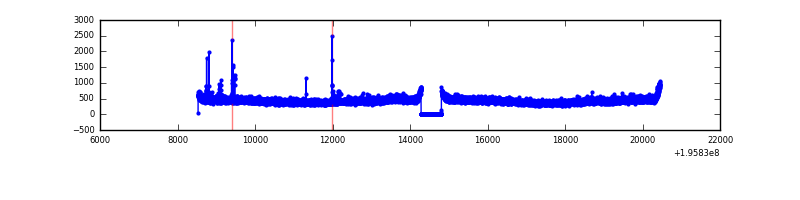 |
| D | 11918 | 11394 | 435 | 435 | 3.65% | 3.82% | 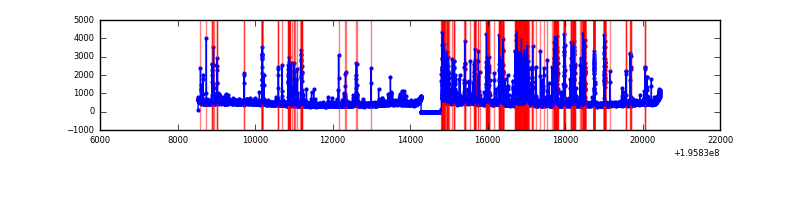 |
Top three noisy pixels from each quadrant. If the there are fewer than three noisy pixels in the level2.evt file, extra rows are filled as -1
| Pixel properties | Quadrant properties | ||||||
|---|---|---|---|---|---|---|---|
| Quadrant | DetID | PixID | Counts | Sigma | Mean | Median | Sigma |
| A | 12 | 194 | 13870 | 49.21 | 1253 | 1224 | 257.0 |
| A | 0 | 226 | 12990 | 45.78 | 1253 | 1224 | 257.0 |
| A | 15 | 236 | 5429 | 16.36 | 1253 | 1224 | 257.0 |
| B | 4 | 48 | 92438 | 374.63 | 1266 | 1232 | 243.5 |
| B | 14 | 167 | 23584 | 91.81 | 1266 | 1232 | 243.5 |
| B | 12 | 111 | 19912 | 76.73 | 1266 | 1232 | 243.5 |
| C | 2 | 53 | 95136 | 330.53 | 1221 | 1224 | 284.1 |
| C | 8 | 112 | 32052 | 108.5 | 1221 | 1224 | 284.1 |
| C | 14 | 223 | 29130 | 98.22 | 1221 | 1224 | 284.1 |
| D | 11 | 130 | 1599518 | 5694.3 | 1181 | 1150 | 280.7 |
| D | 11 | 131 | 516965 | 1837.63 | 1181 | 1150 | 280.7 |
| D | 7 | 67 | 53418 | 186.21 | 1181 | 1150 | 280.7 |
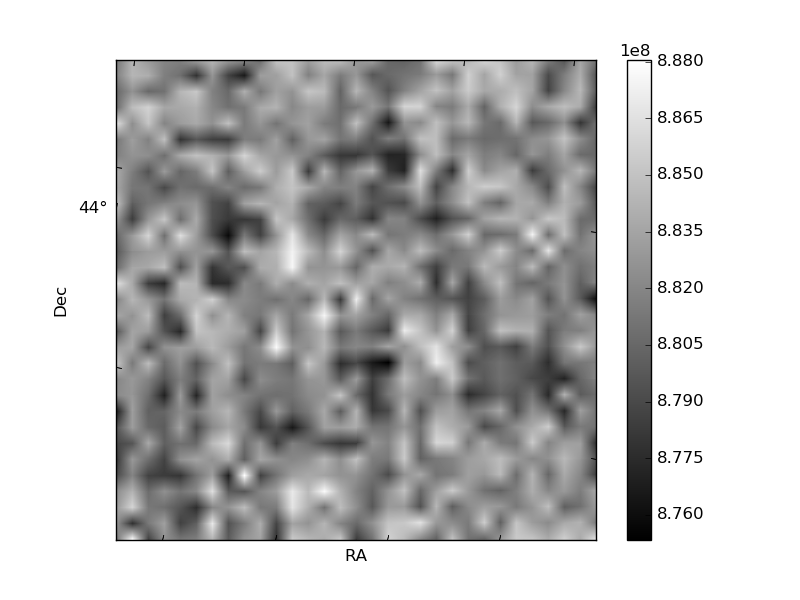
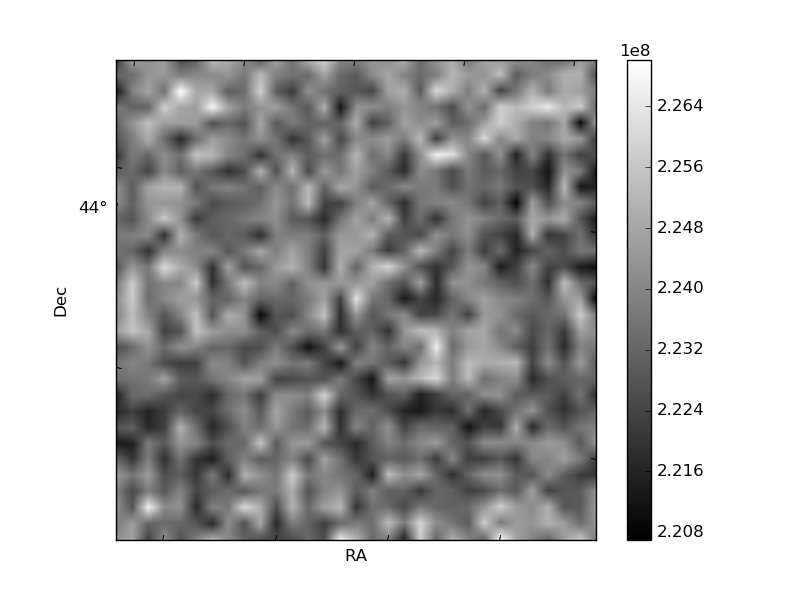
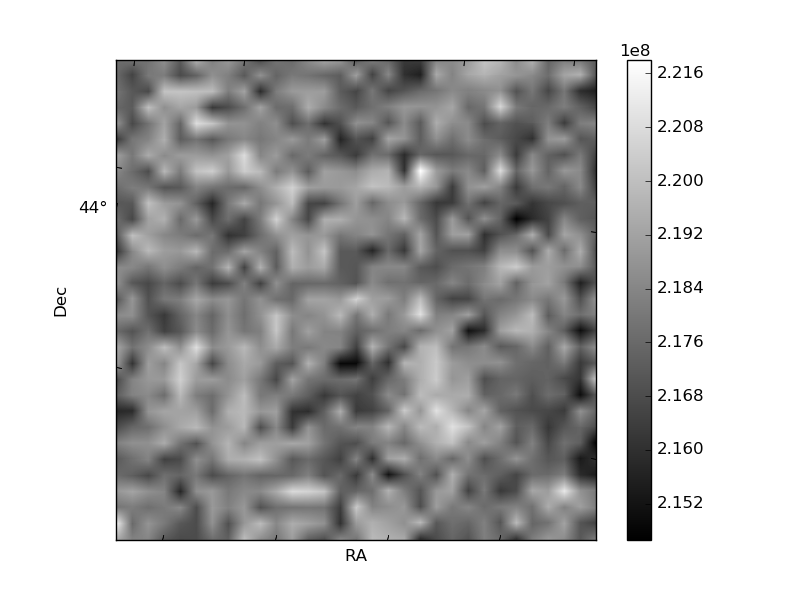
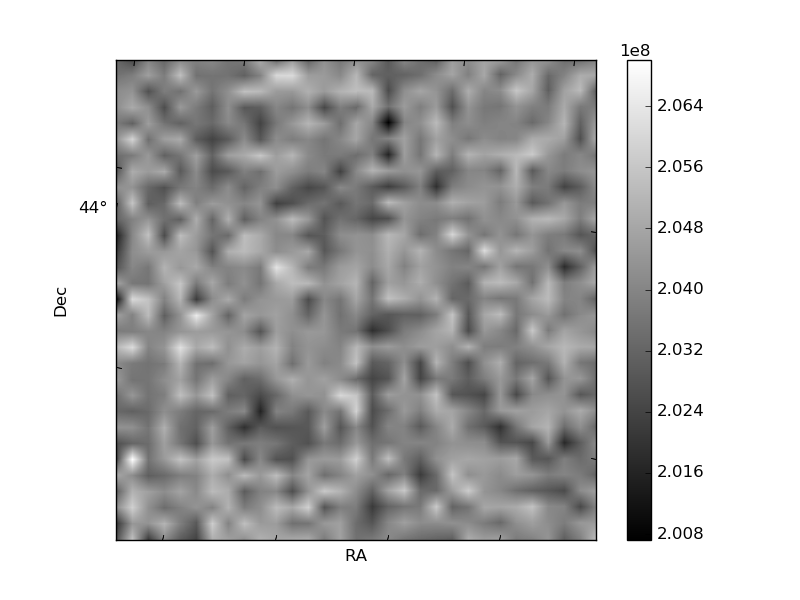
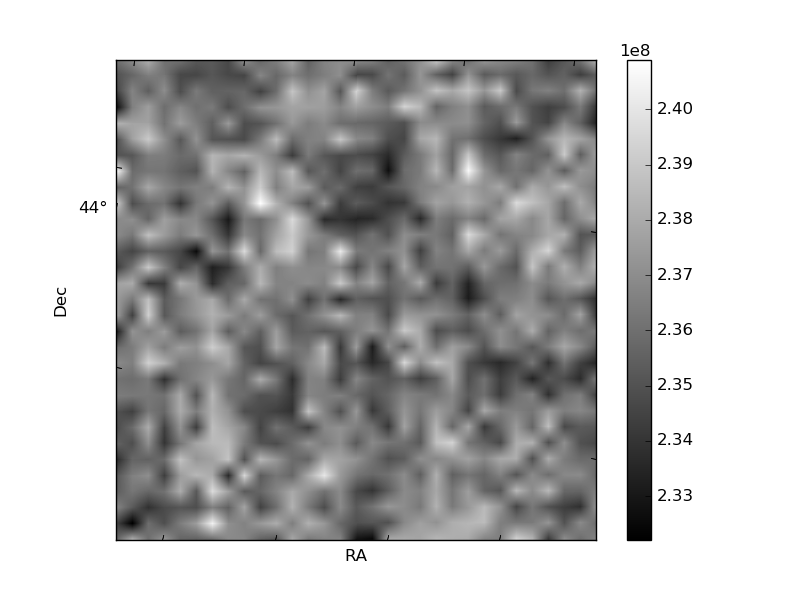
Histogram calculated using DETX and DETY for each event in the final _common_clean file
| Quadrant A | 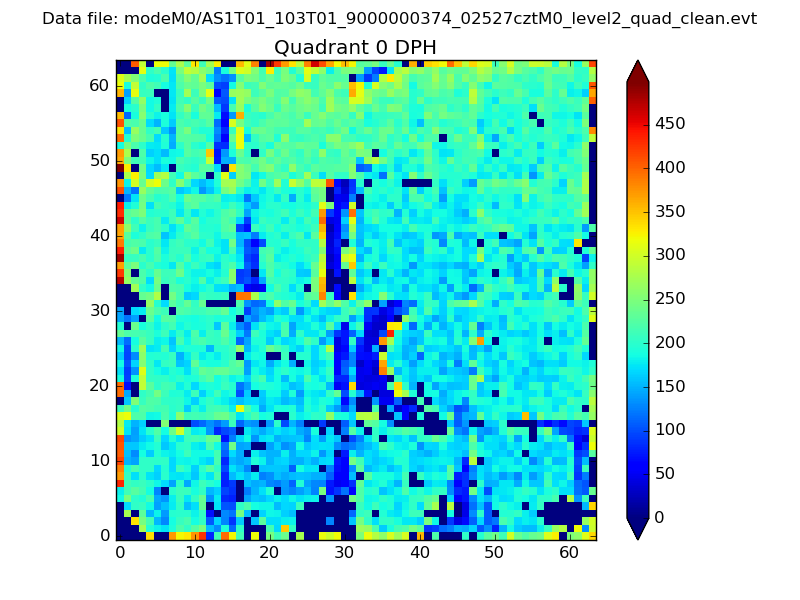 |
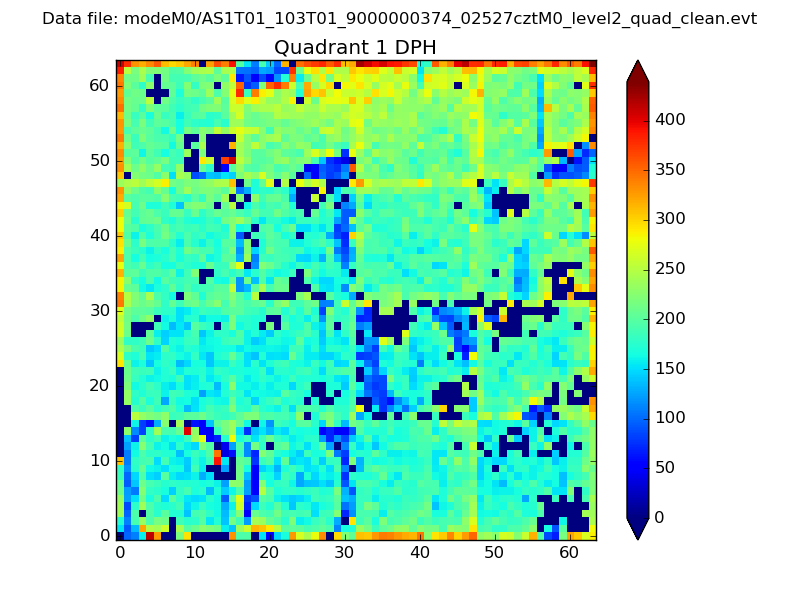 |
Quadrant B |
|---|---|---|---|
| Quadrant D | 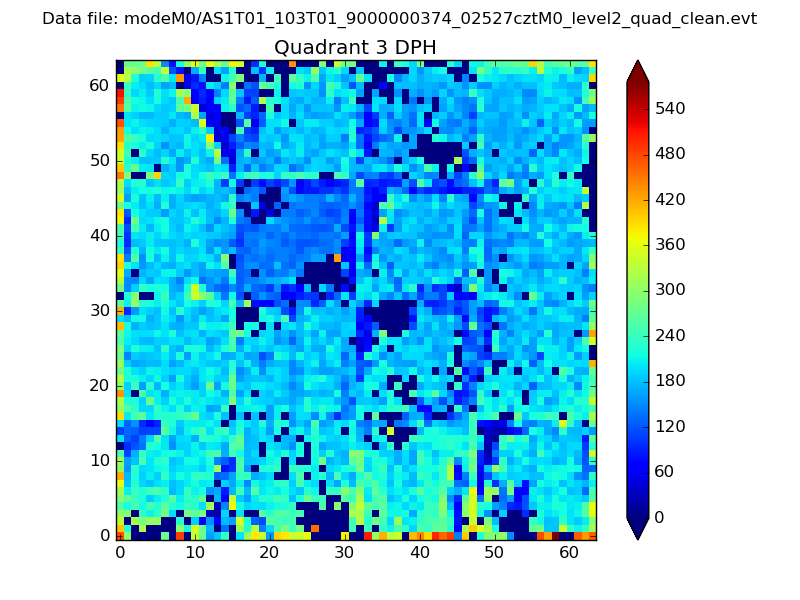 |
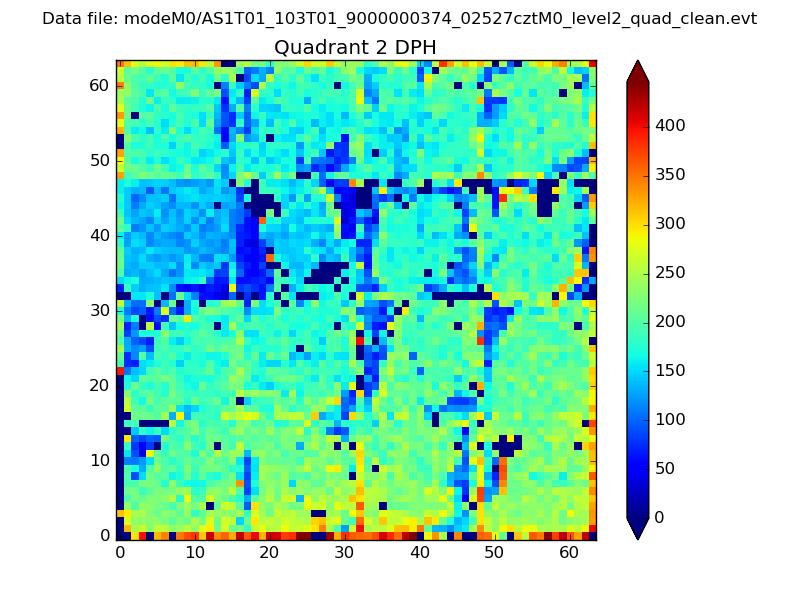 |
Quadrant C |
| Plot type | Count rate plots | Images |
|---|---|---|
| Comparison with Poisson distribution Blue bars denote a histogram of data divided into 1 sec bins. Red curve is a Poisson curve with rate = median count rate of data. |
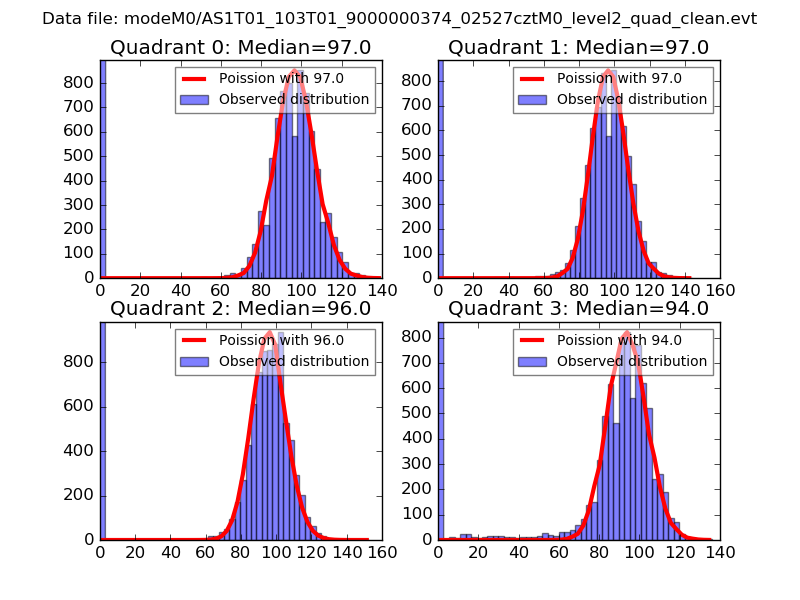 |
 |
| Quadrant-wise count rates Data is divided into 100 sec bins |
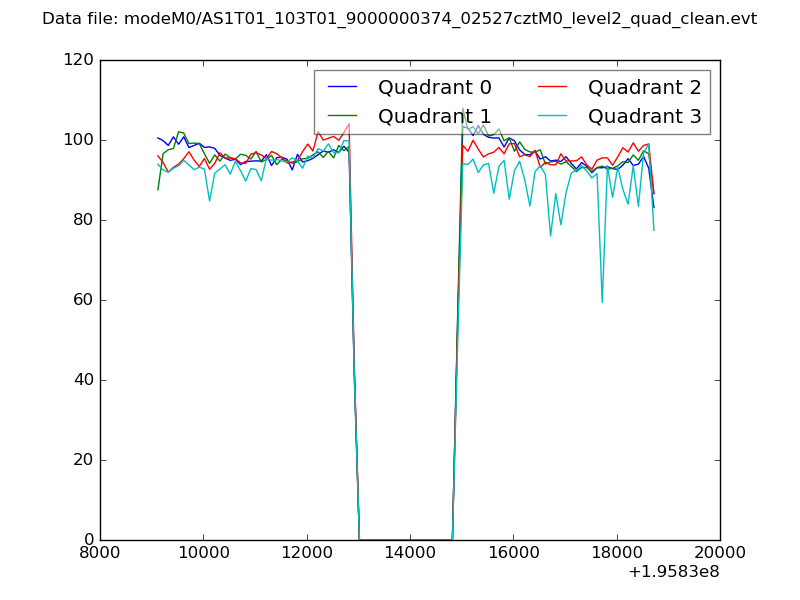 |
|
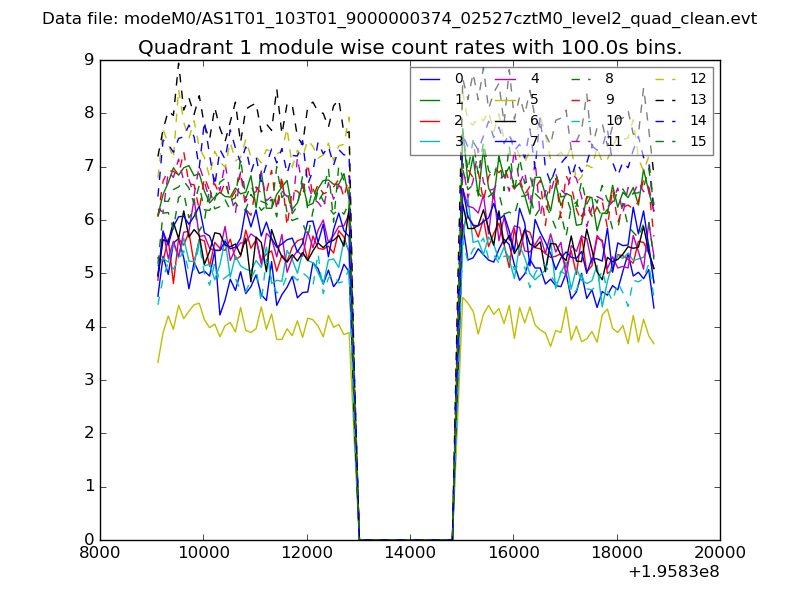
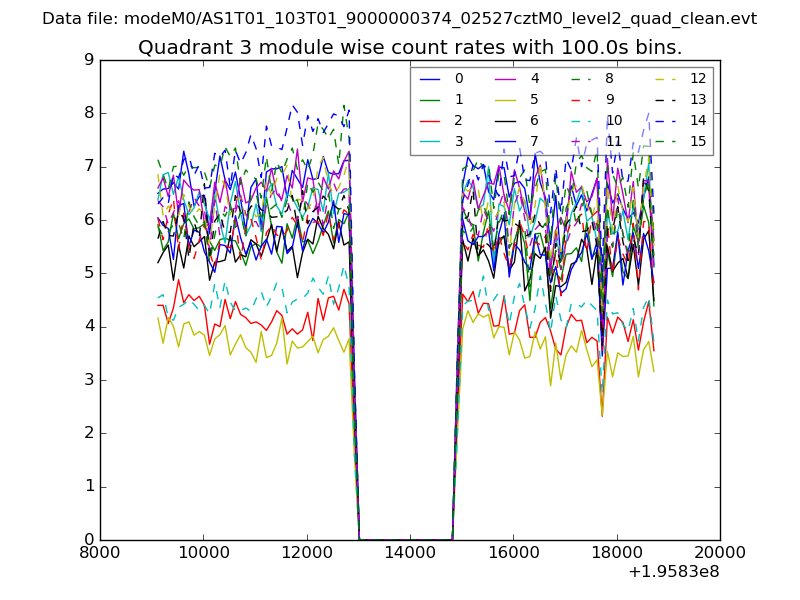
| Module-wise count rates for Quadrant A Data is divided into 100 sec bins |
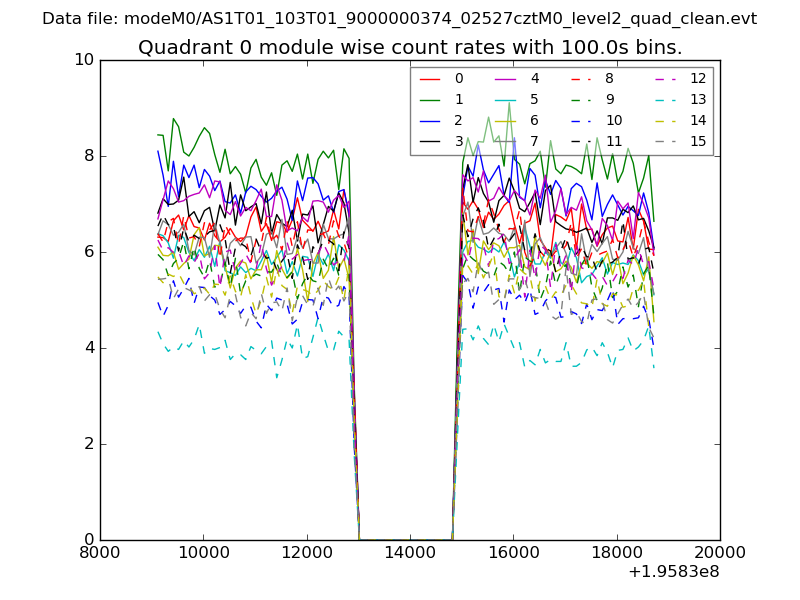 |
 |
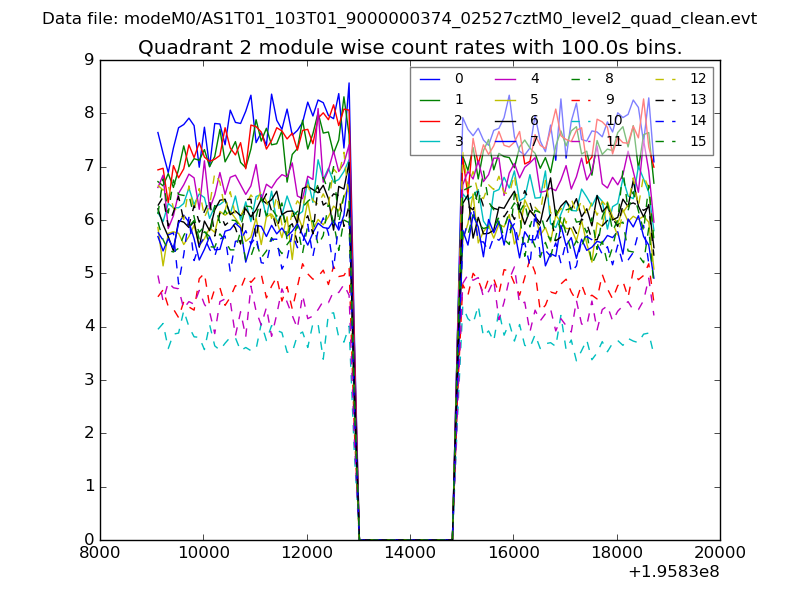
| Module-wise count rates for Quadrant B Data is divided into 100 sec bins |
 |
 |
| Module-wise count rates for Quadrant C Data is divided into 100 sec bins |
 |
 |
| Module-wise count rates for Quadrant D Data is divided into 100 sec bins |
 |
 |
| Parameter | Plot |
|---|---|
| CZT HV Monitor | 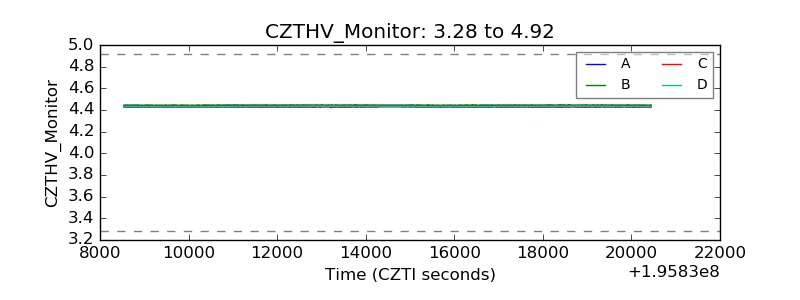 |
| D_VDD | 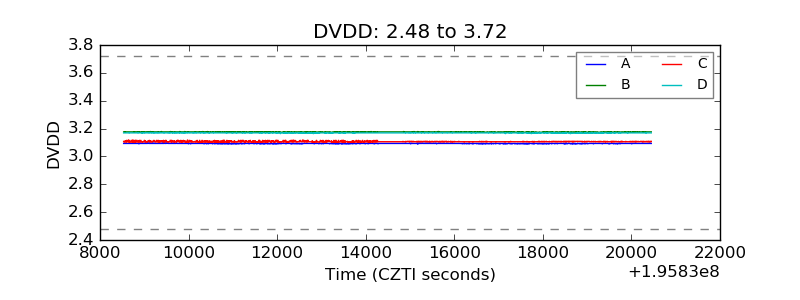 |
| Temperature 1 | 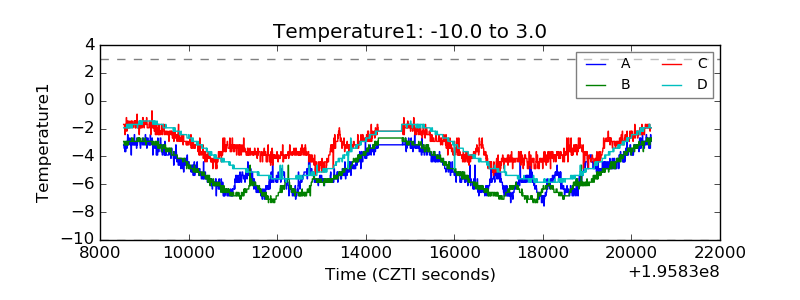 |
| Veto HV Monitor | 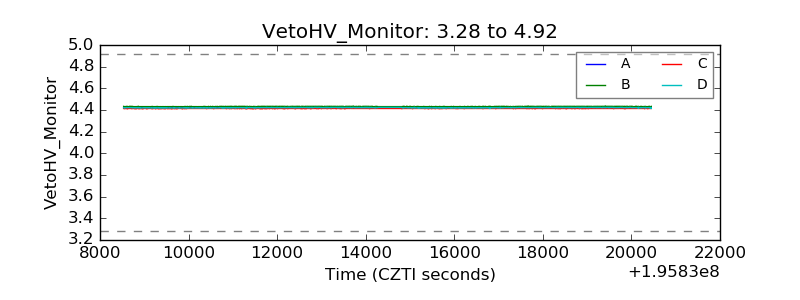 |
| Veto LLD | 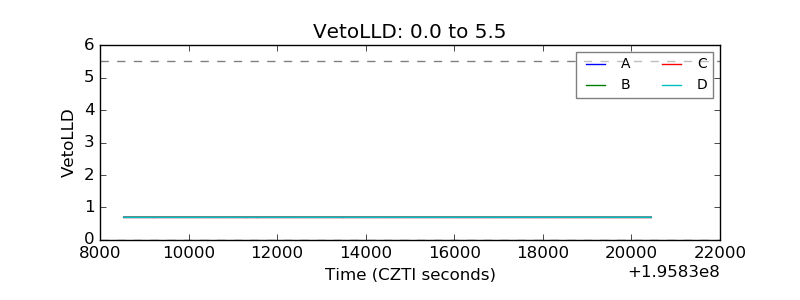 |
| Alpha Counter | 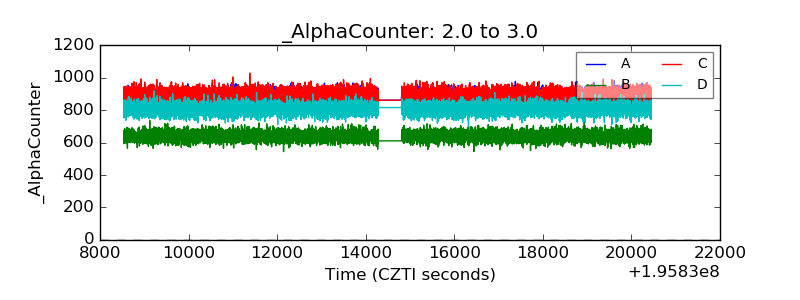 |
| _CPM_Rate | 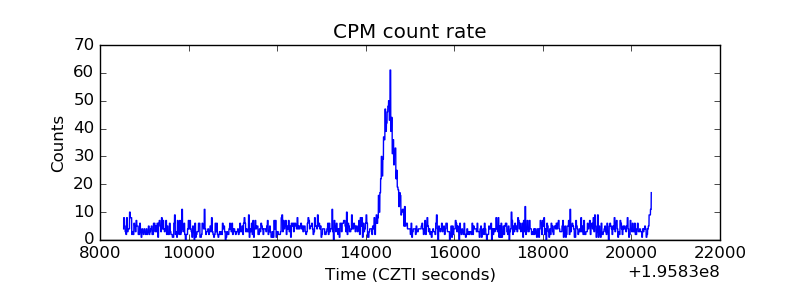 |
| CZT Counter | 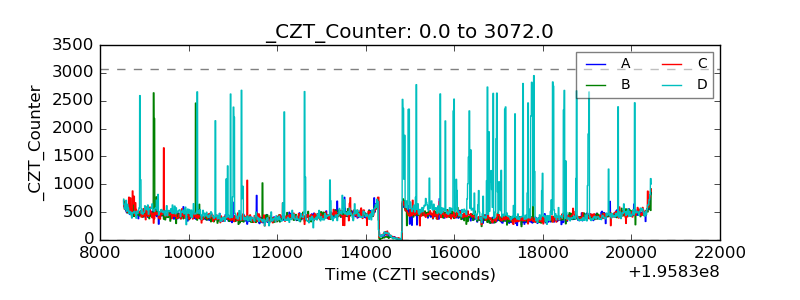 |
| +2.5 Volts monitor |  |
| +5 Volts monitor |  |
| Veto Counter | 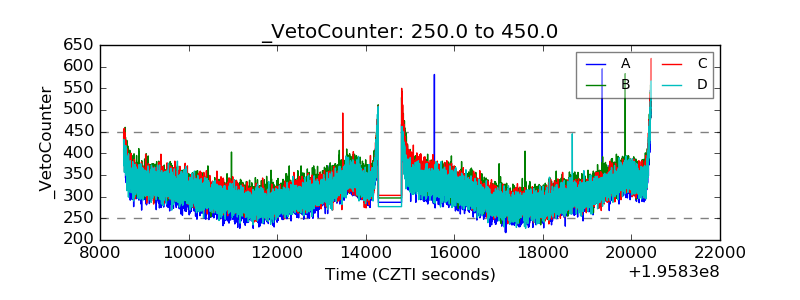 |