| Param | Original file | Final file |
|---|---|---|
| Filename | modeM0/AS1T01_103T01_9000000374_02530cztM0_level2.evt | modeM0/AS1T01_103T01_9000000374_02530cztM0_level2_quad_clean.evt |
| Size (bytes) | 1,096,675,200 | 204,068,160 |
| Size | 1.0 GB | 194.6 MB |
| Events in quadrant A | 7,159,956 | 1,267,642 |
| Events in quadrant B | 7,391,036 | 1,280,002 |
| Events in quadrant C | 7,366,203 | 1,266,481 |
| Events in quadrant D | 10,153,515 | 1,203,411 |
| Mode SS | |||
|---|---|---|---|
| Quadrant | BADHDUFLAG | Total packets | Discarded packets |
| A | 0 | 342 | 0 |
| B | 0 | 342 | 0 |
| C | 0 | 342 | 0 |
| D | 0 | 342 | 0 |
| Mode M9 | |||
|---|---|---|---|
| Quadrant | BADHDUFLAG | Total packets | Discarded packets |
| A | 0 | 7 | 0 |
| B | 0 | 7 | 0 |
| C | 0 | 7 | 0 |
| D | 0 | 7 | 0 |
| Mode M0 | |||
|---|---|---|---|
| Quadrant | BADHDUFLAG | Total packets | Discarded packets |
| A | 0 | 34199 | 0 |
| B | 0 | 34576 | 0 |
| C | 0 | 34426 | 0 |
| D | 0 | 41958 | 0 |
| Quadrant | Total seconds | Saturated seconds | Saturation percentage |
|---|---|---|---|
| A | 16863 | 131 | 0.776849% |
| B | 16863 | 187 | 1.108937% |
| C | 16863 | 134 | 0.794639% |
| D | 16863 | 823 | 4.880508% |
Noise dominated data is calculated using 1-second bins in cleaned event files. If a bin has >2000 counts, and if more than 50% of those come from <1% of pixels, then it is considered to be noise-dominated and hence unusable.
| Quadrant | # 1 sec bins | Bins with >0 counts | Bins with >2000 counts | High rate bins dominated by noise | Noise dominated (total time) | Noise dominated (detector-on time) | Marked lightcurve |
|---|---|---|---|---|---|---|---|
| A | 17603 | 16865 | 1 | 1 | 0.01% | 0.01% | 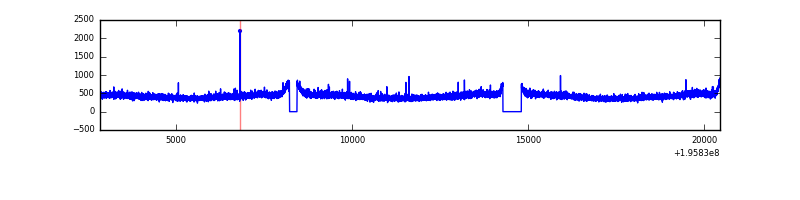 |
| B | 17603 | 16865 | 47 | 47 | 0.27% | 0.28% | 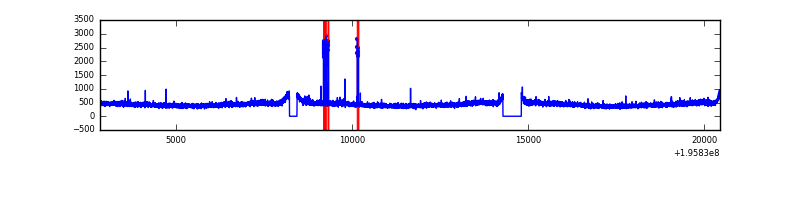 |
| C | 17603 | 16865 | 3 | 3 | 0.02% | 0.02% | 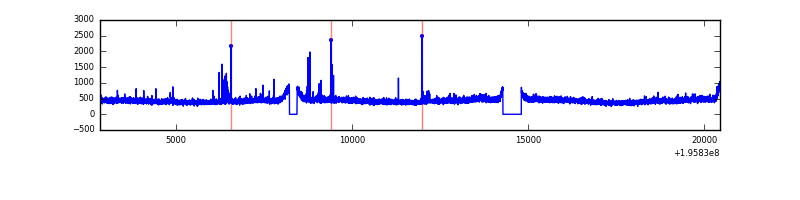 |
| D | 17603 | 16865 | 638 | 638 | 3.62% | 3.78% | 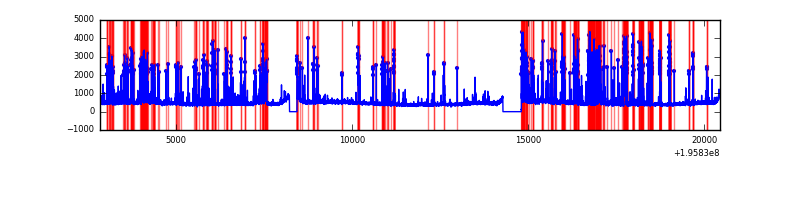 |
Top three noisy pixels from each quadrant. If the there are fewer than three noisy pixels in the level2.evt file, extra rows are filled as -1
| Pixel properties | Quadrant properties | ||||||
|---|---|---|---|---|---|---|---|
| Quadrant | DetID | PixID | Counts | Sigma | Mean | Median | Sigma |
| A | 12 | 194 | 20594 | 49.77 | 1858 | 1816 | 377.3 |
| A | 0 | 226 | 19406 | 46.62 | 1858 | 1816 | 377.3 |
| A | 15 | 236 | 10041 | 21.8 | 1858 | 1816 | 377.3 |
| B | 4 | 48 | 93050 | 254.62 | 1880 | 1831 | 358.3 |
| B | 12 | 111 | 29652 | 77.66 | 1880 | 1831 | 358.3 |
| B | 11 | 111 | 24540 | 63.39 | 1880 | 1831 | 358.3 |
| C | 2 | 53 | 99987 | 231.84 | 1816 | 1820 | 423.4 |
| C | 12 | 4 | 58927 | 134.87 | 1816 | 1820 | 423.4 |
| C | 8 | 112 | 32797 | 73.16 | 1816 | 1820 | 423.4 |
| D | 11 | 130 | 2322142 | 5564.68 | 1756 | 1708 | 417.0 |
| D | 11 | 131 | 723089 | 1729.96 | 1756 | 1708 | 417.0 |
| D | 7 | 67 | 258453 | 615.7 | 1756 | 1708 | 417.0 |
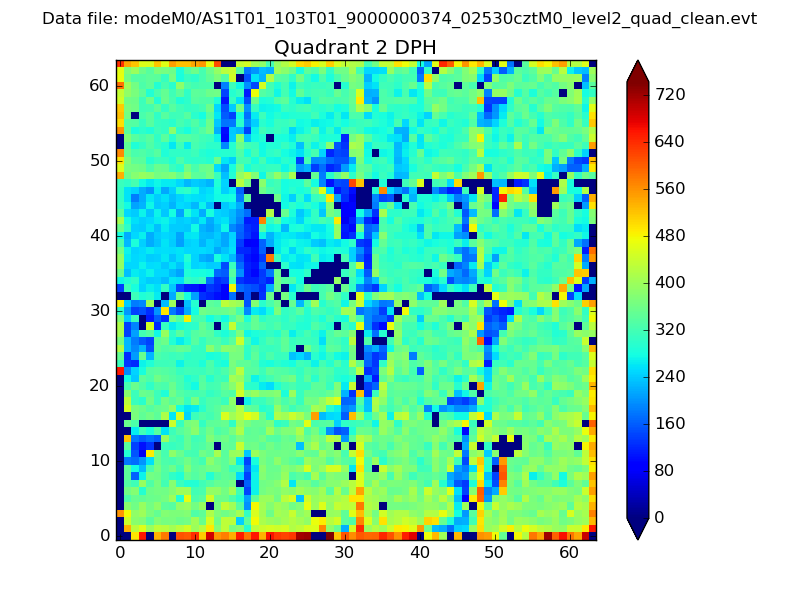
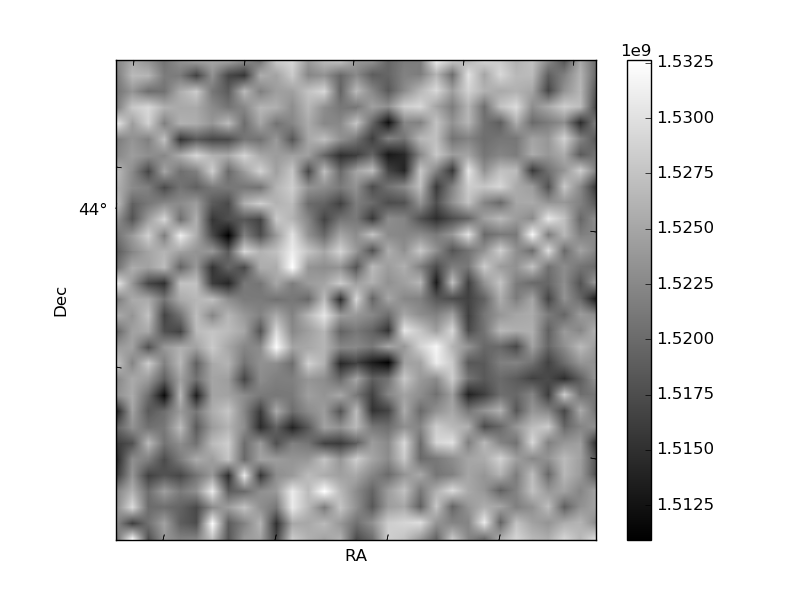
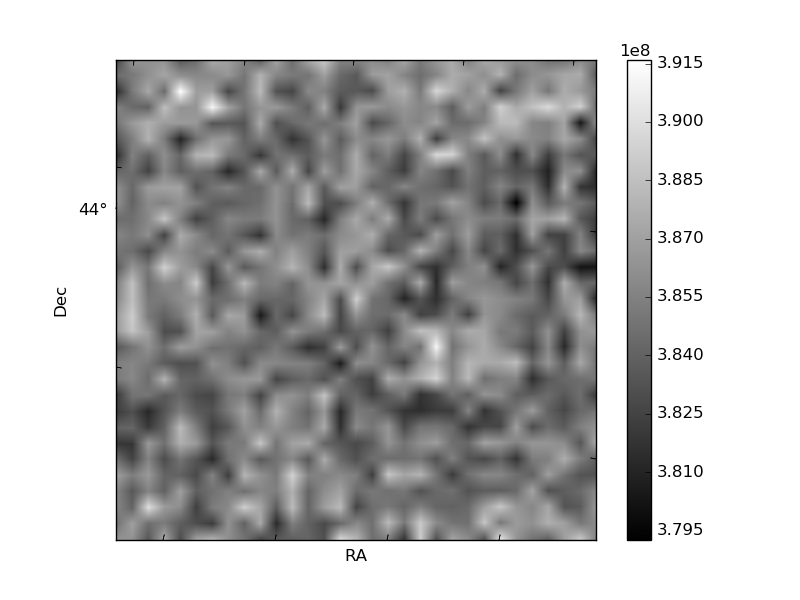
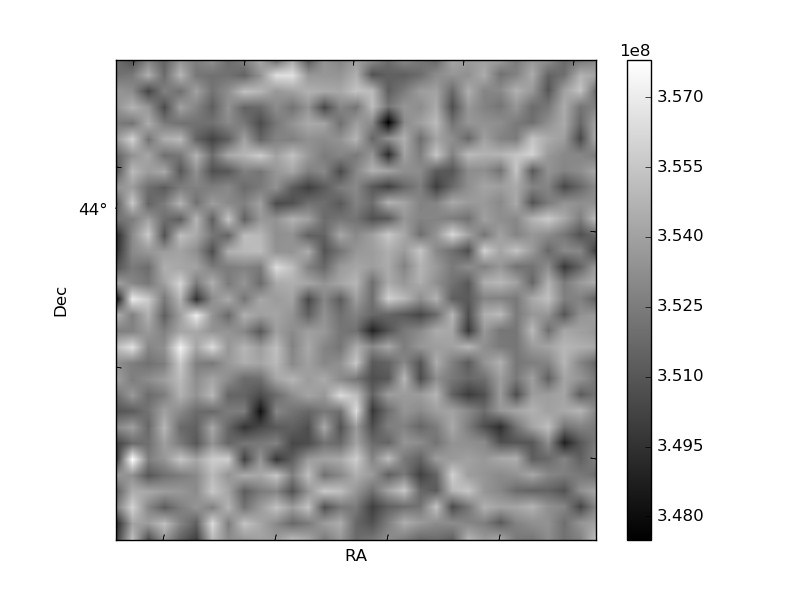
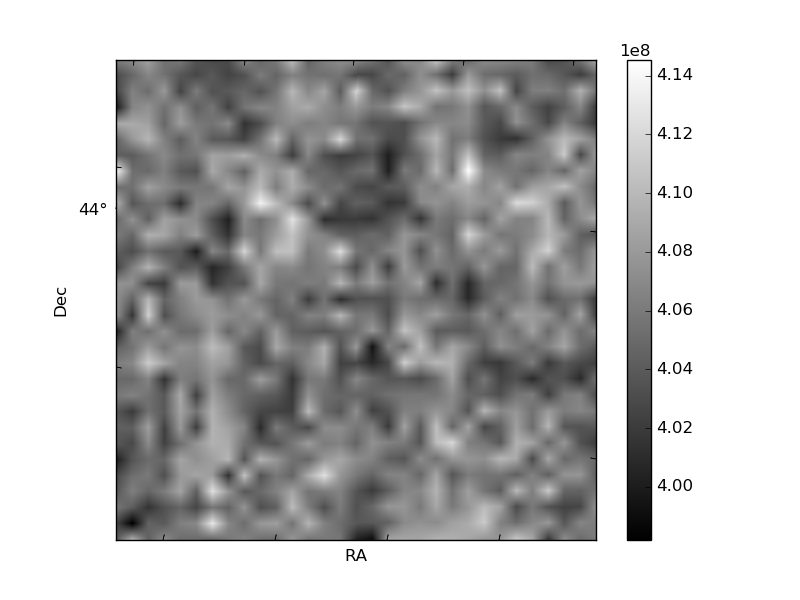
Histogram calculated using DETX and DETY for each event in the final _common_clean file
| Quadrant A | 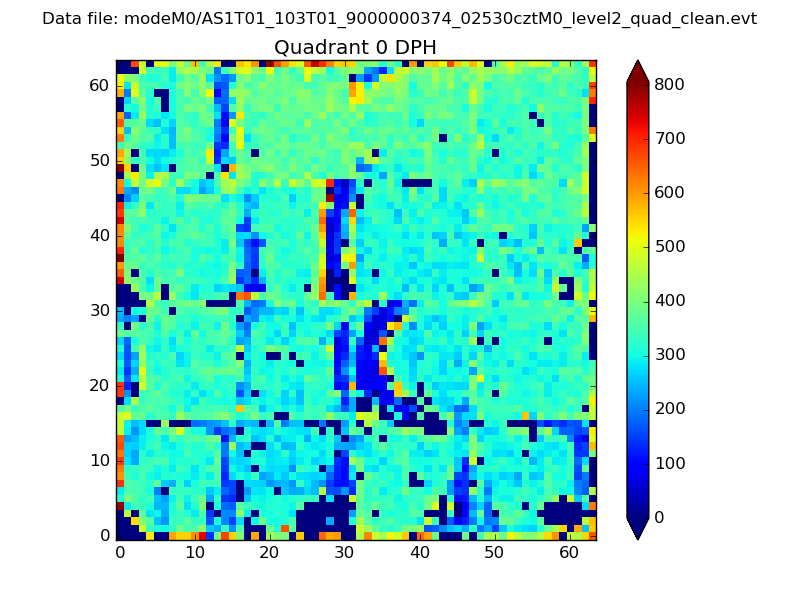 |
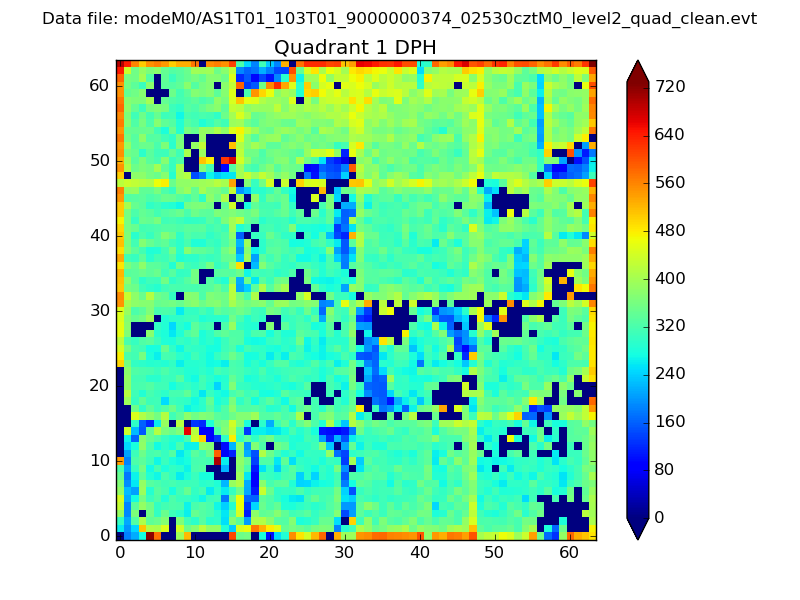 |
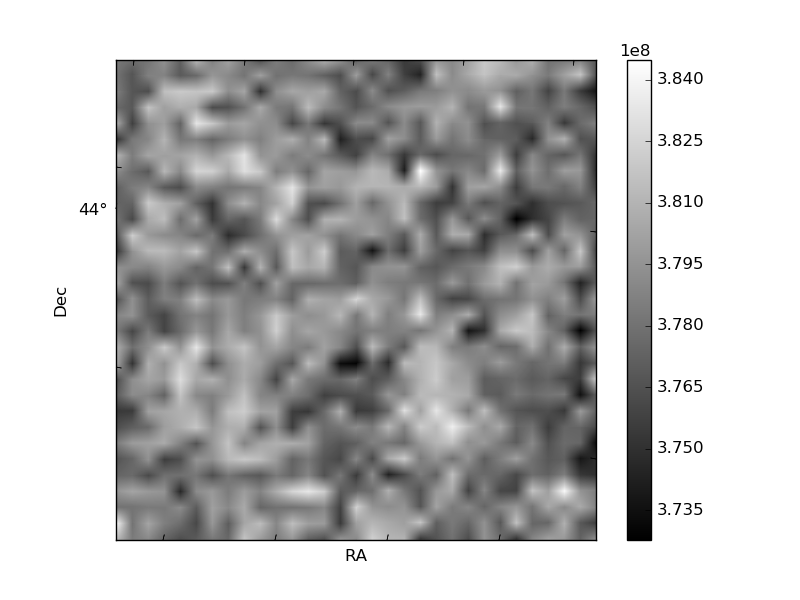
Quadrant B |
|---|---|---|---|
| Quadrant D | 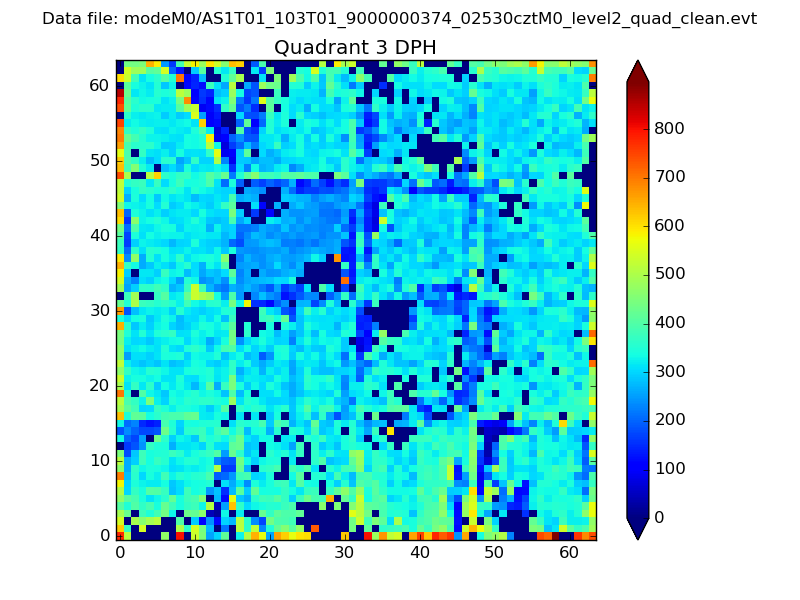 |
 |
Quadrant C |
| Plot type | Count rate plots | Images |
|---|---|---|
| Comparison with Poisson distribution Blue bars denote a histogram of data divided into 1 sec bins. Red curve is a Poisson curve with rate = median count rate of data. |
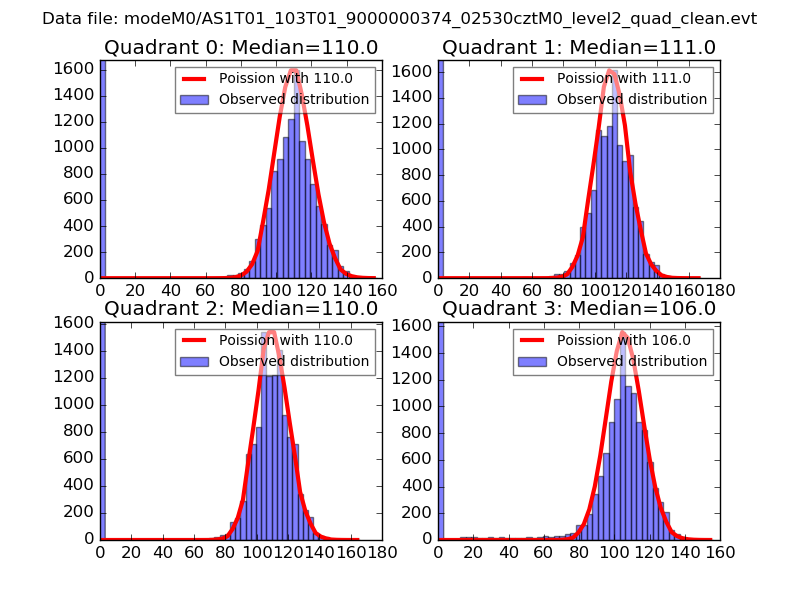 |
 |
| Quadrant-wise count rates Data is divided into 100 sec bins |
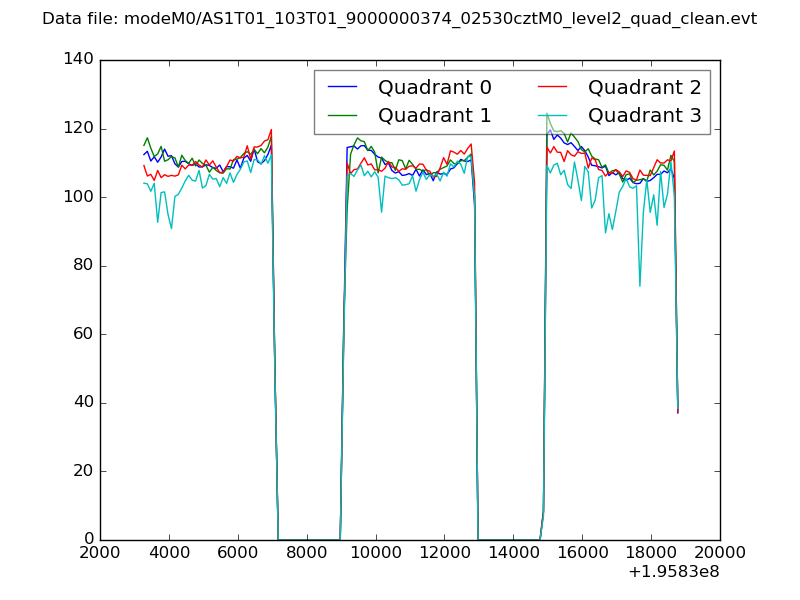 |
|
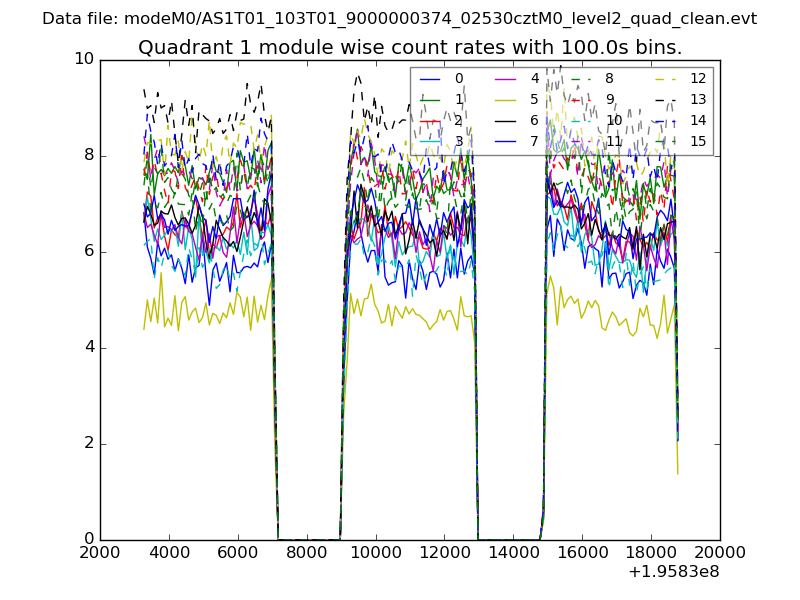
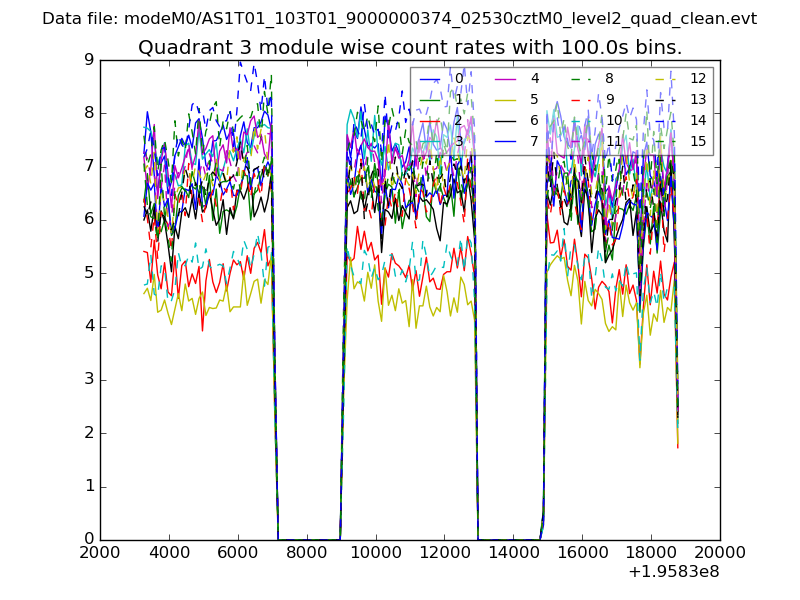
| Module-wise count rates for Quadrant A Data is divided into 100 sec bins |
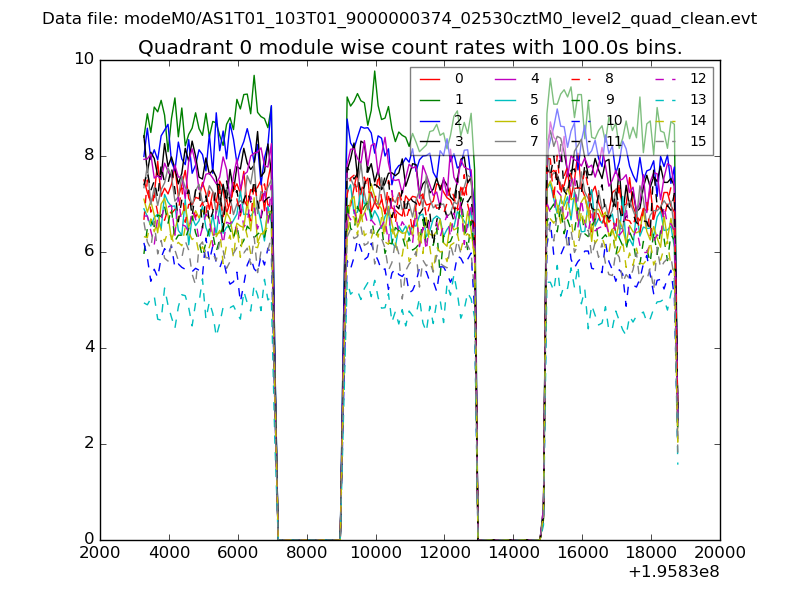 |
 |
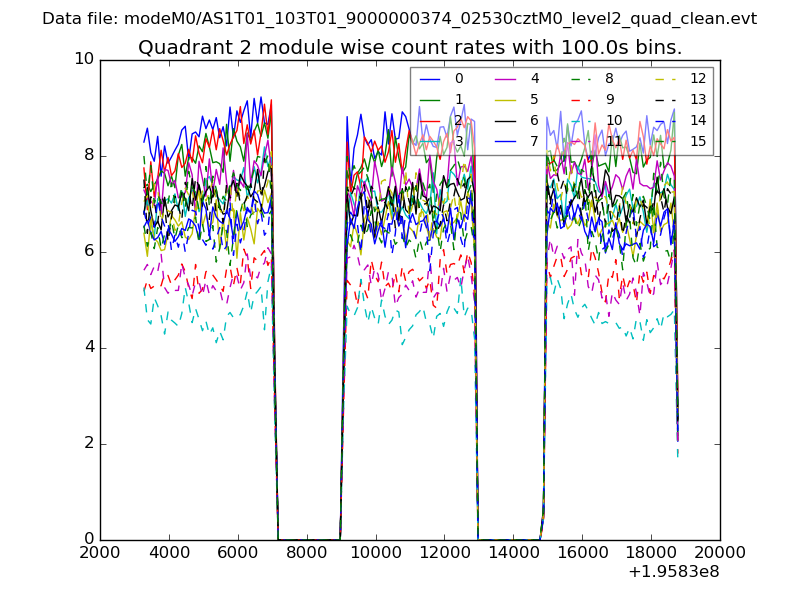
| Module-wise count rates for Quadrant B Data is divided into 100 sec bins |
 |
 |
| Module-wise count rates for Quadrant C Data is divided into 100 sec bins |
 |
 |
| Module-wise count rates for Quadrant D Data is divided into 100 sec bins |
 |
 |
| Parameter | Plot |
|---|---|
| CZT HV Monitor | 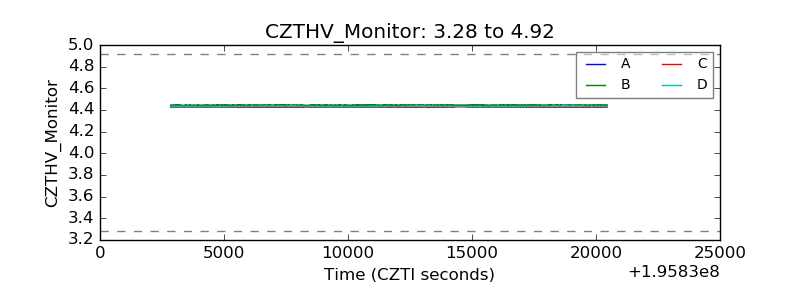 |
| D_VDD | 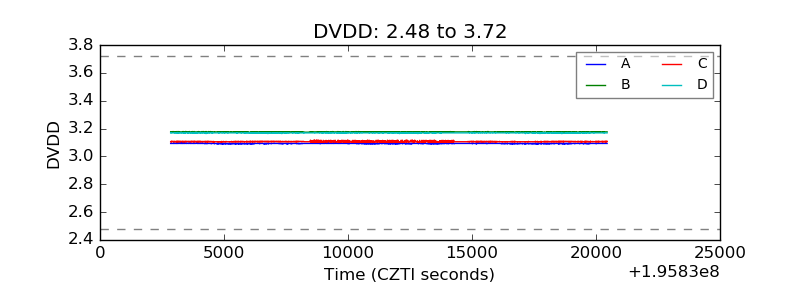 |
| Temperature 1 | 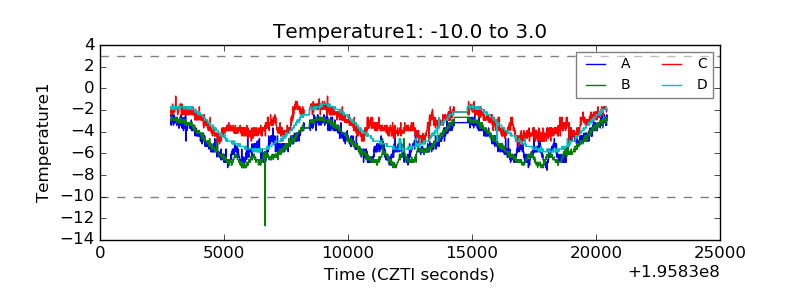 |
| Veto HV Monitor | 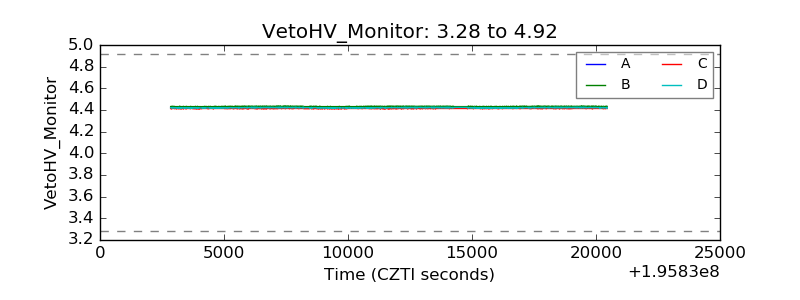 |
| Veto LLD | 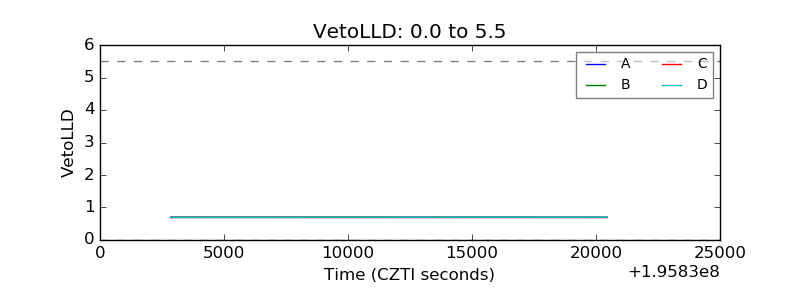 |
| Alpha Counter | 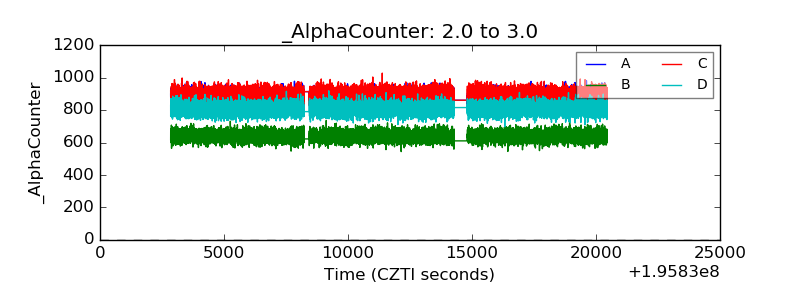 |
| _CPM_Rate | 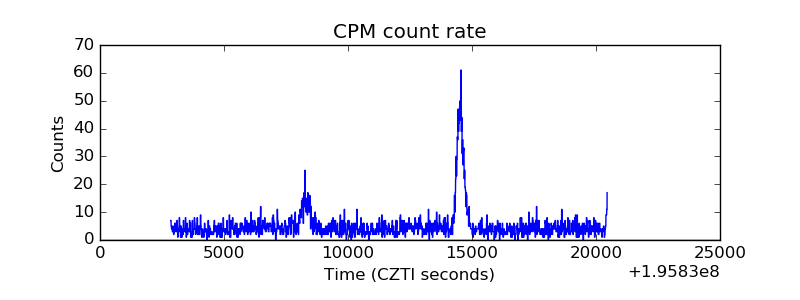 |
| CZT Counter | 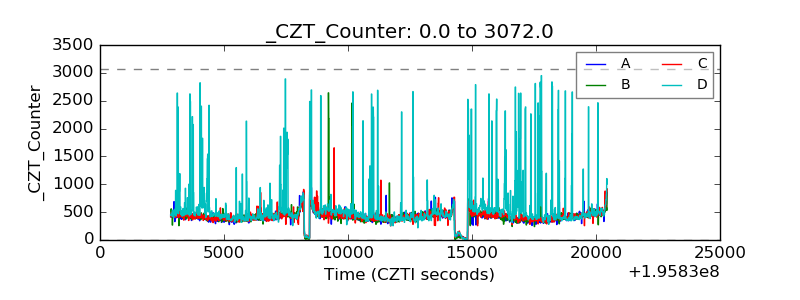 |
| +2.5 Volts monitor |  |
| +5 Volts monitor |  |
| _ROLL_ROT | 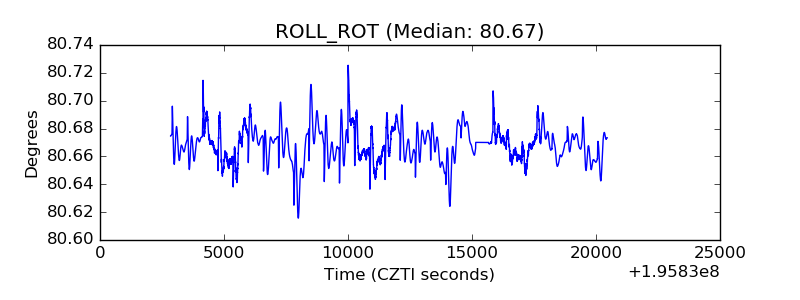 |
| _Roll_DEC | 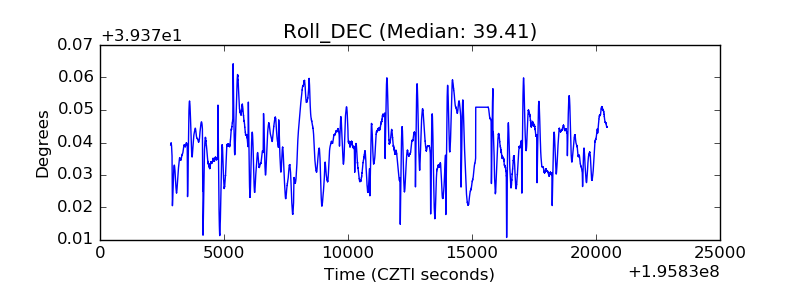 |
| _Roll_RA | 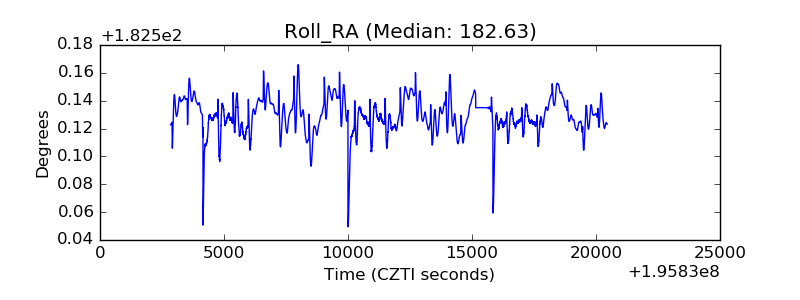 |
| Veto Counter | 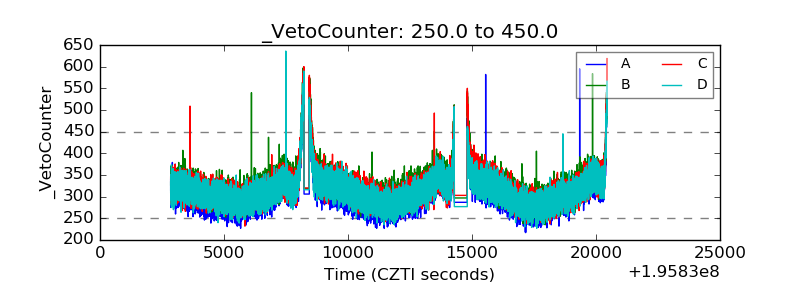 |