| Param | Original file | Final file |
|---|---|---|
| Filename | modeM0/AS1SLEW_01234_9000000375_02530cztM0_level2.evt | modeM0/AS1SLEW_01234_9000000375_02530cztM0_level2_quad_clean.evt |
| Size (bytes) | 10,566,720 | 1,955,520 |
| Size | 10.1 MB | 1.9 MB |
| Events in quadrant A | 58,165 | 11,200 |
| Events in quadrant B | 58,087 | 11,756 |
| Events in quadrant C | 61,772 | 11,239 |
| Events in quadrant D | 131,036 | 8,548 |
| Mode M0 | |||
|---|---|---|---|
| Quadrant | BADHDUFLAG | Total packets | Discarded packets |
| A | 0 | 240 | 1 |
| B | 0 | 236 | 1 |
| C | 0 | 252 | 1 |
| D | 0 | 463 | 1 |
| Mode M9 | |||
|---|---|---|---|
| Quadrant | BADHDUFLAG | Total packets | Discarded packets |
| A | 0 | 6 | 0 |
| B | 0 | 6 | 0 |
| C | 0 | 6 | 0 |
| D | 0 | 6 | 0 |
| Mode SS | |||
|---|---|---|---|
| Quadrant | BADHDUFLAG | Total packets | Discarded packets |
| A | 0 | 4 | 0 |
| B | 0 | 4 | 0 |
| C | 0 | 4 | 0 |
| D | 0 | 4 | 0 |
| Quadrant | Total seconds | Saturated seconds | Saturation percentage |
|---|---|---|---|
| A | 105 | 5 | 4.761905% |
| B | 105 | 4 | 3.809524% |
| C | 105 | 2 | 1.904762% |
| D | 105 | 34 | 32.380952% |
Noise dominated data is calculated using 1-second bins in cleaned event files. If a bin has >2000 counts, and if more than 50% of those come from <1% of pixels, then it is considered to be noise-dominated and hence unusable.
| Quadrant | # 1 sec bins | Bins with >0 counts | Bins with >2000 counts | High rate bins dominated by noise | Noise dominated (total time) | Noise dominated (detector-on time) | Marked lightcurve |
|---|---|---|---|---|---|---|---|
| A | 105 | 105 | 0 | 0 | 0.00% | 0.00% |  |
| B | 105 | 105 | 0 | 0 | 0.00% | 0.00% | 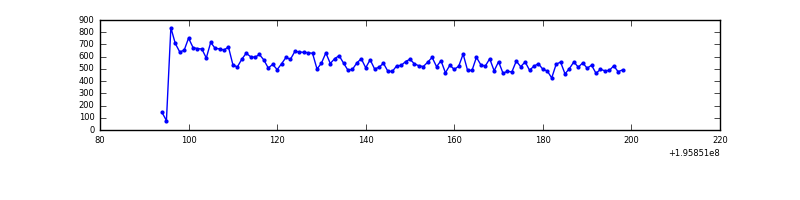 |
| C | 105 | 105 | 0 | 0 | 0.00% | 0.00% |  |
| D | 105 | 105 | 22 | 22 | 20.95% | 20.95% |  |
Top three noisy pixels from each quadrant. If the there are fewer than three noisy pixels in the level2.evt file, extra rows are filled as -1
| Pixel properties | Quadrant properties | ||||||
|---|---|---|---|---|---|---|---|
| Quadrant | DetID | PixID | Counts | Sigma | Mean | Median | Sigma |
| A | 0 | 199 | 1383 | 277.21 | 14 | 14 | 4.9 |
| A | 0 | 226 | 278 | 53.46 | 14 | 14 | 4.9 |
| A | 12 | 194 | 172 | 31.99 | 14 | 14 | 4.9 |
| B | 15 | 255 | 225 | 43.87 | 14 | 14 | 4.8 |
| B | 6 | 36 | 202 | 39.08 | 14 | 14 | 4.8 |
| B | 12 | 111 | 199 | 38.46 | 14 | 14 | 4.8 |
| C | 2 | 53 | 4745 | 934.86 | 14 | 14 | 5.1 |
| C | 7 | 159 | 337 | 63.83 | 14 | 14 | 5.1 |
| C | 8 | 128 | 147 | 26.28 | 14 | 14 | 5.1 |
| D | 11 | 130 | 73215 | 16845.62 | 11 | 11 | 4.3 |
| D | 11 | 131 | 9172 | 2108.12 | 11 | 11 | 4.3 |
| D | 2 | 184 | 2108 | 482.56 | 11 | 11 | 4.3 |
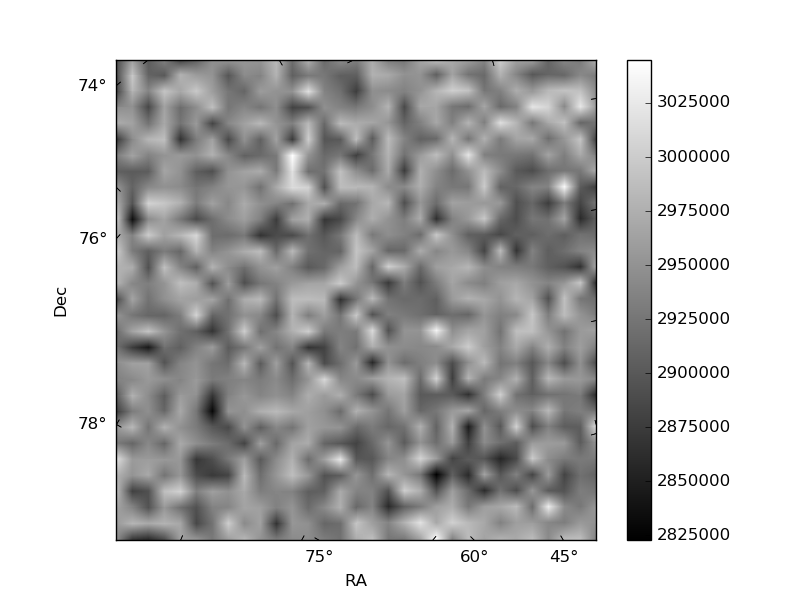
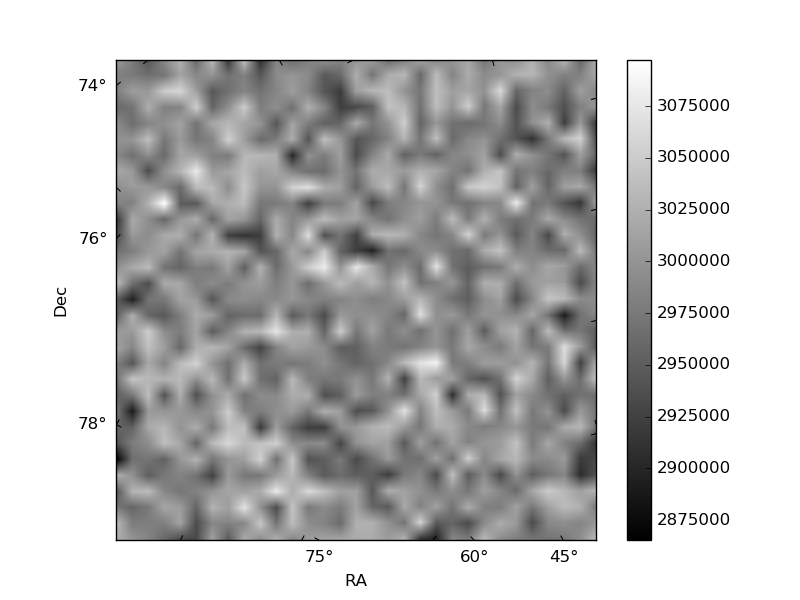
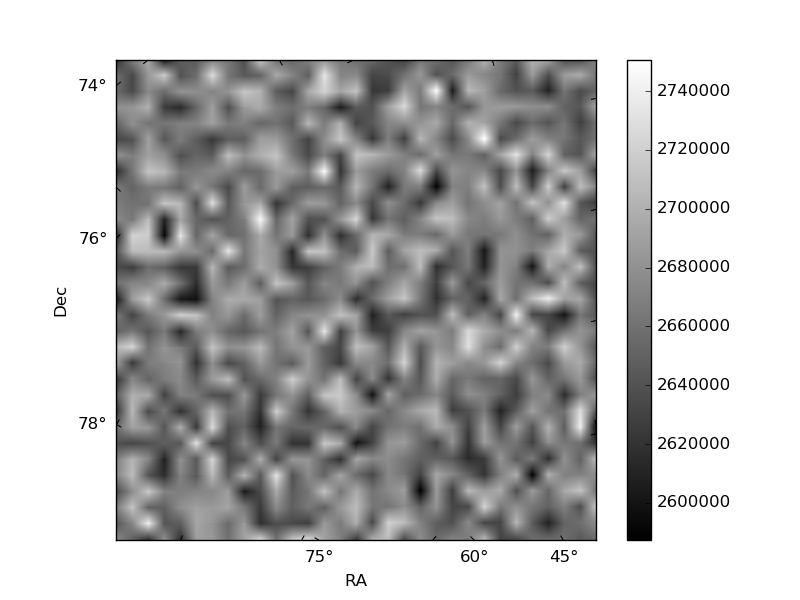
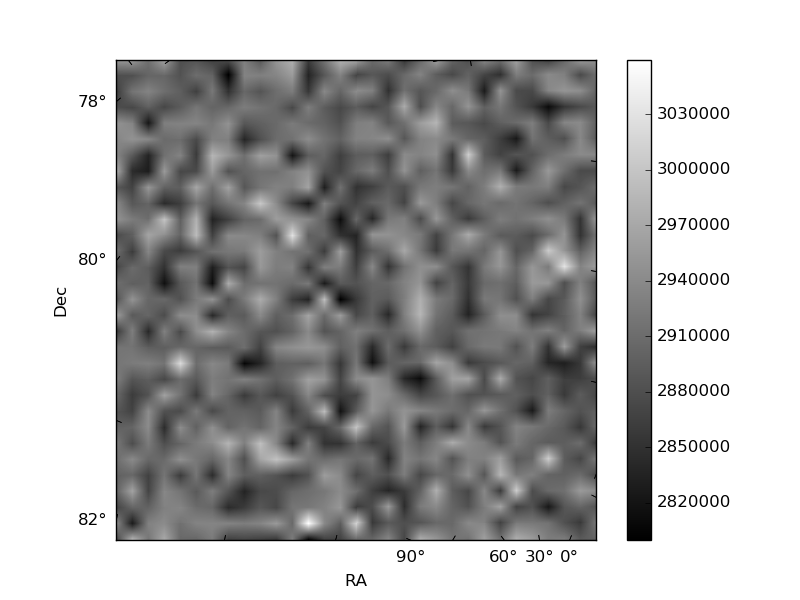
Histogram calculated using DETX and DETY for each event in the final _common_clean file
| Quadrant A | 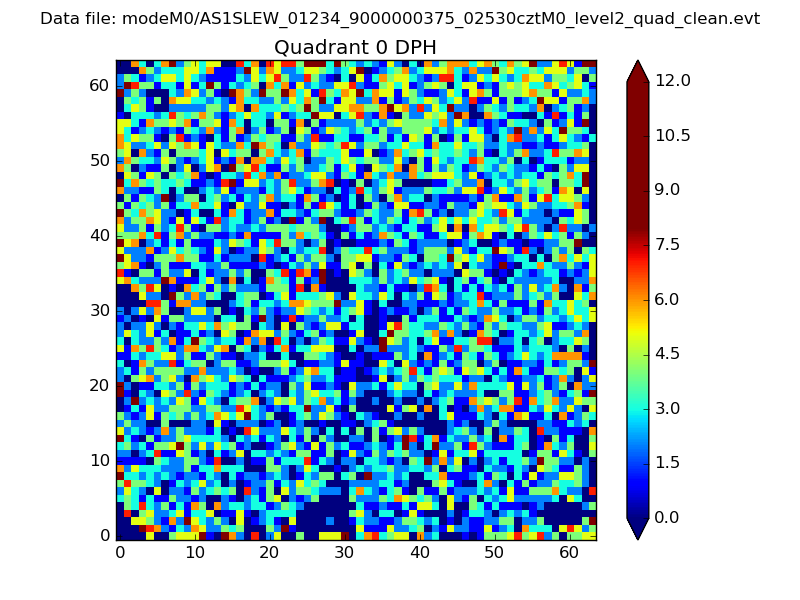 |
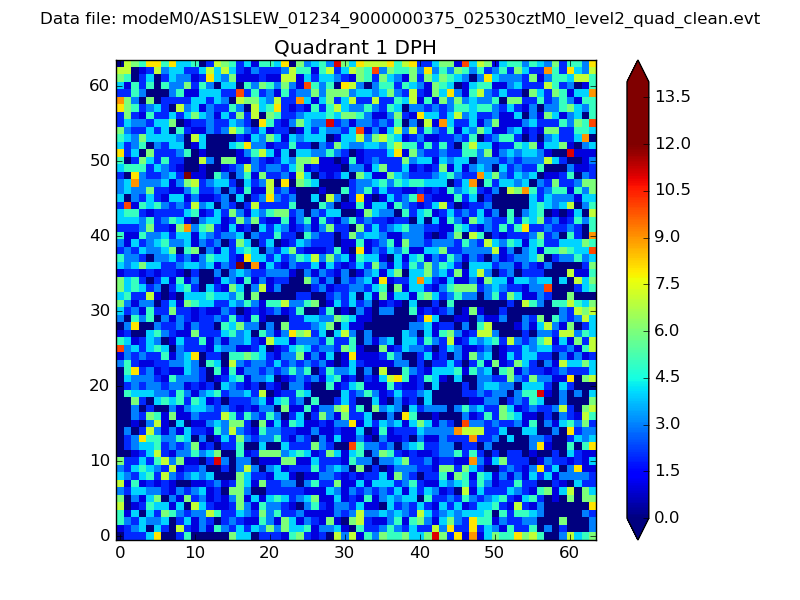 |
Quadrant B |
|---|---|---|---|
| Quadrant D | 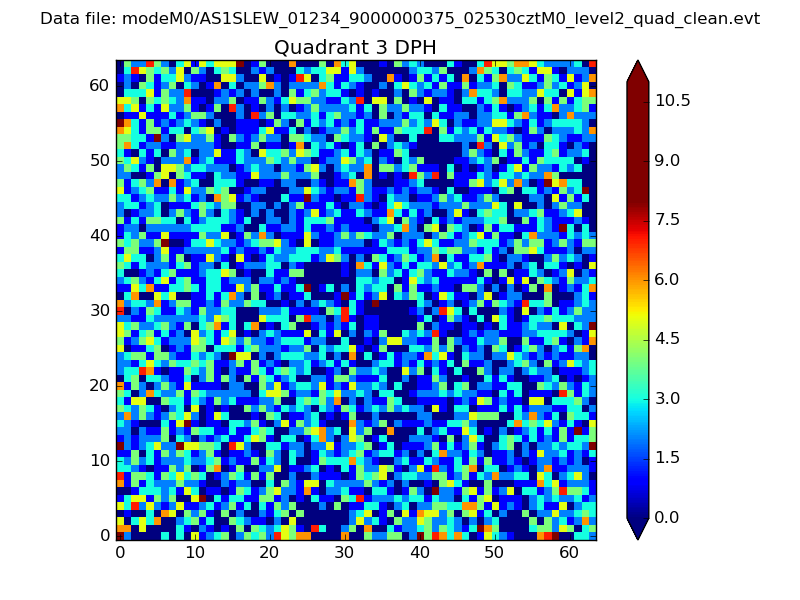 |
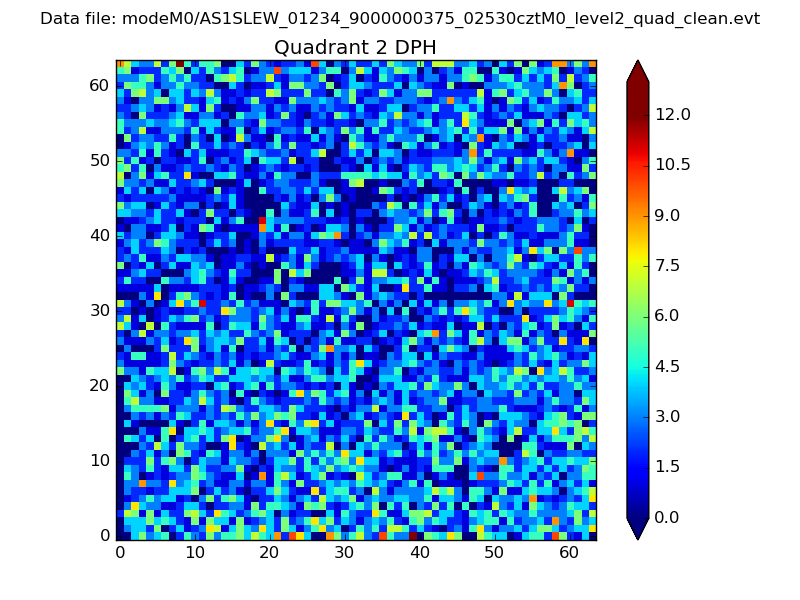 |
Quadrant C |
| Plot type | Count rate plots | Images |
|---|---|---|
| Comparison with Poisson distribution Blue bars denote a histogram of data divided into 1 sec bins. Red curve is a Poisson curve with rate = median count rate of data. |
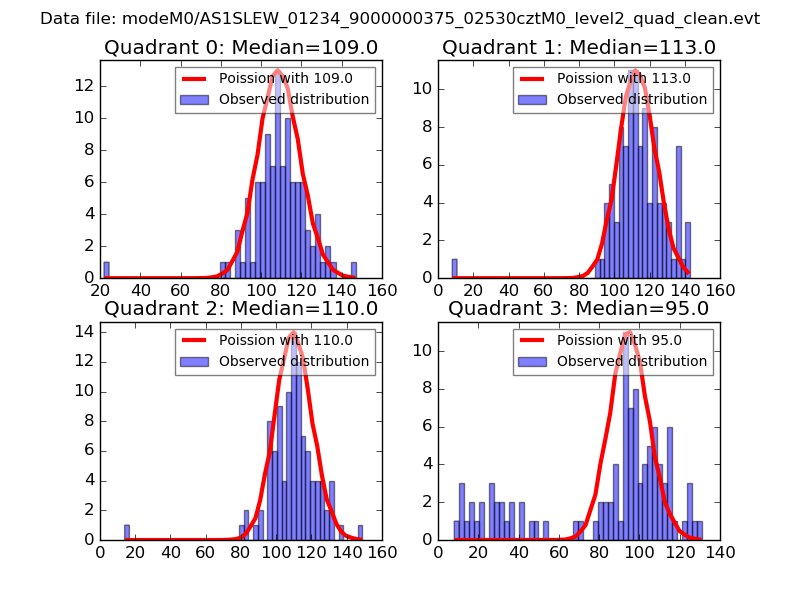 |
 |
| Quadrant-wise count rates Data is divided into 100 sec bins |
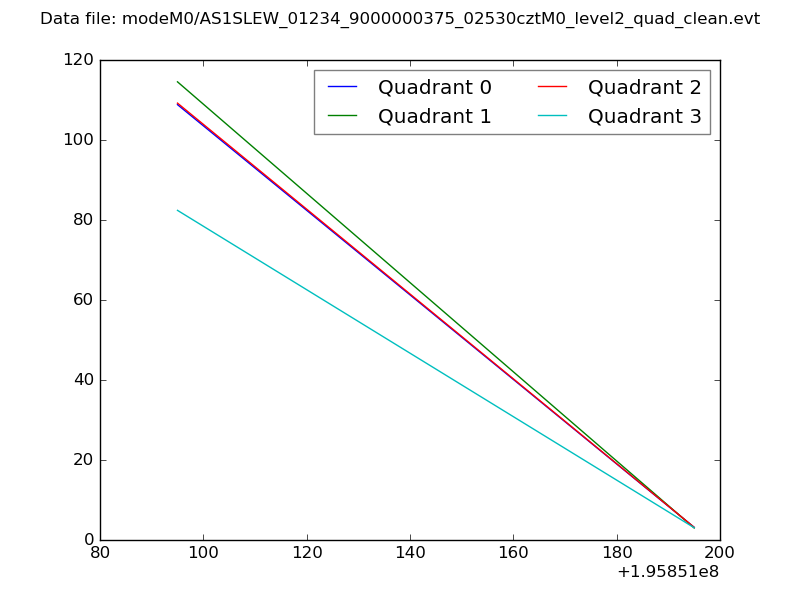 |
|
| Module-wise count rates for Quadrant A Data is divided into 100 sec bins |
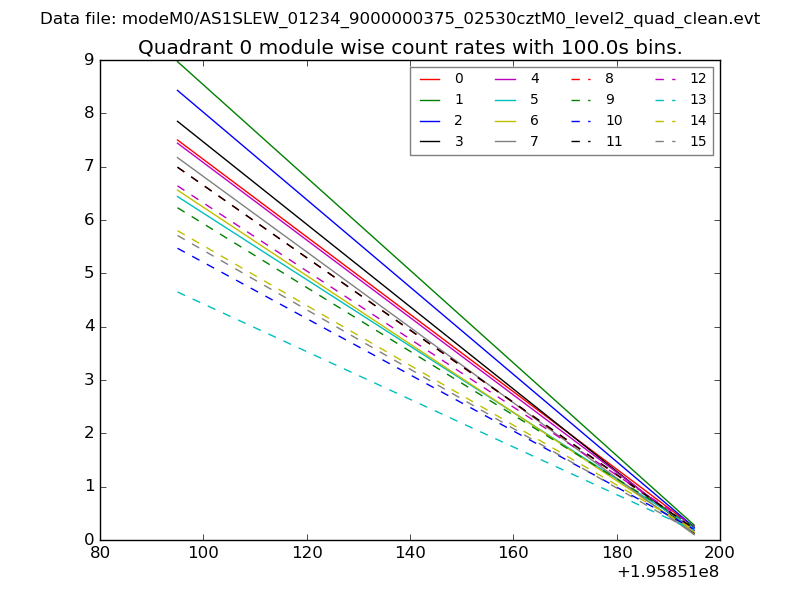 |
 |
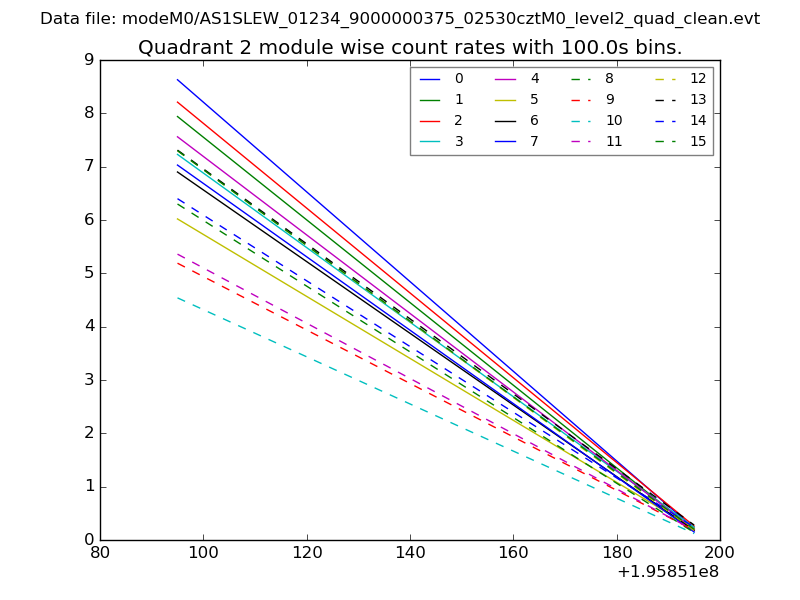
| Module-wise count rates for Quadrant B Data is divided into 100 sec bins |
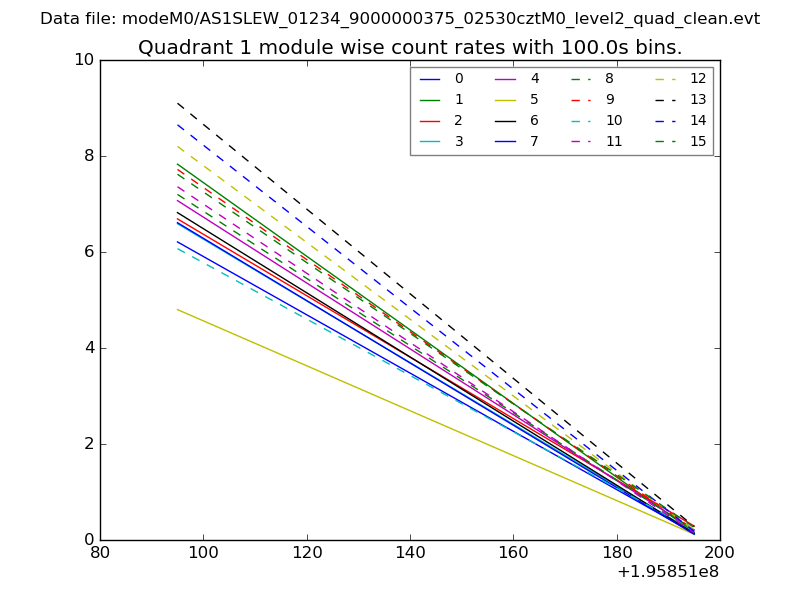 |
 |
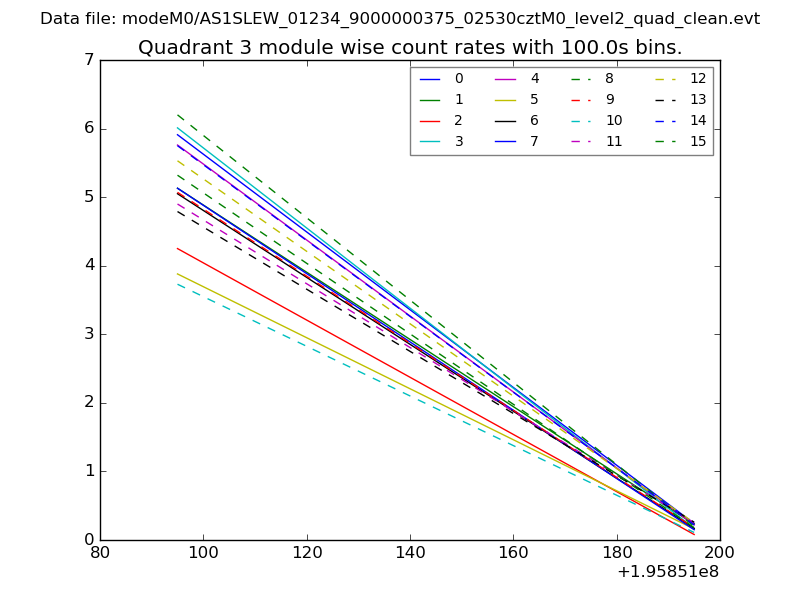
| Module-wise count rates for Quadrant C Data is divided into 100 sec bins |
 |
 |
| Module-wise count rates for Quadrant D Data is divided into 100 sec bins |
 |
 |
| Parameter | Plot |
|---|---|
| CZT HV Monitor | 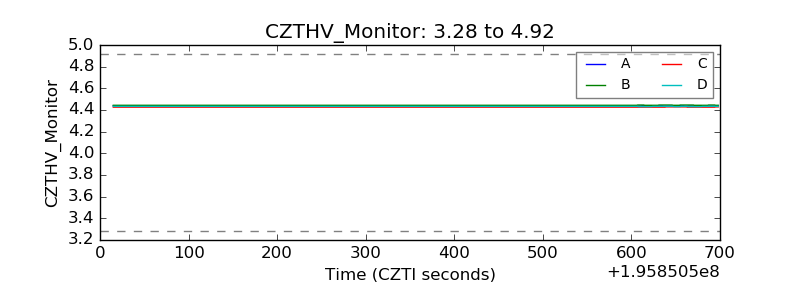 |
| D_VDD | 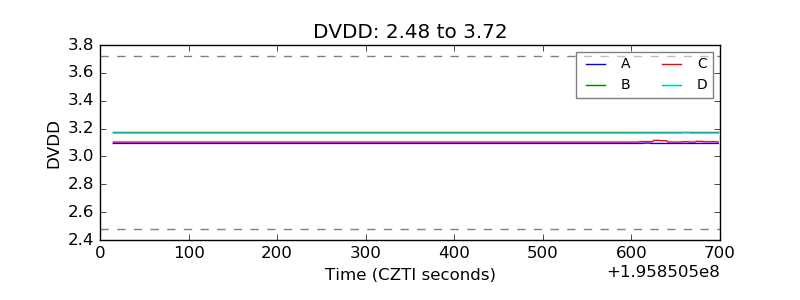 |
| Temperature 1 | 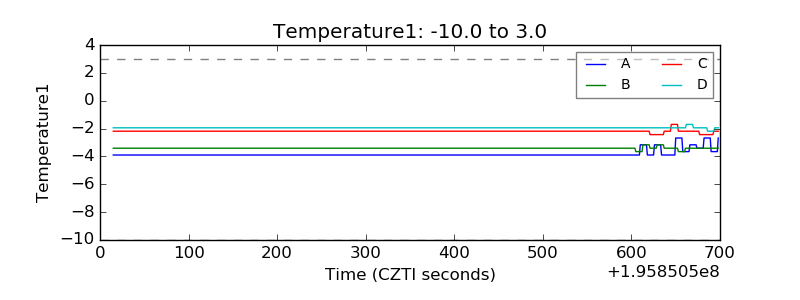 |
| Veto HV Monitor | 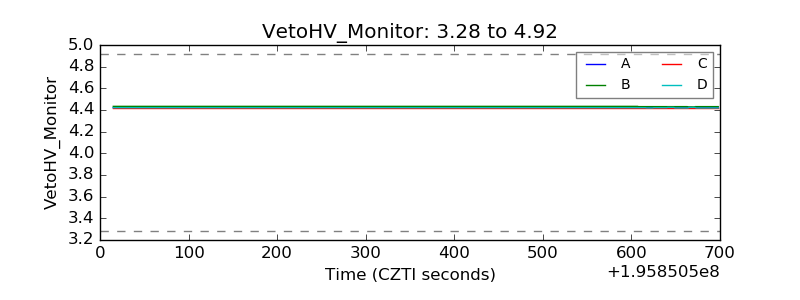 |
| Veto LLD | 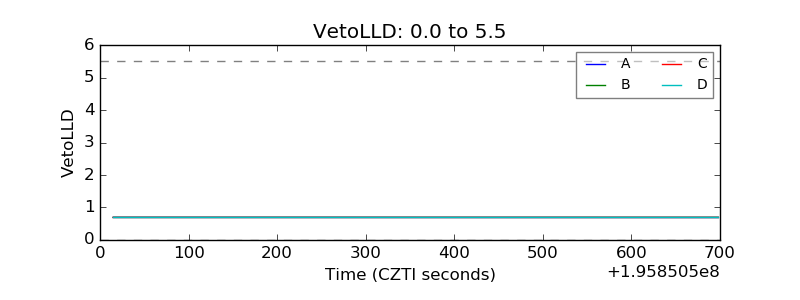 |
| Alpha Counter | 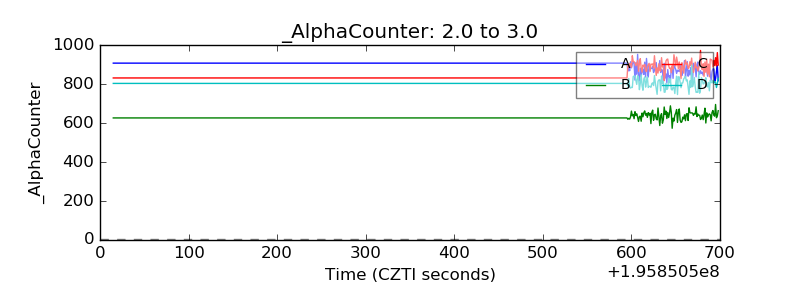 |
| _CPM_Rate | 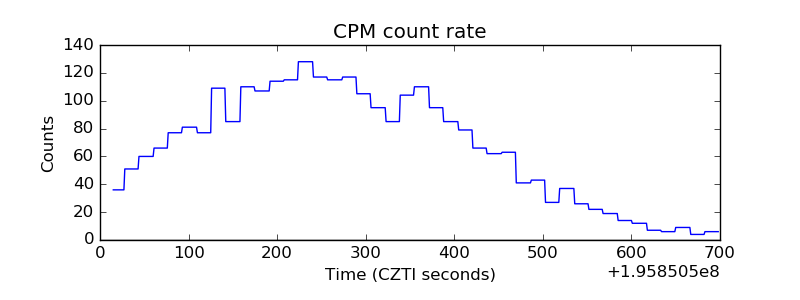 |
| CZT Counter | 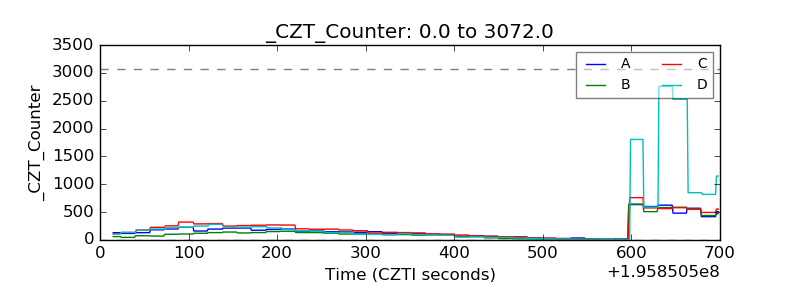 |
| +2.5 Volts monitor |  |
| +5 Volts monitor |  |
| Veto Counter | 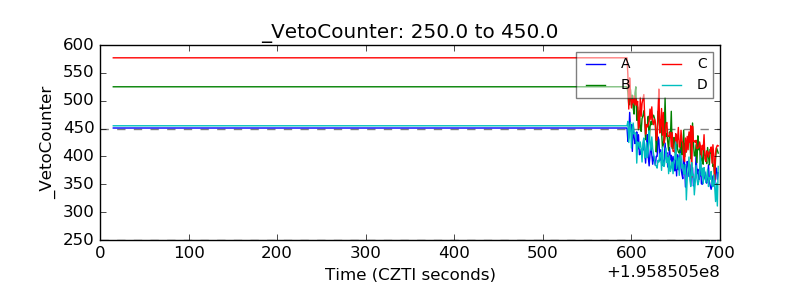 |