| Param | Original file | Final file |
|---|---|---|
| Filename | modeM0/AS1T01_034T01_9000000378cztM0_level2.fits | modeM0/AS1T01_034T01_9000000378cztM0_level2_quad_clean.evt |
| Size (bytes) | 391,340,160 | 604,969,920 |
| Size | 373.2 MB | 576.9 MB |
| Events in quadrant A | 2,322,526 | 3,946,637 |
| Events in quadrant B | 2,264,852 | 4,029,436 |
| Events in quadrant C | 2,304,324 | 3,937,650 |
| Events in quadrant D | 1,838,894 | 3,291,230 |
| Mode M0 | |||
|---|---|---|---|
| Quadrant | BADHDUFLAG | Total packets | Discarded packets |
| A | 0 | 93208 | 0 |
| B | 0 | 93142 | 0 |
| C | 0 | 92807 | 0 |
| D | 0 | 144165 | 0 |
| Mode M9 | |||
|---|---|---|---|
| Quadrant | BADHDUFLAG | Total packets | Discarded packets |
| A | 0 | 80 | 0 |
| B | 0 | 80 | 0 |
| C | 0 | 80 | 0 |
| D | 0 | 80 | 0 |
| Mode SS | |||
|---|---|---|---|
| Quadrant | BADHDUFLAG | Total packets | Discarded packets |
| A | 0 | 926 | 0 |
| B | 0 | 926 | 0 |
| C | 0 | 926 | 0 |
| D | 0 | 926 | 0 |
| Quadrant | Total seconds | Saturated seconds | Saturation percentage |
|---|---|---|---|
| A | 45438 | 359 | 0.790088% |
| B | 45438 | 314 | 0.691052% |
| C | 45438 | 179 | 0.393943% |
| D | 45438 | 4328 | 9.525067% |
Noise dominated data is calculated using 1-second bins in cleaned event files. If a bin has >2000 counts, and if more than 50% of those come from <1% of pixels, then it is considered to be noise-dominated and hence unusable.
| Quadrant | # 1 sec bins | Bins with >0 counts | Bins with >2000 counts | High rate bins dominated by noise | Noise dominated (total time) | Noise dominated (detector-on time) | Marked lightcurve |
|---|---|---|---|---|---|---|---|
| A | 53543 | 45438 | 0 | 0 | 0.00% | 0.00% |  |
| B | 53543 | 45438 | 0 | 0 | 0.00% | 0.00% |  |
| C | 53543 | 45438 | 0 | 0 | 0.00% | 0.00% |  |
| D | 53543 | 45196 | 0 | 0 | 0.00% | 0.00% |  |
Top three noisy pixels from each quadrant. If the there are fewer than three noisy pixels in the level2.evt file, extra rows are filled as -1
| Pixel properties | Quadrant properties | ||||||
|---|---|---|---|---|---|---|---|
| Quadrant | DetID | PixID | Counts | Sigma | Mean | Median | Sigma |
| A | 0 | 29 | 2177 | 10.18 | 603 | 564 | 158.4 |
| A | 7 | 110 | 2073 | 9.53 | 603 | 564 | 158.4 |
| A | 0 | 28 | 1641 | 6.8 | 603 | 564 | 158.4 |
| B | 2 | 9 | 2071 | 13.11 | 597 | 572 | 114.4 |
| B | 12 | 226 | 1767 | 10.45 | 597 | 572 | 114.4 |
| B | 14 | 254 | 1576 | 8.78 | 597 | 572 | 114.4 |
| C | 7 | 111 | 1655 | 6.51 | 609 | 563 | 167.6 |
| C | 2 | 191 | 1574 | 6.03 | 609 | 563 | 167.6 |
| C | 1 | 81 | 1563 | 5.96 | 609 | 563 | 167.6 |
| D | 3 | 14 | 1416 | 6.33 | 525 | 477 | 148.2 |
| D | 11 | 82 | 1411 | 6.3 | 525 | 477 | 148.2 |
| D | 4 | 160 | 1387 | 6.14 | 525 | 477 | 148.2 |
Histogram calculated using DETX and DETY for each event in the final _common_clean file
| Quadrant A | 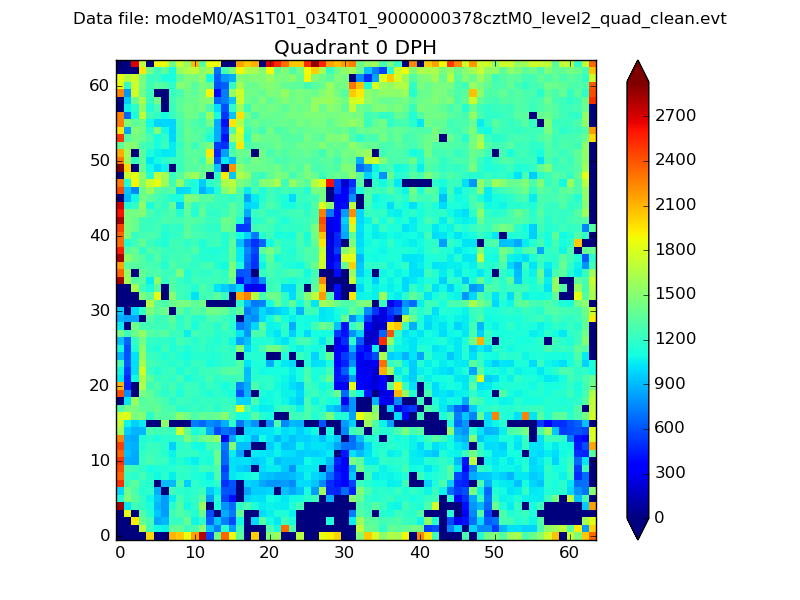 |
 |
Quadrant B |
|---|---|---|---|
| Quadrant D | 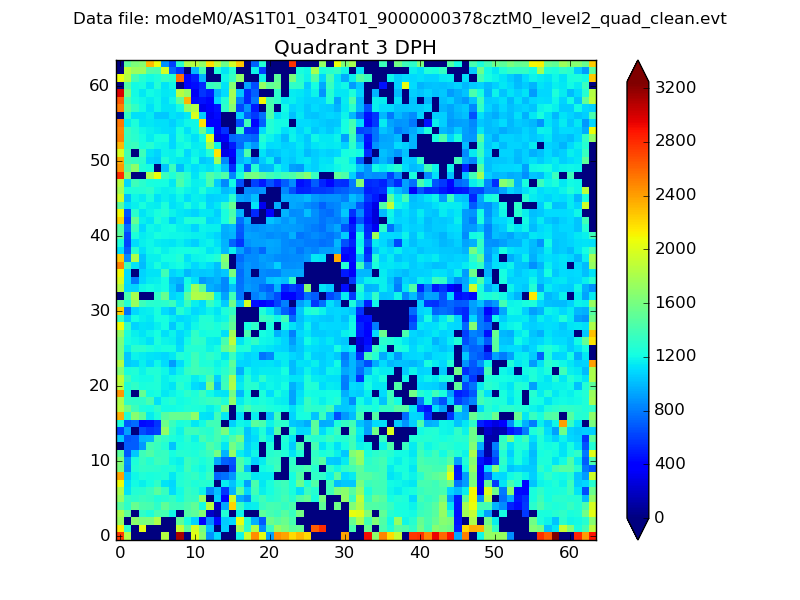 |
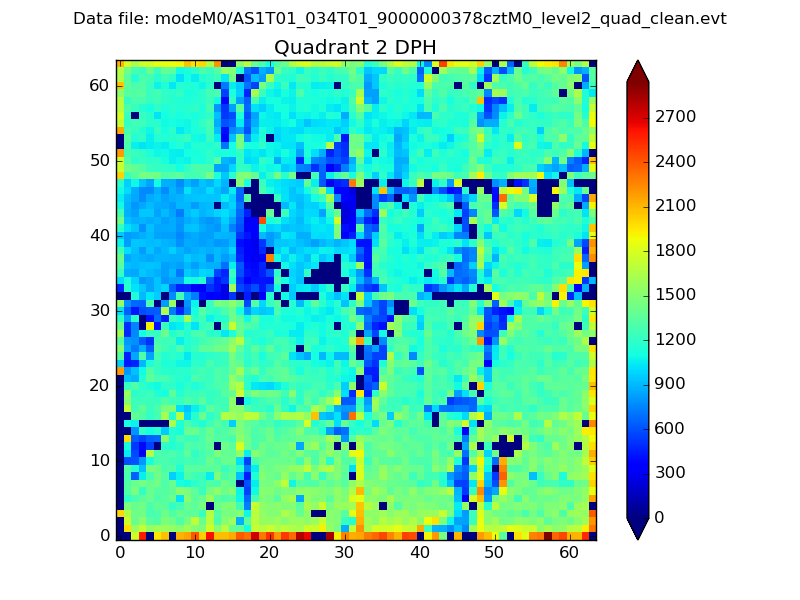 |
Quadrant C |
| Plot type | Count rate plots | Images |
|---|---|---|
| Comparison with Poisson distribution Blue bars denote a histogram of data divided into 1 sec bins. Red curve is a Poisson curve with rate = median count rate of data. |
 |
 |
| Quadrant-wise count rates Data is divided into 100 sec bins |
 |
|
| Module-wise count rates for Quadrant A Data is divided into 100 sec bins |
 |
 |
| Module-wise count rates for Quadrant B Data is divided into 100 sec bins |
 |
 |
| Module-wise count rates for Quadrant C Data is divided into 100 sec bins |
 |
 |
| Module-wise count rates for Quadrant D Data is divided into 100 sec bins |
 |
 |
| Parameter | Plot |
|---|---|
| CZT HV Monitor |  |
| D_VDD |  |
| Temperature 1 |  |
| Veto HV Monitor |  |
| Veto LLD |  |
| Alpha Counter |  |
| _CPM_Rate |  |
| CZT Counter |  |
| +2.5 Volts monitor |  |
| +5 Volts monitor |  |
| _ROLL_ROT |  |
| _Roll_DEC |  |
| _Roll_RA |  |
| Veto Counter |  |