| Param | Original file | Final file |
|---|---|---|
| Filename | modeM0/AS1T01_034T01_9000000378_02527cztM0_level2.evt | modeM0/AS1T01_034T01_9000000378_02527cztM0_level2_quad_clean.evt |
| Size (bytes) | 37,039,680 | 7,441,920 |
| Size | 35.3 MB | 7.1 MB |
| Events in quadrant A | 193,964 | 46,239 |
| Events in quadrant B | 207,117 | 47,417 |
| Events in quadrant C | 207,441 | 47,864 |
| Events in quadrant D | 477,339 | 41,988 |
| Mode M0 | |||
|---|---|---|---|
| Quadrant | BADHDUFLAG | Total packets | Discarded packets |
| A | 0 | 951 | 1 |
| B | 0 | 957 | 0 |
| C | 0 | 957 | 0 |
| D | 0 | 1729 | 0 |
| Mode SS | |||
|---|---|---|---|
| Quadrant | BADHDUFLAG | Total packets | Discarded packets |
| A | 0 | 10 | 0 |
| B | 0 | 10 | 0 |
| C | 0 | 10 | 0 |
| D | 0 | 10 | 0 |
| Quadrant | Total seconds | Saturated seconds | Saturation percentage |
|---|---|---|---|
| A | 475 | 0 | 0.000000% |
| B | 475 | 1 | 0.210526% |
| C | 475 | 0 | 0.000000% |
| D | 475 | 87 | 18.315789% |
Noise dominated data is calculated using 1-second bins in cleaned event files. If a bin has >2000 counts, and if more than 50% of those come from <1% of pixels, then it is considered to be noise-dominated and hence unusable.
| Quadrant | # 1 sec bins | Bins with >0 counts | Bins with >2000 counts | High rate bins dominated by noise | Noise dominated (total time) | Noise dominated (detector-on time) | Marked lightcurve |
|---|---|---|---|---|---|---|---|
| A | 475 | 475 | 0 | 0 | 0.00% | 0.00% | 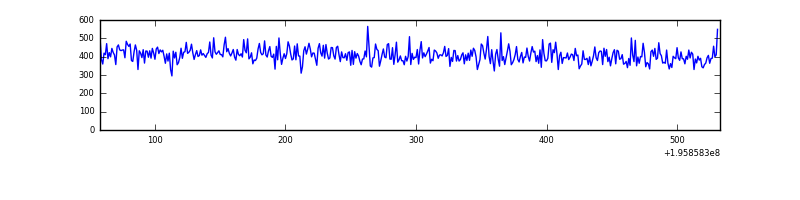 |
| B | 475 | 475 | 0 | 0 | 0.00% | 0.00% | 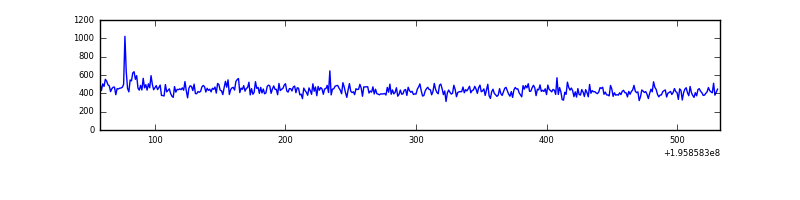 |
| C | 475 | 475 | 0 | 0 | 0.00% | 0.00% | 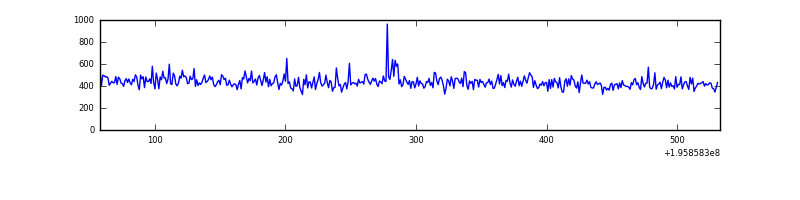 |
| D | 475 | 475 | 76 | 76 | 16.00% | 16.00% | 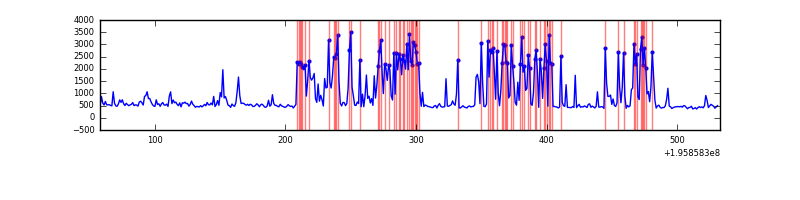 |
Top three noisy pixels from each quadrant. If the there are fewer than three noisy pixels in the level2.evt file, extra rows are filled as -1
| Pixel properties | Quadrant properties | ||||||
|---|---|---|---|---|---|---|---|
| Quadrant | DetID | PixID | Counts | Sigma | Mean | Median | Sigma |
| A | 12 | 194 | 627 | 46.47 | 50 | 48 | 12.5 |
| A | 0 | 226 | 592 | 43.66 | 50 | 48 | 12.5 |
| A | 13 | 254 | 363 | 25.28 | 50 | 48 | 12.5 |
| B | 10 | 244 | 2582 | 205.68 | 52 | 51 | 12.3 |
| B | 15 | 186 | 1431 | 112.15 | 52 | 51 | 12.3 |
| B | 12 | 111 | 746 | 56.48 | 52 | 51 | 12.3 |
| C | 9 | 162 | 2103 | 144.08 | 52 | 52 | 14.2 |
| C | 9 | 54 | 668 | 43.27 | 52 | 52 | 14.2 |
| C | 12 | 4 | 577 | 36.88 | 52 | 52 | 14.2 |
| D | 11 | 130 | 263493 | 20145.01 | 46 | 45 | 13.1 |
| D | 11 | 131 | 27782 | 2120.96 | 46 | 45 | 13.1 |
| D | 2 | 136 | 3515 | 265.34 | 46 | 45 | 13.1 |
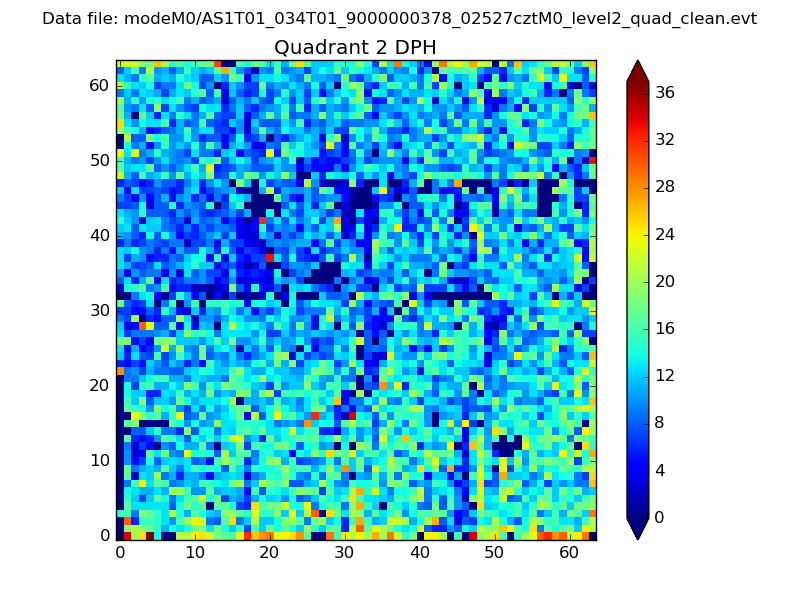
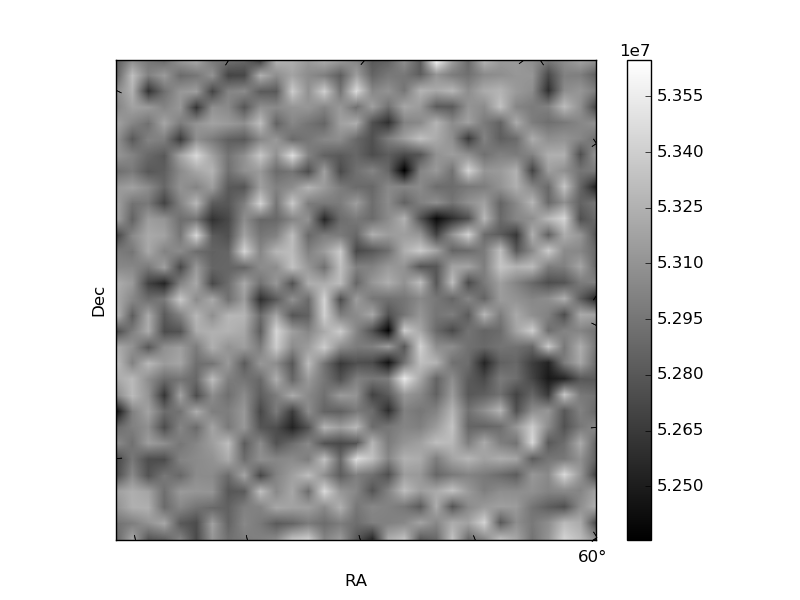
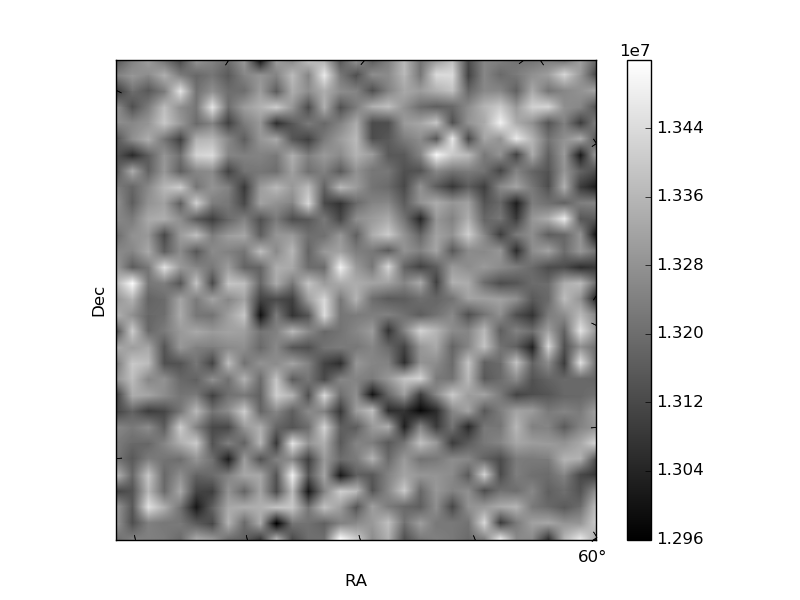
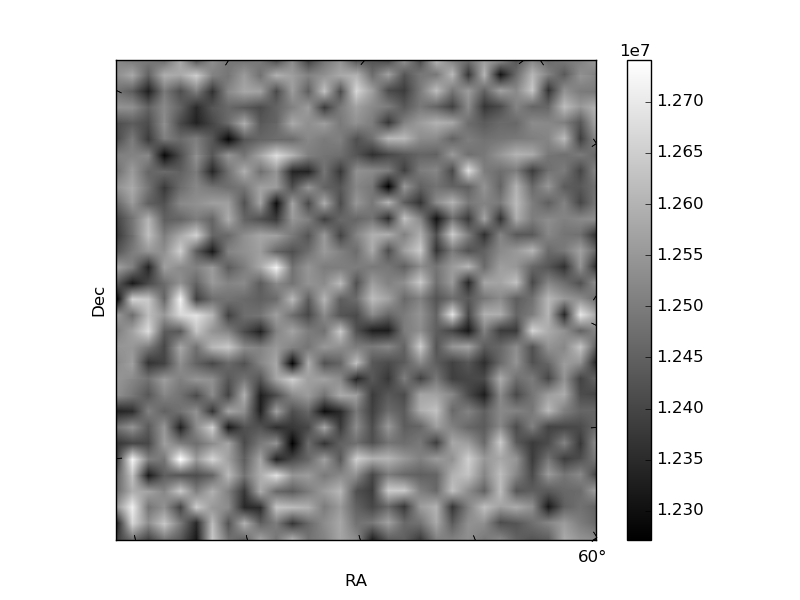
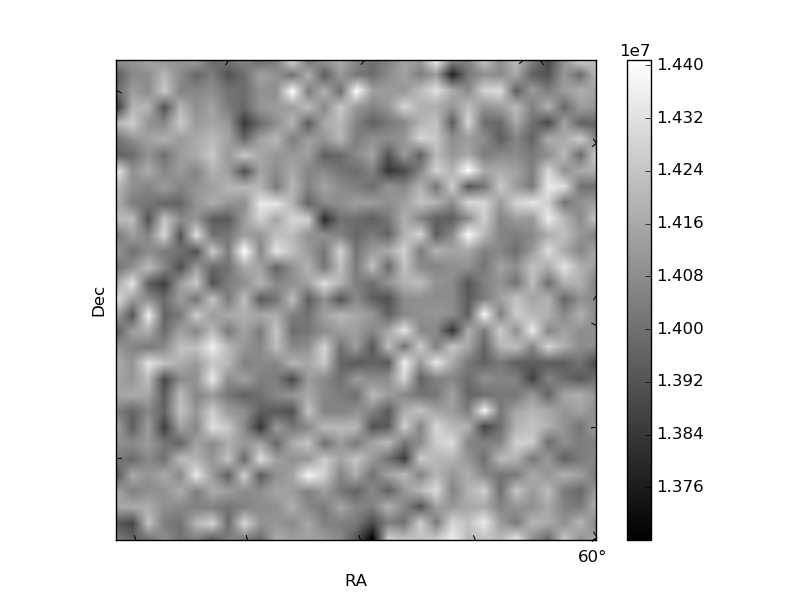
Histogram calculated using DETX and DETY for each event in the final _common_clean file
| Quadrant A | 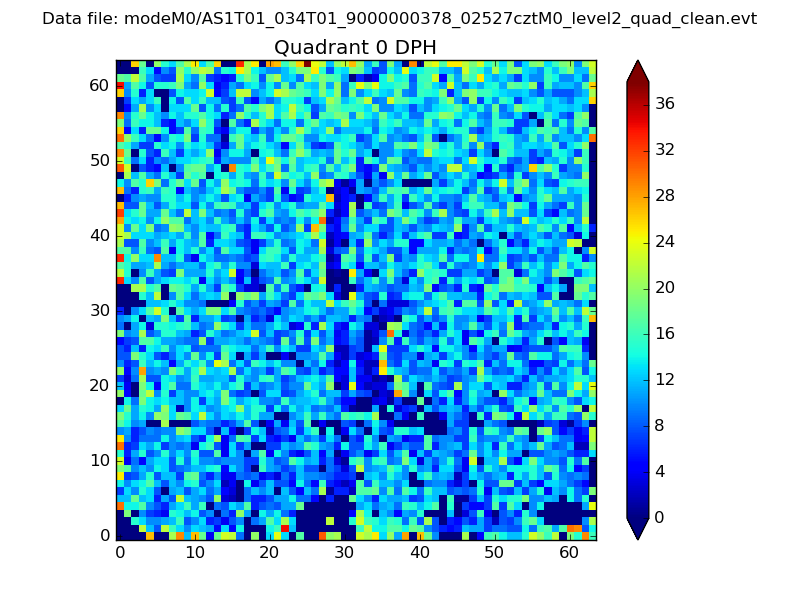 |
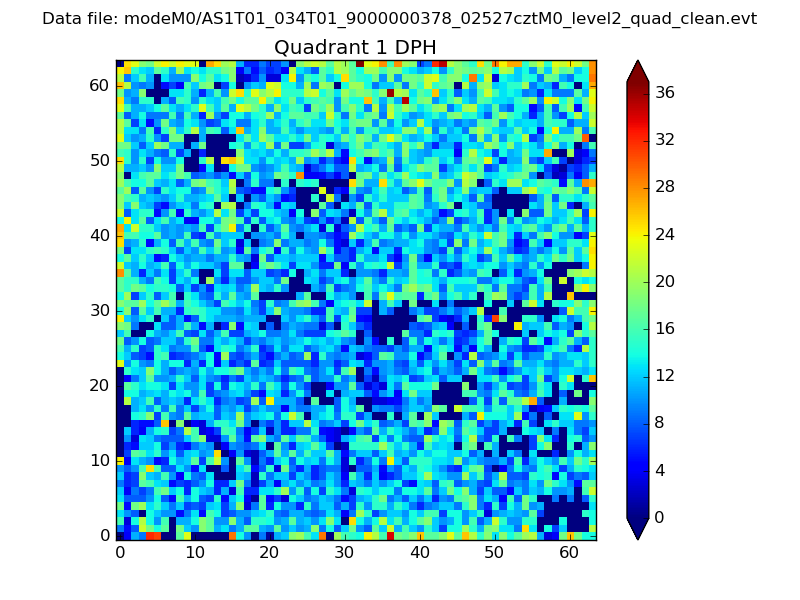 |
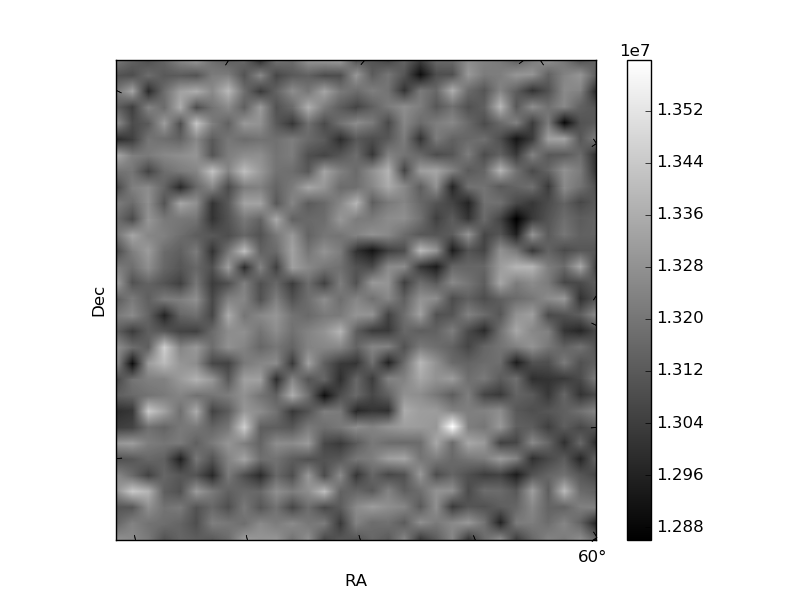
Quadrant B |
|---|---|---|---|
| Quadrant D | 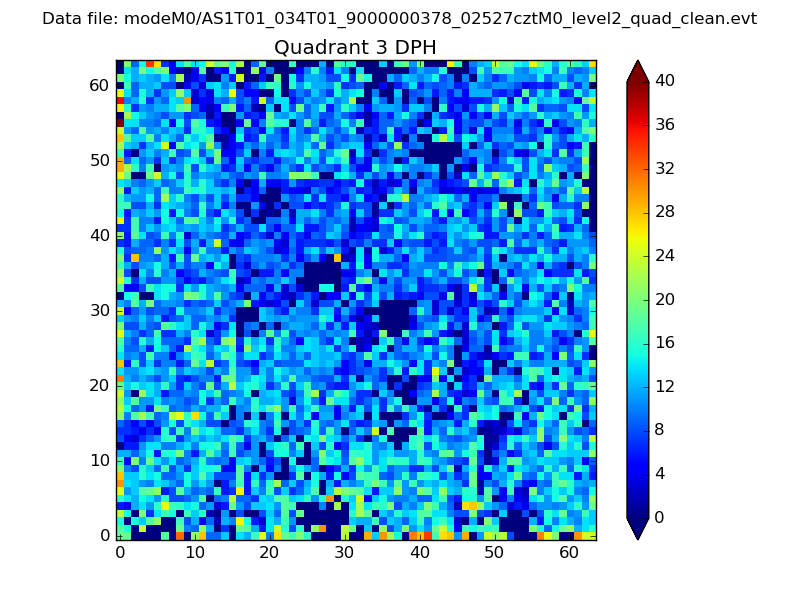 |
 |
Quadrant C |
| Plot type | Count rate plots | Images |
|---|---|---|
| Comparison with Poisson distribution Blue bars denote a histogram of data divided into 1 sec bins. Red curve is a Poisson curve with rate = median count rate of data. |
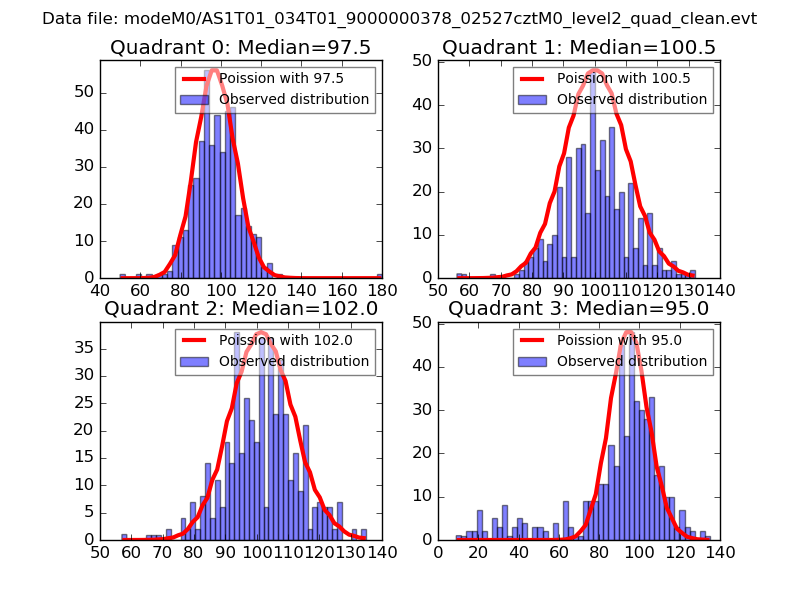 |
 |
| Quadrant-wise count rates Data is divided into 100 sec bins |
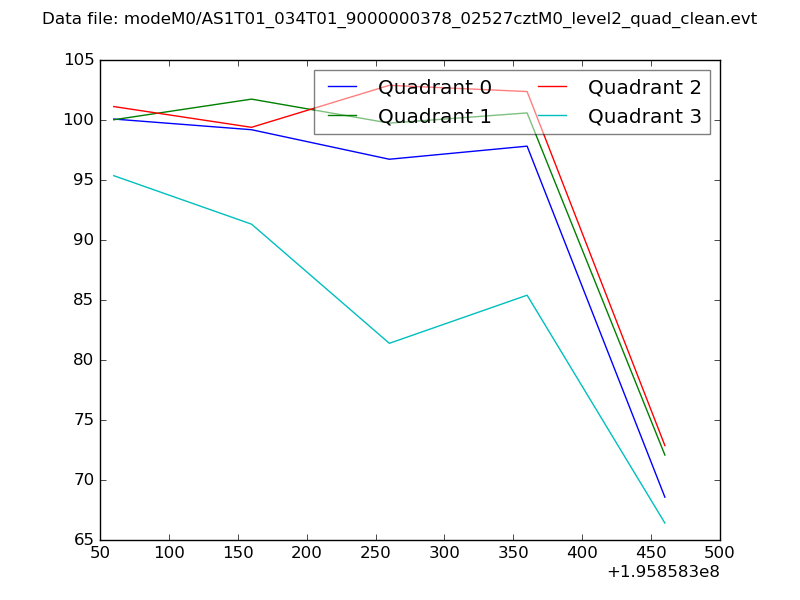 |
|
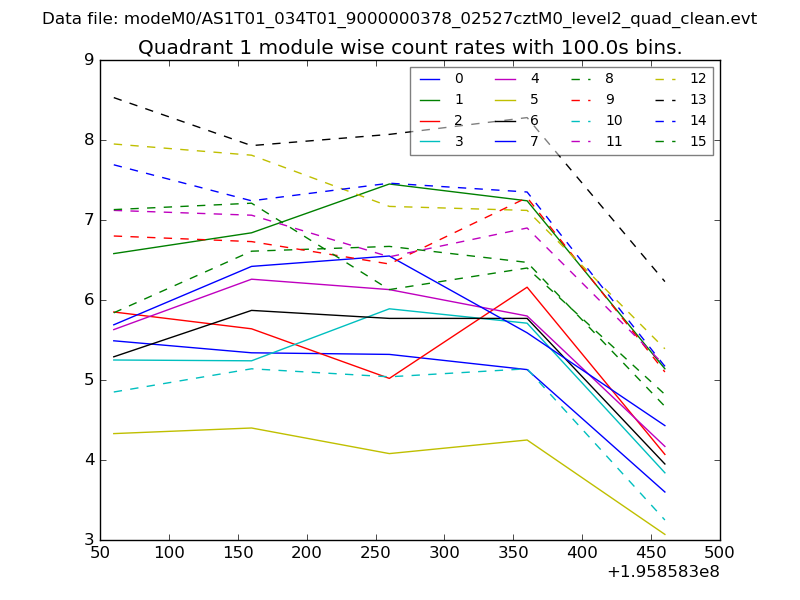
| Module-wise count rates for Quadrant A Data is divided into 100 sec bins |
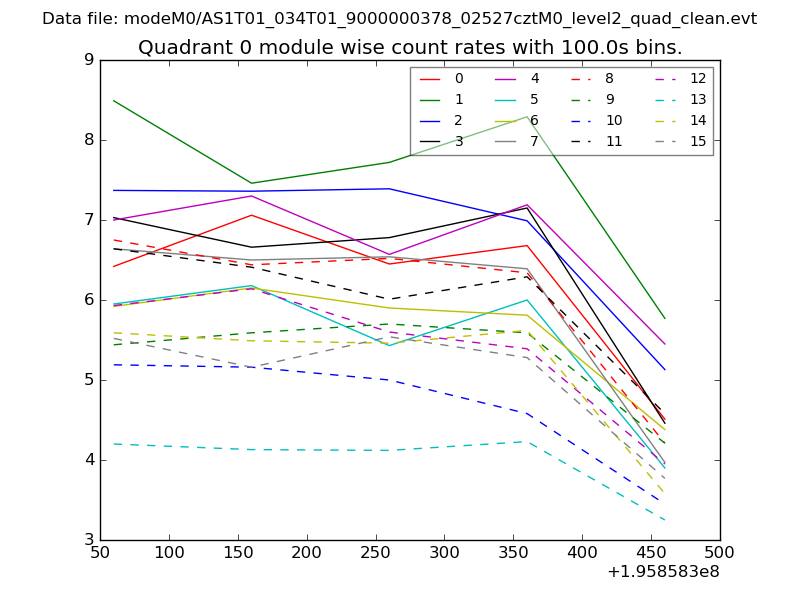 |
 |
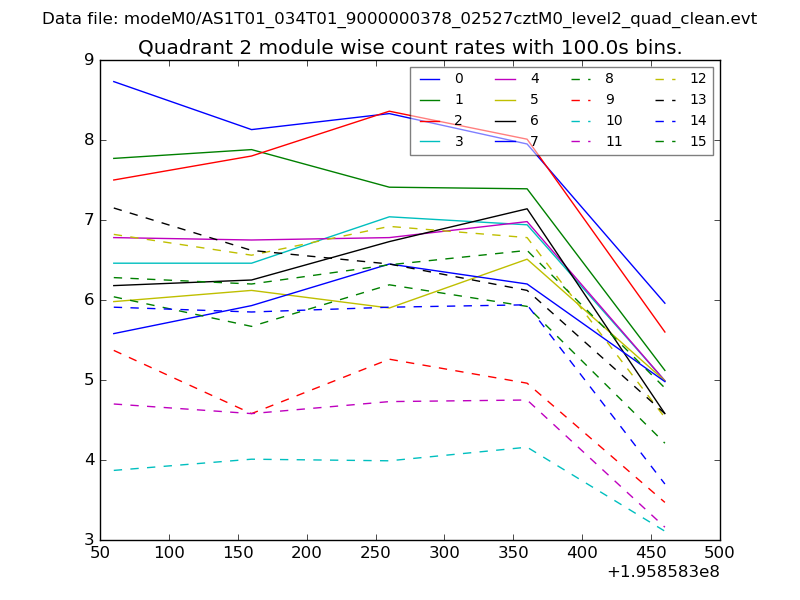
| Module-wise count rates for Quadrant B Data is divided into 100 sec bins |
 |
 |
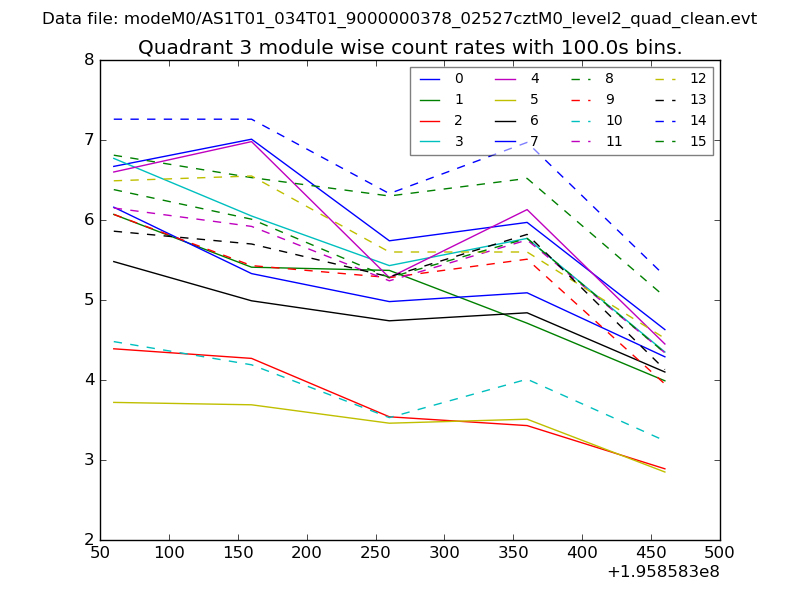
| Module-wise count rates for Quadrant C Data is divided into 100 sec bins |
 |
 |
| Module-wise count rates for Quadrant D Data is divided into 100 sec bins |
 |
 |
| Parameter | Plot |
|---|---|
| CZT HV Monitor | 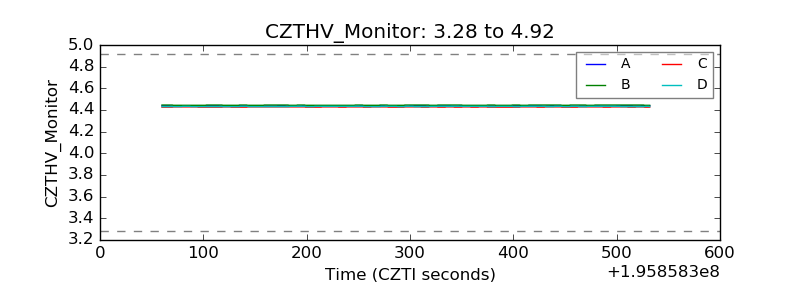 |
| D_VDD |  |
| Temperature 1 | 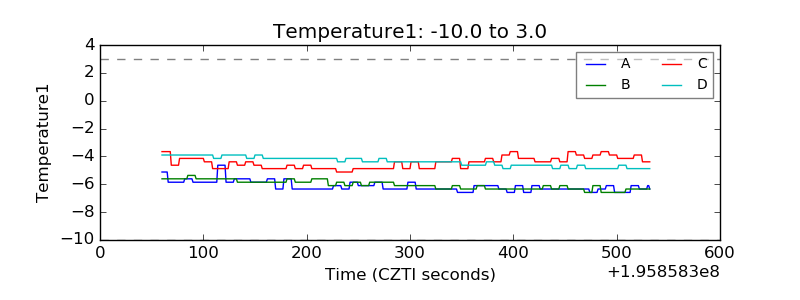 |
| Veto HV Monitor | 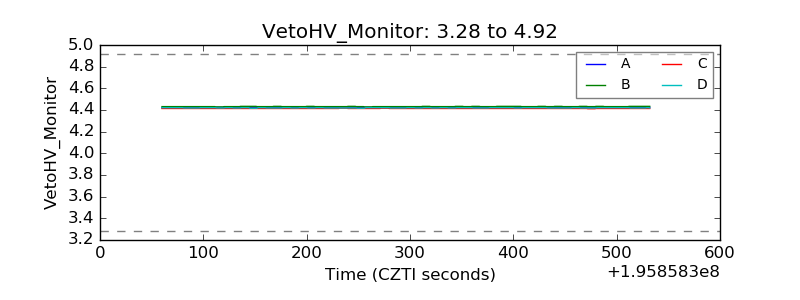 |
| Veto LLD | 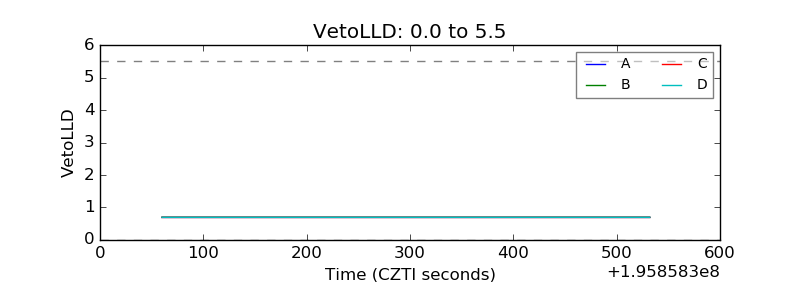 |
| Alpha Counter | 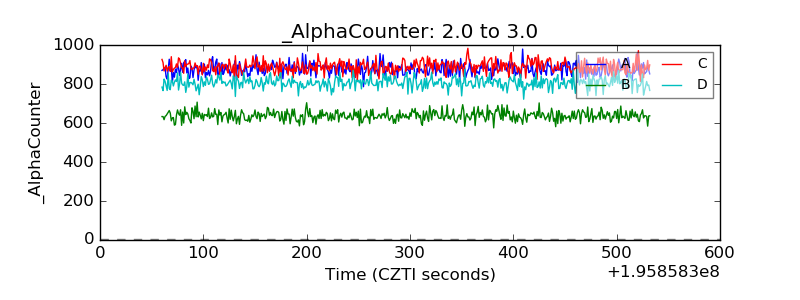 |
| _CPM_Rate | 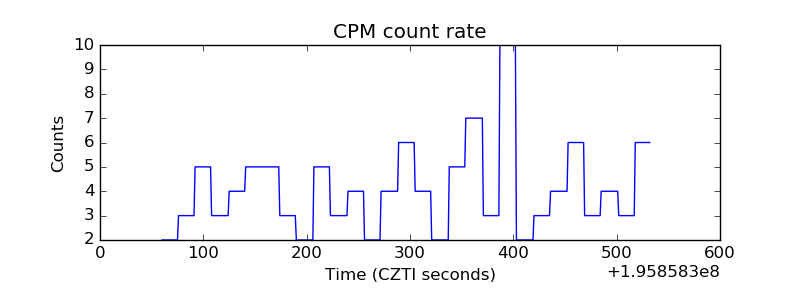 |
| CZT Counter | 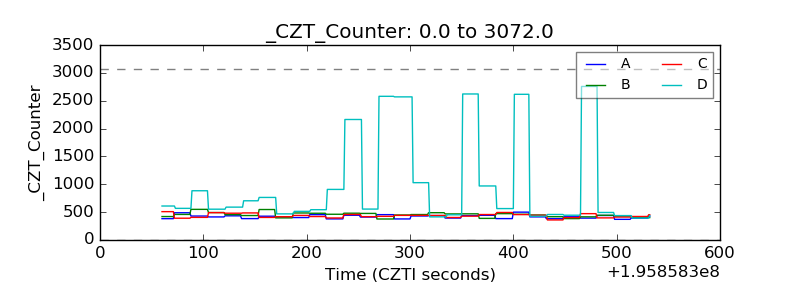 |
| +2.5 Volts monitor |  |
| +5 Volts monitor |  |
| _ROLL_ROT | 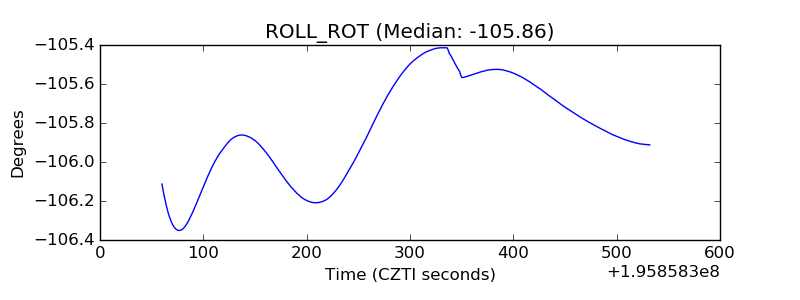 |
| _Roll_DEC | 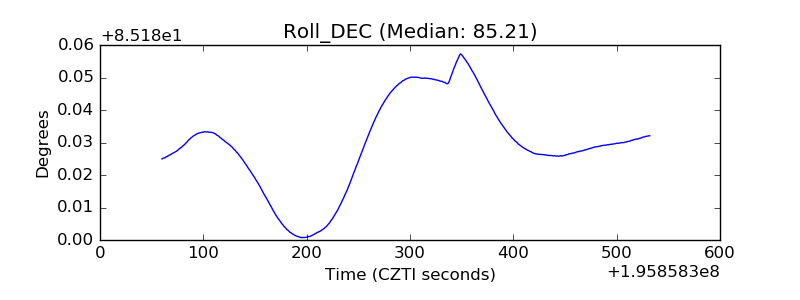 |
| _Roll_RA | 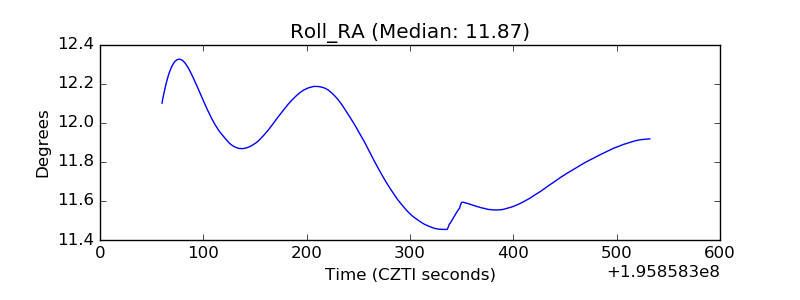 |
| Veto Counter | 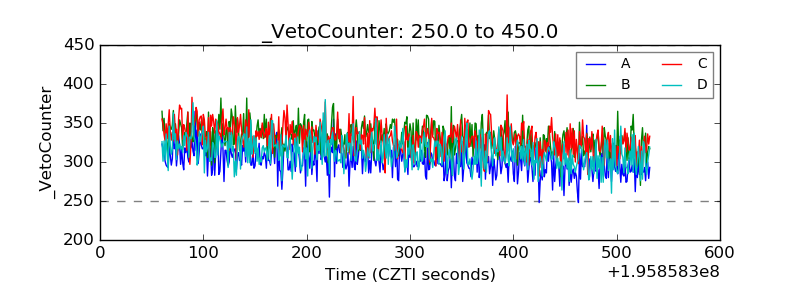 |