| Param | Original file | Final file |
|---|---|---|
| Filename | modeM0/AS1T01_034T01_9000000378_02530cztM0_level2.evt | modeM0/AS1T01_034T01_9000000378_02530cztM0_level2_quad_clean.evt |
| Size (bytes) | 920,957,760 | 170,239,680 |
| Size | 878.3 MB | 162.4 MB |
| Events in quadrant A | 4,648,674 | 1,117,200 |
| Events in quadrant B | 4,792,594 | 1,142,626 |
| Events in quadrant C | 4,844,942 | 1,168,749 |
| Events in quadrant D | 12,846,558 | 951,150 |
| Mode M0 | |||
|---|---|---|---|
| Quadrant | BADHDUFLAG | Total packets | Discarded packets |
| A | 0 | 22641 | 3 |
| B | 0 | 22746 | 2 |
| C | 0 | 22998 | 2 |
| D | 0 | 46216 | 2 |
| Mode M9 | |||
|---|---|---|---|
| Quadrant | BADHDUFLAG | Total packets | Discarded packets |
| A | 0 | 20 | 0 |
| B | 0 | 20 | 0 |
| C | 0 | 20 | 0 |
| D | 0 | 20 | 0 |
| Mode SS | |||
|---|---|---|---|
| Quadrant | BADHDUFLAG | Total packets | Discarded packets |
| A | 0 | 228 | 0 |
| B | 0 | 228 | 0 |
| C | 0 | 228 | 0 |
| D | 0 | 228 | 0 |
| Quadrant | Total seconds | Saturated seconds | Saturation percentage |
|---|---|---|---|
| A | 11205 | 37 | 0.330210% |
| B | 11205 | 43 | 0.383757% |
| C | 11205 | 41 | 0.365908% |
| D | 11205 | 2748 | 24.524766% |
Noise dominated data is calculated using 1-second bins in cleaned event files. If a bin has >2000 counts, and if more than 50% of those come from <1% of pixels, then it is considered to be noise-dominated and hence unusable.
| Quadrant | # 1 sec bins | Bins with >0 counts | Bins with >2000 counts | High rate bins dominated by noise | Noise dominated (total time) | Noise dominated (detector-on time) | Marked lightcurve |
|---|---|---|---|---|---|---|---|
| A | 13220 | 11207 | 1 | 1 | 0.01% | 0.01% | 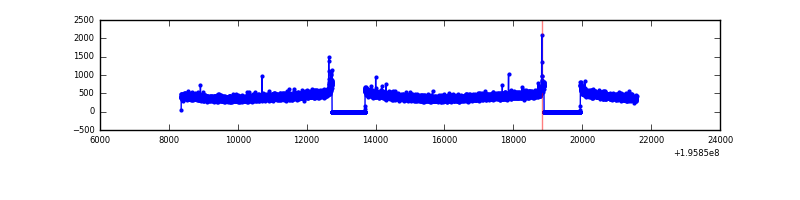 |
| B | 13220 | 11207 | 2 | 2 | 0.02% | 0.02% | 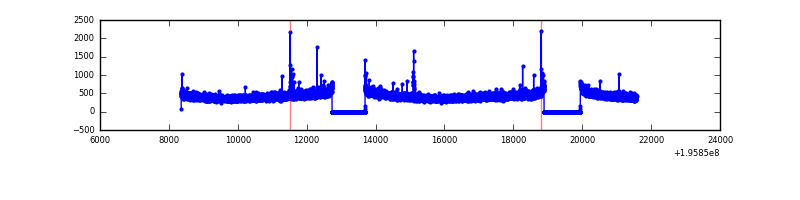 |
| C | 13220 | 11207 | 1 | 1 | 0.01% | 0.01% | 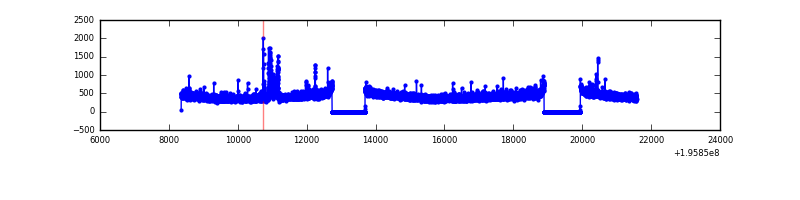 |
| D | 13220 | 11207 | 2372 | 2372 | 17.94% | 21.17% | 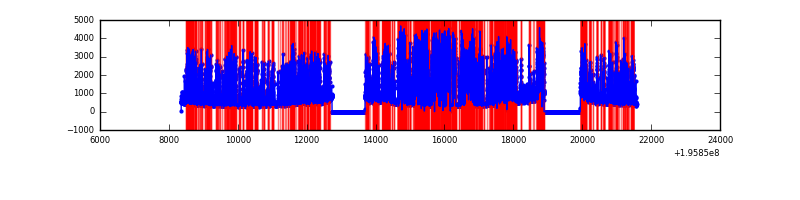 |
Top three noisy pixels from each quadrant. If the there are fewer than three noisy pixels in the level2.evt file, extra rows are filled as -1
| Pixel properties | Quadrant properties | ||||||
|---|---|---|---|---|---|---|---|
| Quadrant | DetID | PixID | Counts | Sigma | Mean | Median | Sigma |
| A | 12 | 194 | 13293 | 49.65 | 1203 | 1177 | 244.0 |
| A | 0 | 226 | 12754 | 47.44 | 1203 | 1177 | 244.0 |
| A | 14 | 235 | 10975 | 40.15 | 1203 | 1177 | 244.0 |
| B | 10 | 244 | 24887 | 102.3 | 1228 | 1195 | 231.6 |
| B | 12 | 111 | 17671 | 71.14 | 1228 | 1195 | 231.6 |
| B | 11 | 111 | 15053 | 59.84 | 1228 | 1195 | 231.6 |
| C | 14 | 223 | 106224 | 382.92 | 1191 | 1198 | 274.3 |
| C | 7 | 220 | 29267 | 102.34 | 1191 | 1198 | 274.3 |
| C | 0 | 64 | 25015 | 86.84 | 1191 | 1198 | 274.3 |
| D | 11 | 130 | 7350079 | 30937.43 | 1016 | 993 | 237.5 |
| D | 2 | 136 | 647115 | 2719.98 | 1016 | 993 | 237.5 |
| D | 11 | 131 | 567217 | 2383.63 | 1016 | 993 | 237.5 |
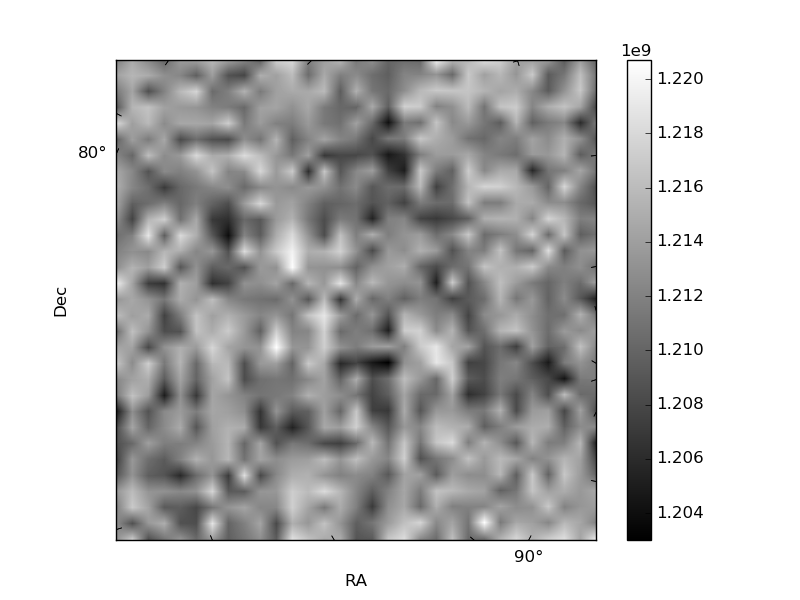
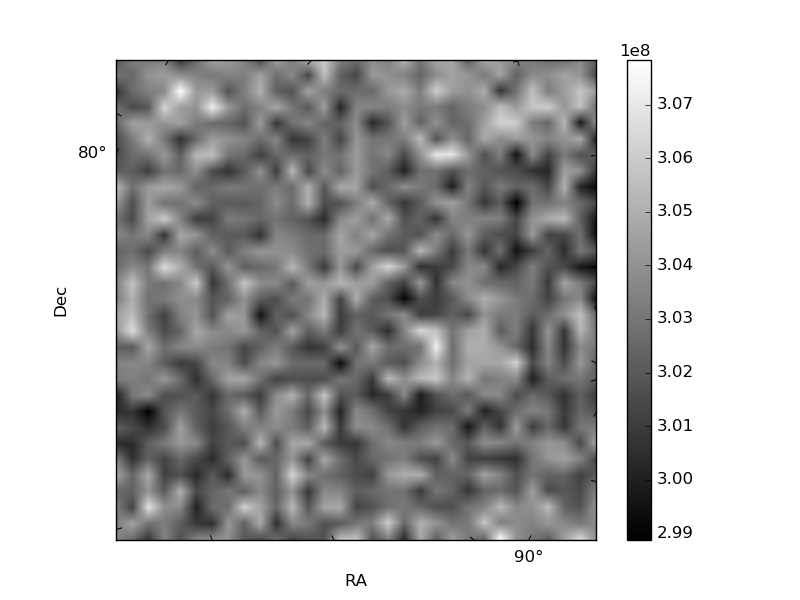
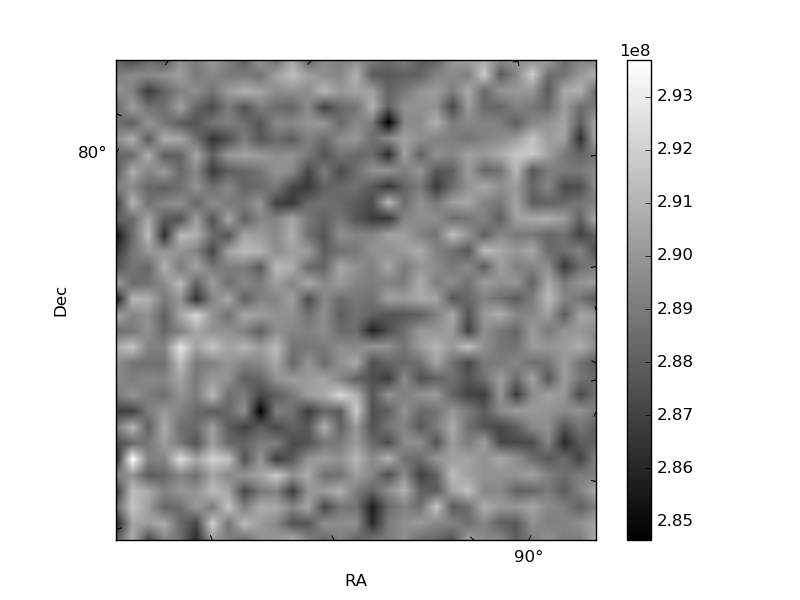
Histogram calculated using DETX and DETY for each event in the final _common_clean file
| Quadrant A | 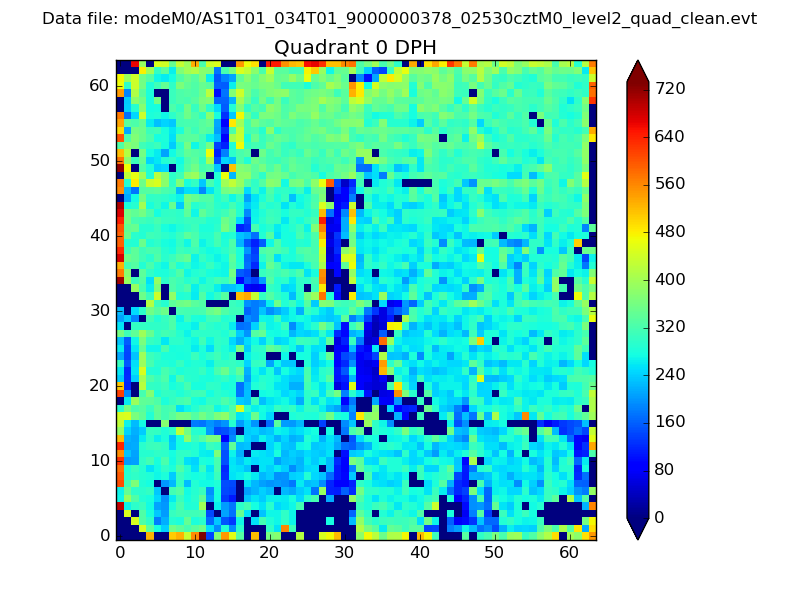 |
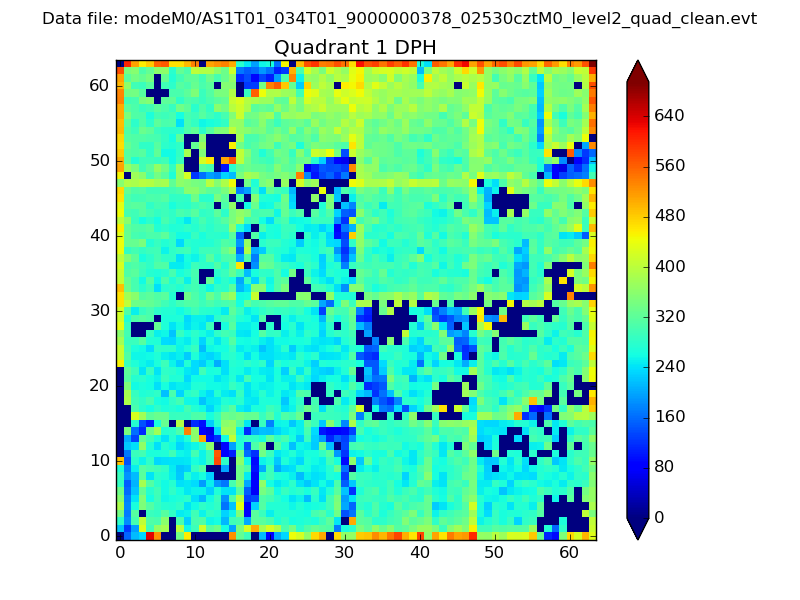 |
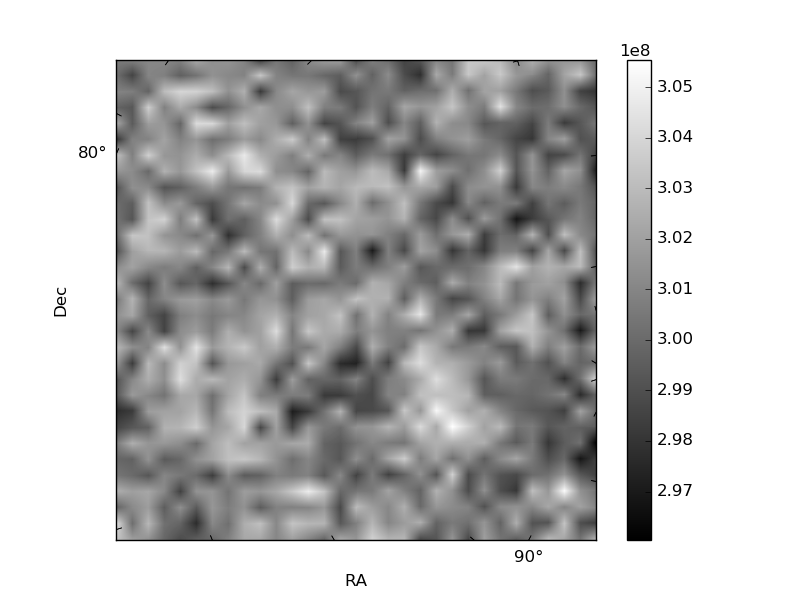
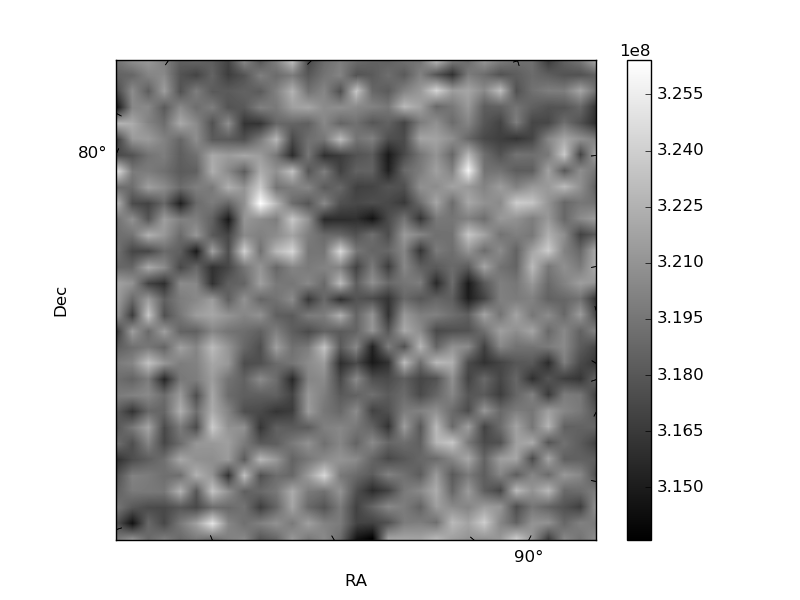
Quadrant B |
|---|---|---|---|
| Quadrant D | 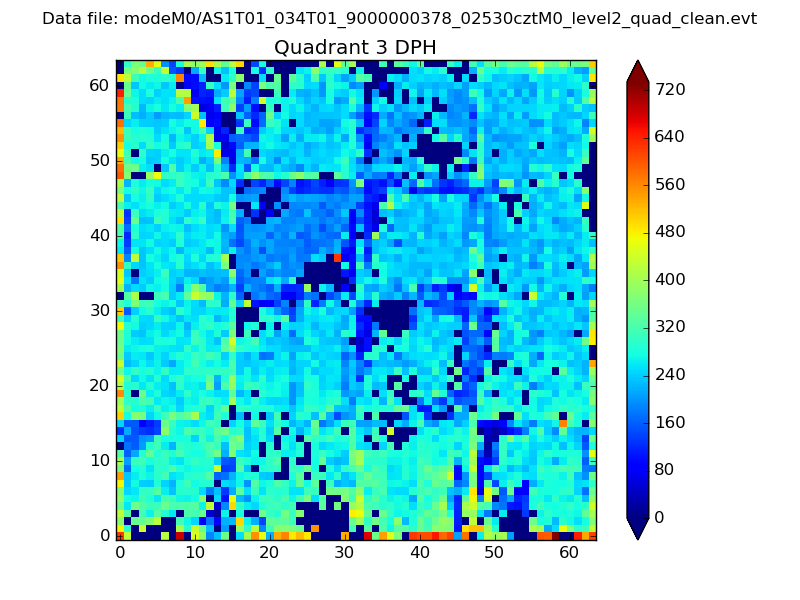 |
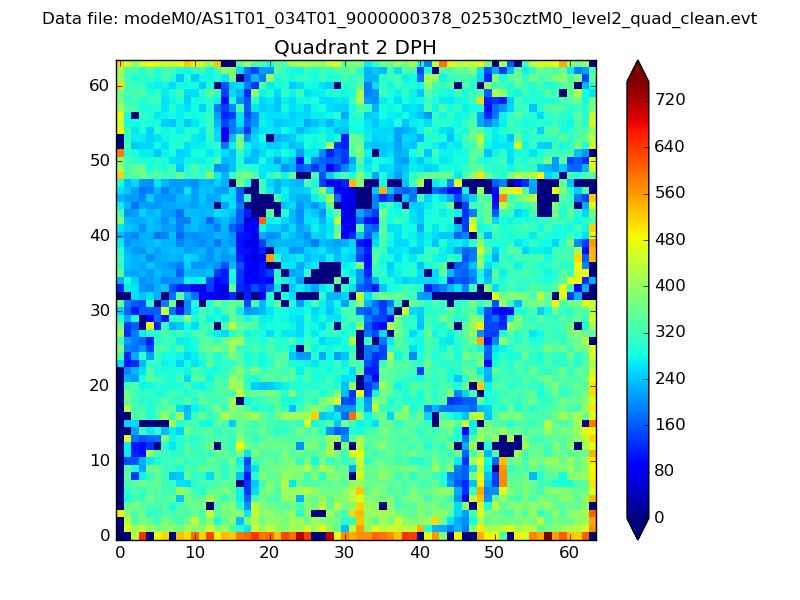 |
Quadrant C |
| Plot type | Count rate plots | Images |
|---|---|---|
| Comparison with Poisson distribution Blue bars denote a histogram of data divided into 1 sec bins. Red curve is a Poisson curve with rate = median count rate of data. |
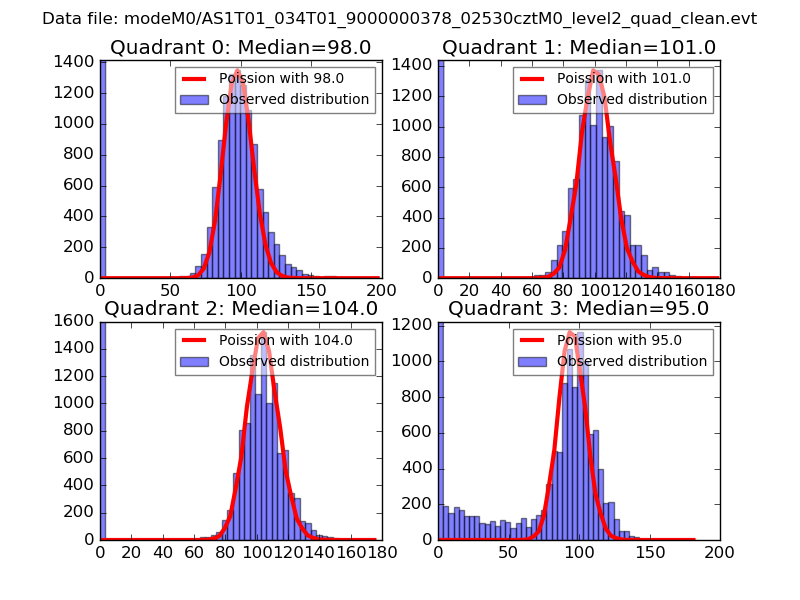 |
 |
| Quadrant-wise count rates Data is divided into 100 sec bins |
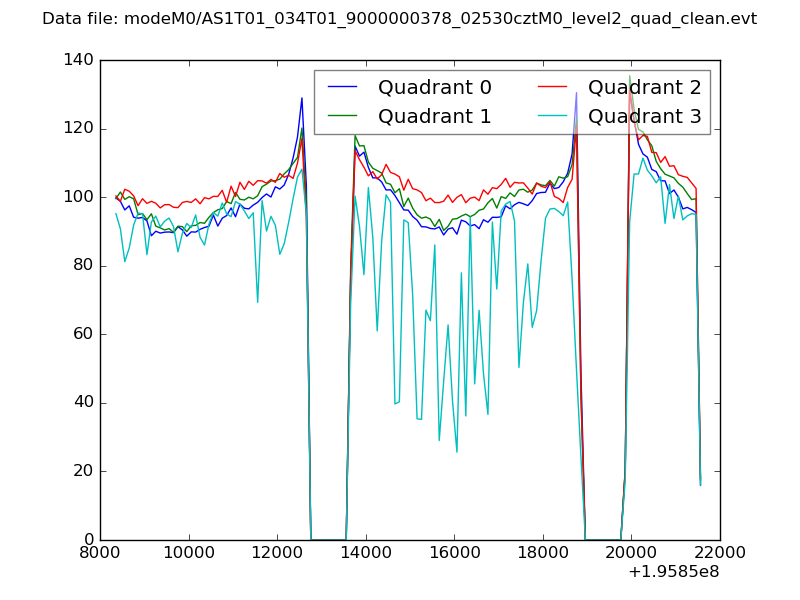 |
|
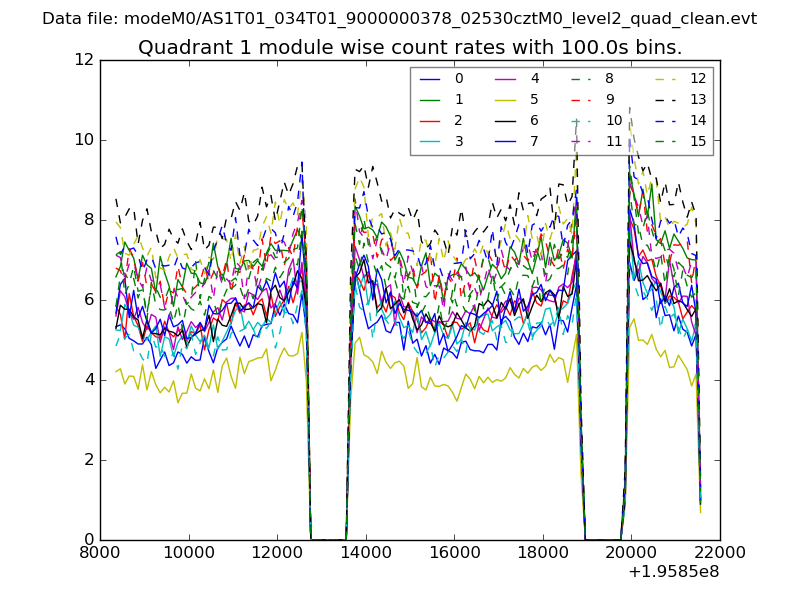
| Module-wise count rates for Quadrant A Data is divided into 100 sec bins |
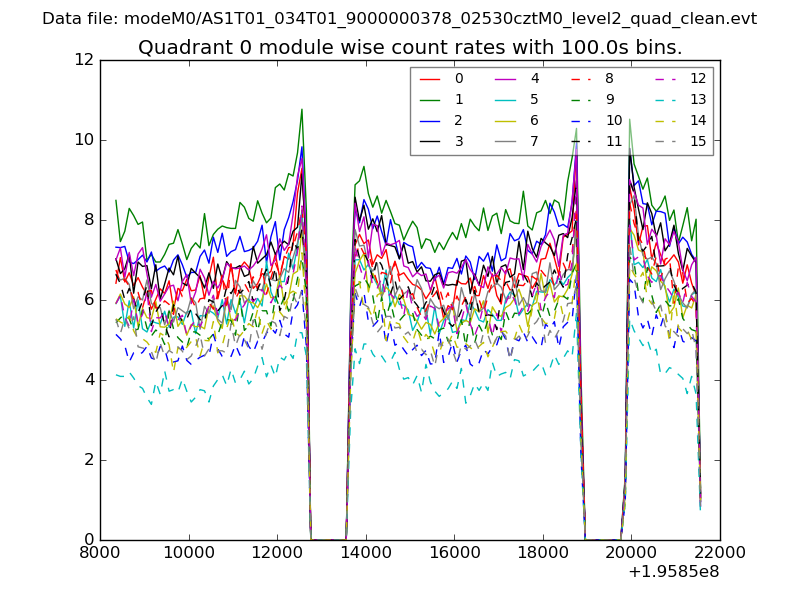 |
 |
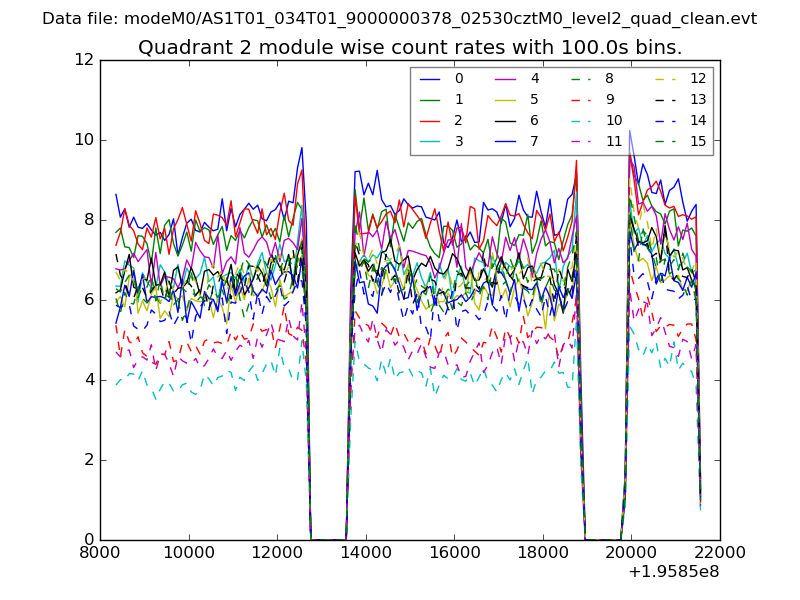
| Module-wise count rates for Quadrant B Data is divided into 100 sec bins |
 |
 |
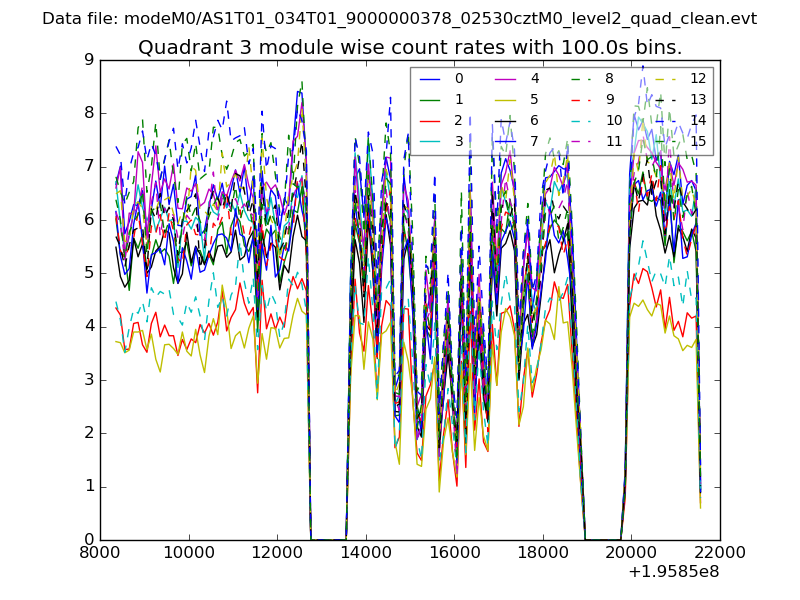
| Module-wise count rates for Quadrant C Data is divided into 100 sec bins |
 |
 |
| Module-wise count rates for Quadrant D Data is divided into 100 sec bins |
 |
 |
| Parameter | Plot |
|---|---|
| CZT HV Monitor | 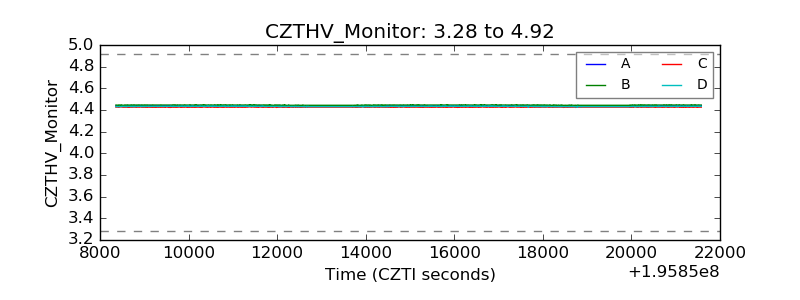 |
| D_VDD | 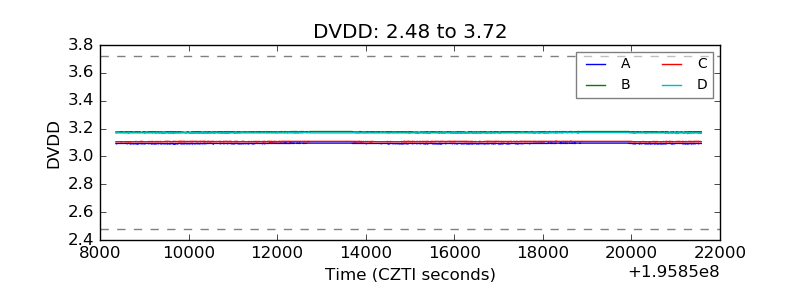 |
| Temperature 1 | 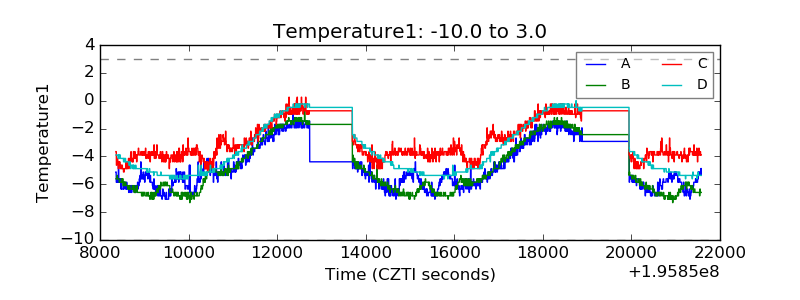 |
| Veto HV Monitor | 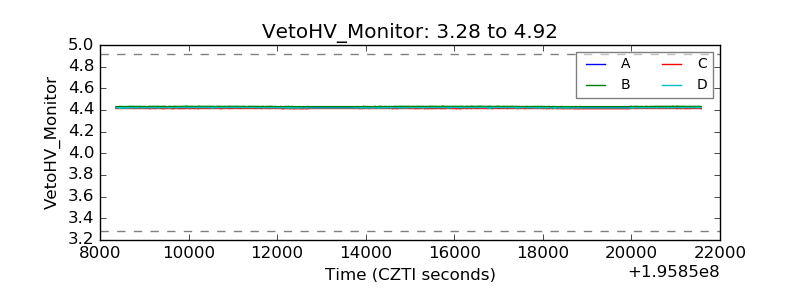 |
| Veto LLD | 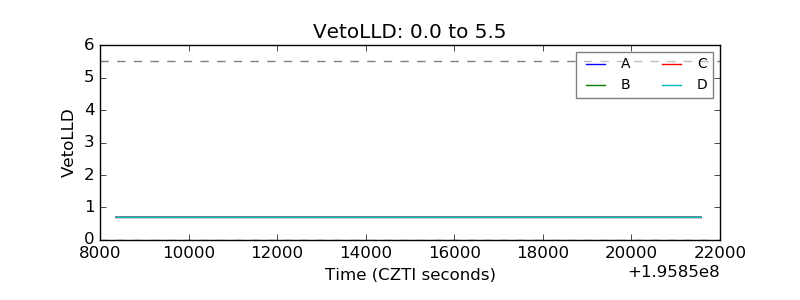 |
| Alpha Counter | 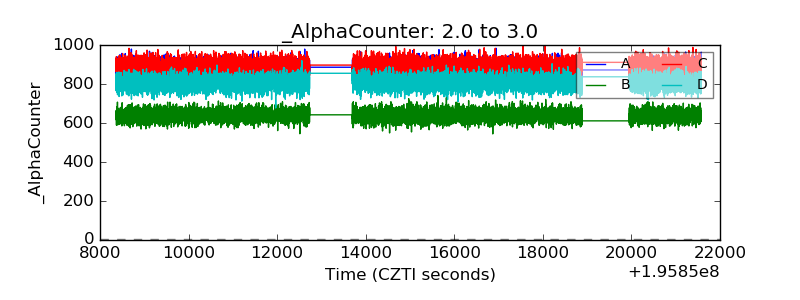 |
| _CPM_Rate | 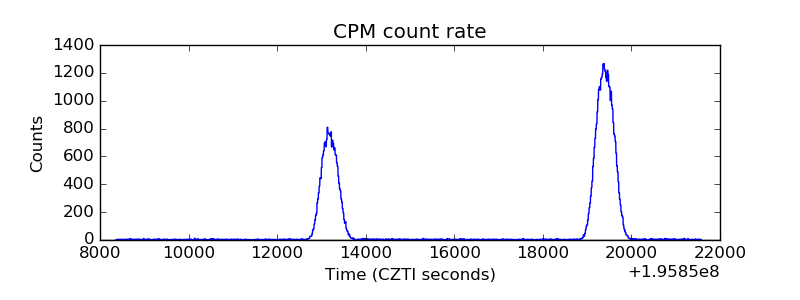 |
| CZT Counter | 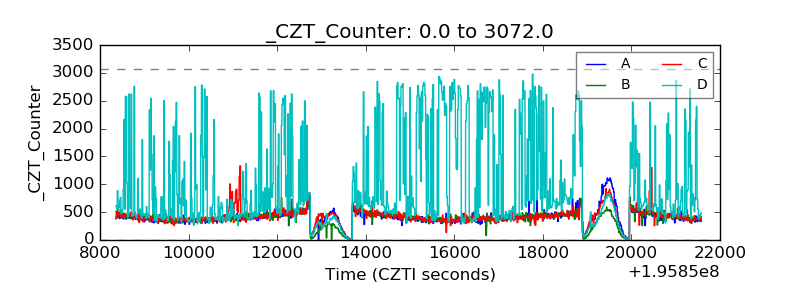 |
| +2.5 Volts monitor |  |
| +5 Volts monitor |  |
| Veto Counter | 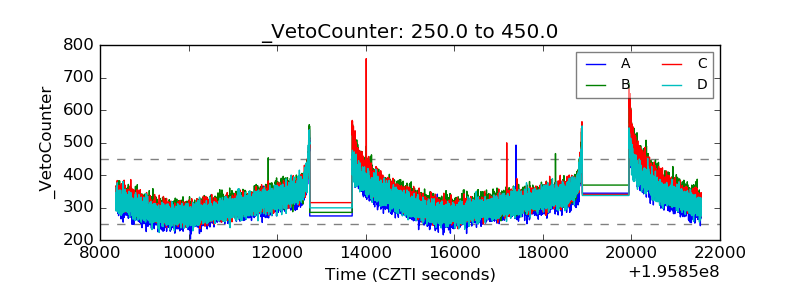 |