| Param | Original file | Final file |
|---|---|---|
| Filename | modeM0/AS1T01_034T01_9000000378_02537cztM0_level2.evt | modeM0/AS1T01_034T01_9000000378_02537cztM0_level2_quad_clean.evt |
| Size (bytes) | 267,016,320 | 56,514,240 |
| Size | 254.6 MB | 53.9 MB |
| Events in quadrant A | 1,557,267 | 364,324 |
| Events in quadrant B | 1,620,630 | 369,170 |
| Events in quadrant C | 1,591,562 | 366,053 |
| Events in quadrant D | 3,056,674 | 342,245 |
| Mode M0 | |||
|---|---|---|---|
| Quadrant | BADHDUFLAG | Total packets | Discarded packets |
| A | 0 | 7673 | 0 |
| B | 0 | 7740 | 0 |
| C | 0 | 7739 | 0 |
| D | 0 | 11883 | 0 |
| Mode SS | |||
|---|---|---|---|
| Quadrant | BADHDUFLAG | Total packets | Discarded packets |
| A | 0 | 76 | 0 |
| B | 0 | 76 | 0 |
| C | 0 | 76 | 0 |
| D | 0 | 76 | 0 |
| Quadrant | Total seconds | Saturated seconds | Saturation percentage |
|---|---|---|---|
| A | 3812 | 3 | 0.078699% |
| B | 3812 | 5 | 0.131165% |
| C | 3812 | 5 | 0.131165% |
| D | 3812 | 122 | 3.200420% |
Noise dominated data is calculated using 1-second bins in cleaned event files. If a bin has >2000 counts, and if more than 50% of those come from <1% of pixels, then it is considered to be noise-dominated and hence unusable.
| Quadrant | # 1 sec bins | Bins with >0 counts | Bins with >2000 counts | High rate bins dominated by noise | Noise dominated (total time) | Noise dominated (detector-on time) | Marked lightcurve |
|---|---|---|---|---|---|---|---|
| A | 3812 | 3812 | 1 | 1 | 0.03% | 0.03% | 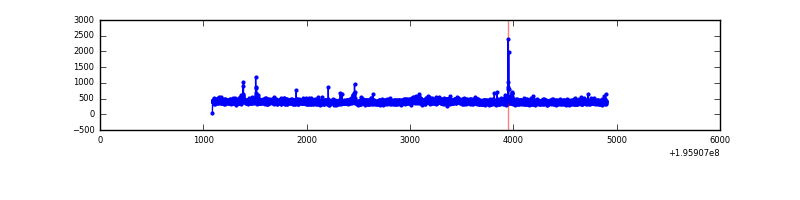 |
| B | 3812 | 3812 | 1 | 1 | 0.03% | 0.03% | 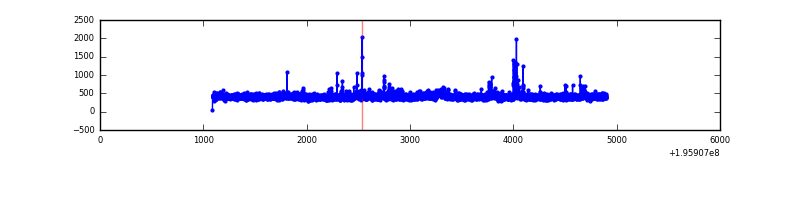 |
| C | 3812 | 3812 | 7 | 7 | 0.18% | 0.18% | 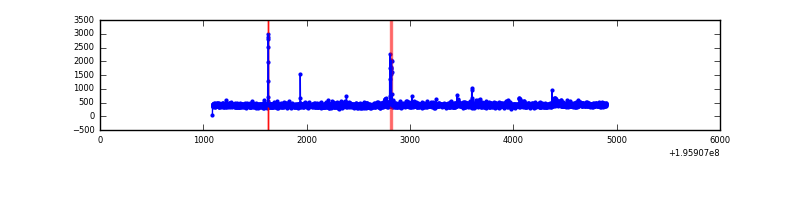 |
| D | 3812 | 3812 | 106 | 106 | 2.78% | 2.78% | 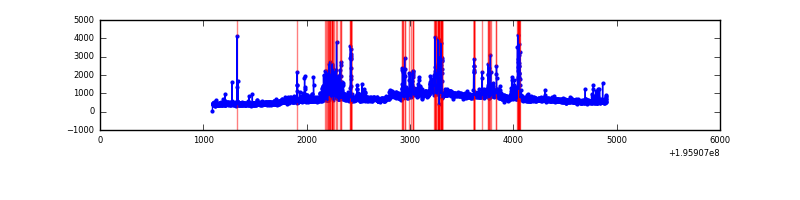 |
Top three noisy pixels from each quadrant. If the there are fewer than three noisy pixels in the level2.evt file, extra rows are filled as -1
| Pixel properties | Quadrant properties | ||||||
|---|---|---|---|---|---|---|---|
| Quadrant | DetID | PixID | Counts | Sigma | Mean | Median | Sigma |
| A | 8 | 15 | 16751 | 200.13 | 392 | 383 | 81.8 |
| A | 14 | 238 | 14293 | 170.08 | 392 | 383 | 81.8 |
| A | 12 | 133 | 14201 | 168.95 | 392 | 383 | 81.8 |
| B | 5 | 172 | 32462 | 420.01 | 396 | 385 | 76.4 |
| B | 10 | 244 | 24945 | 321.58 | 396 | 385 | 76.4 |
| B | 15 | 85 | 19675 | 252.58 | 396 | 385 | 76.4 |
| C | 9 | 144 | 58066 | 638.87 | 384 | 385 | 90.3 |
| C | 0 | 64 | 8605 | 91.04 | 384 | 385 | 90.3 |
| C | 12 | 4 | 7762 | 81.71 | 384 | 385 | 90.3 |
| D | 11 | 131 | 1137072 | 12679.08 | 373 | 362 | 89.7 |
| D | 11 | 130 | 207955 | 2315.53 | 373 | 362 | 89.7 |
| D | 5 | 172 | 83277 | 924.85 | 373 | 362 | 89.7 |
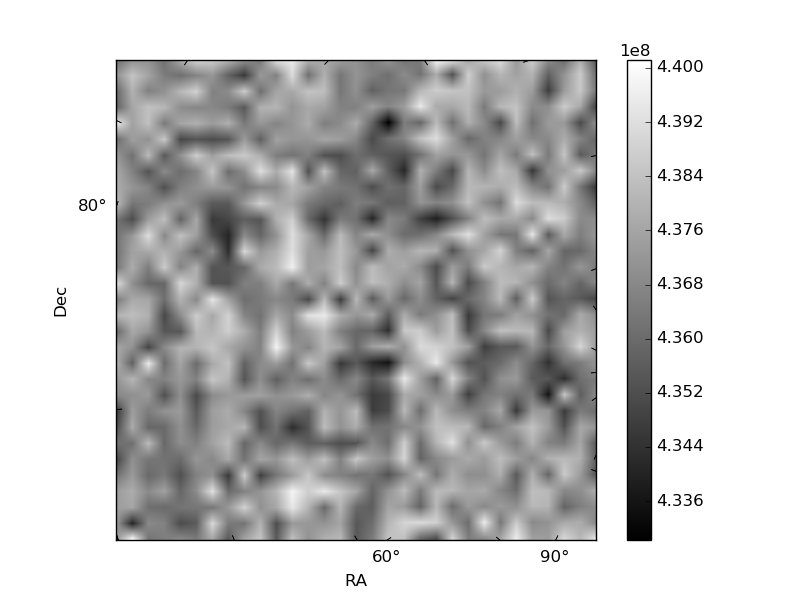
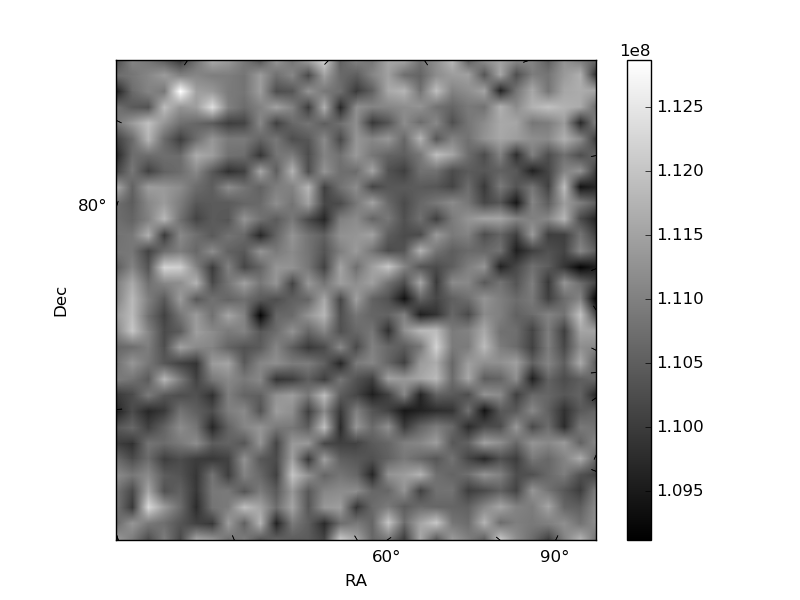
Histogram calculated using DETX and DETY for each event in the final _common_clean file
| Quadrant A |  |
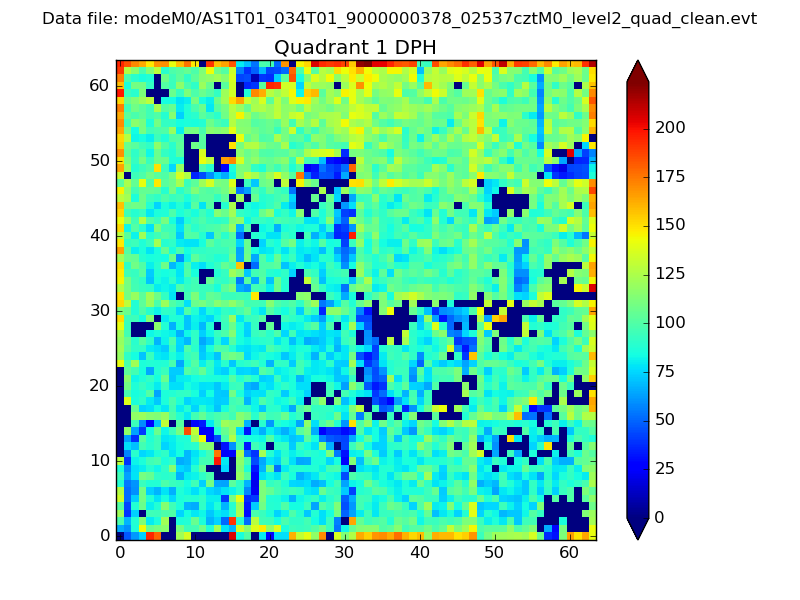 |
Quadrant B |
|---|---|---|---|
| Quadrant D | 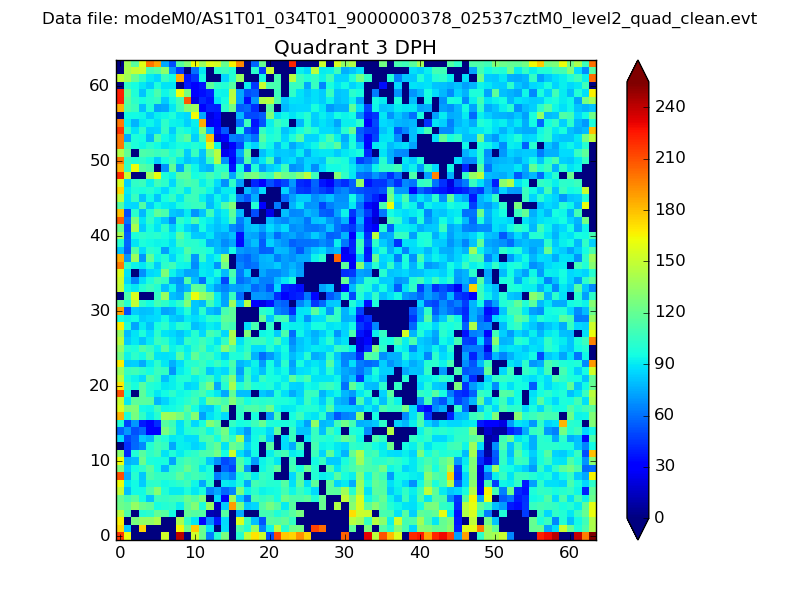 |
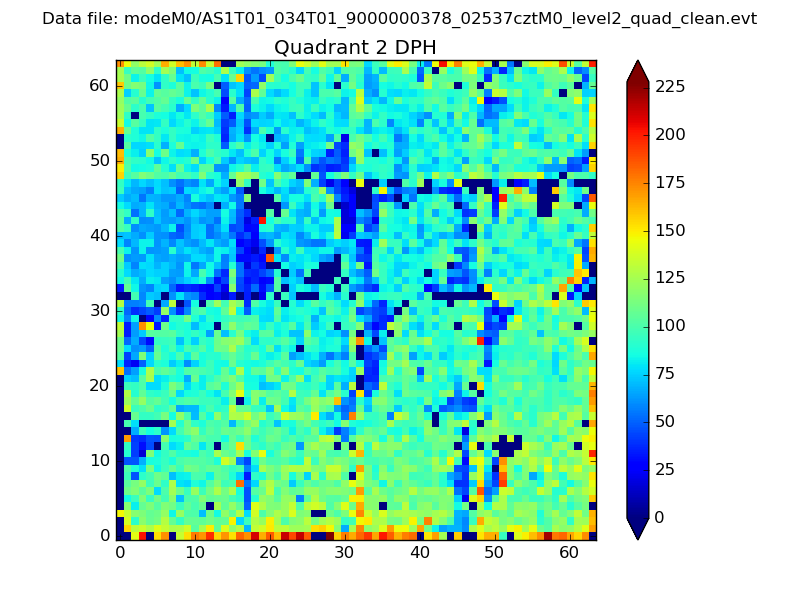 |
Quadrant C |
| Plot type | Count rate plots | Images |
|---|---|---|
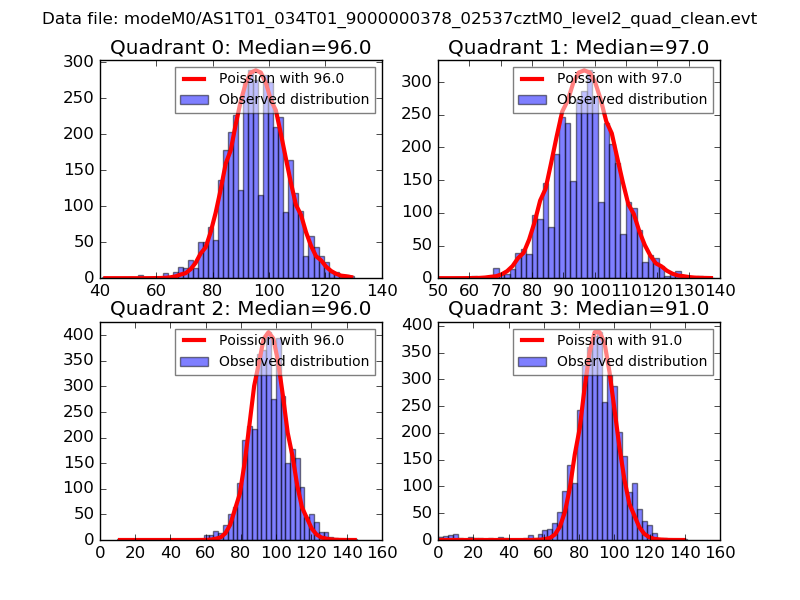
| Comparison with Poisson distribution Blue bars denote a histogram of data divided into 1 sec bins. Red curve is a Poisson curve with rate = median count rate of data. |
 |
 |
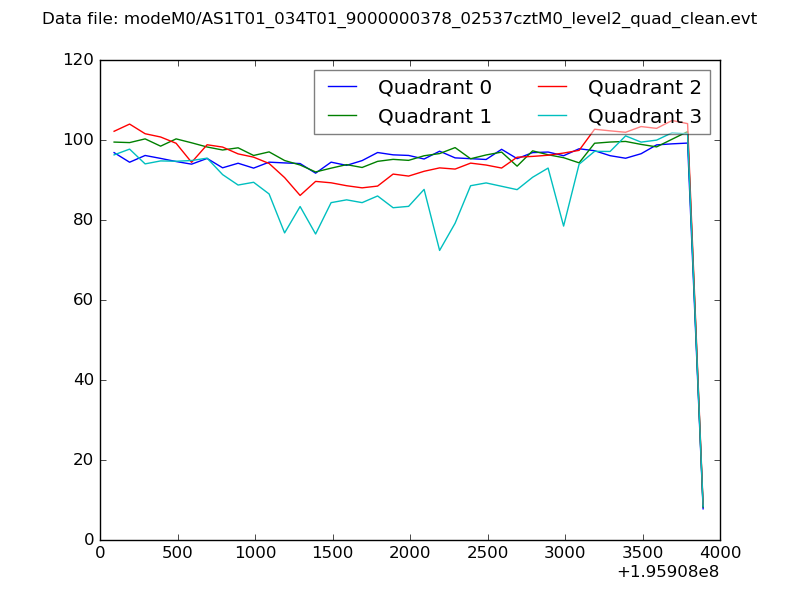
| Quadrant-wise count rates Data is divided into 100 sec bins |
 |
|
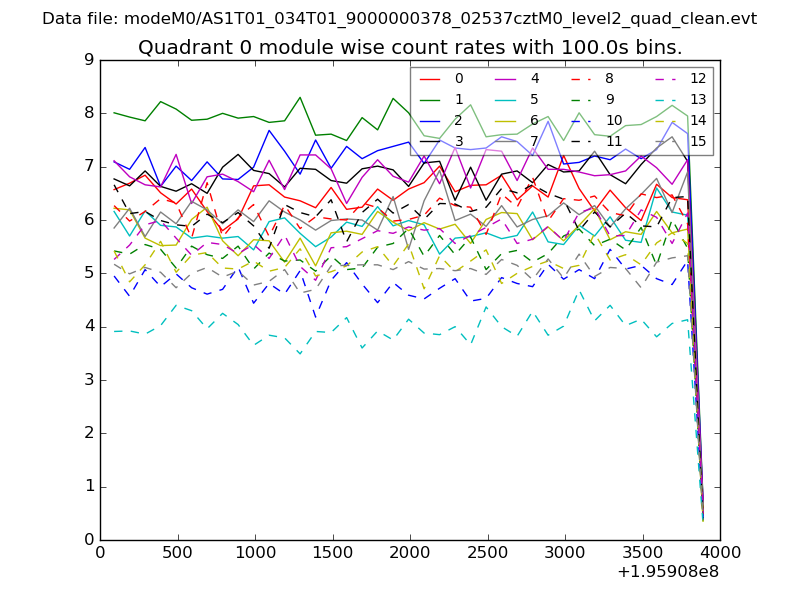
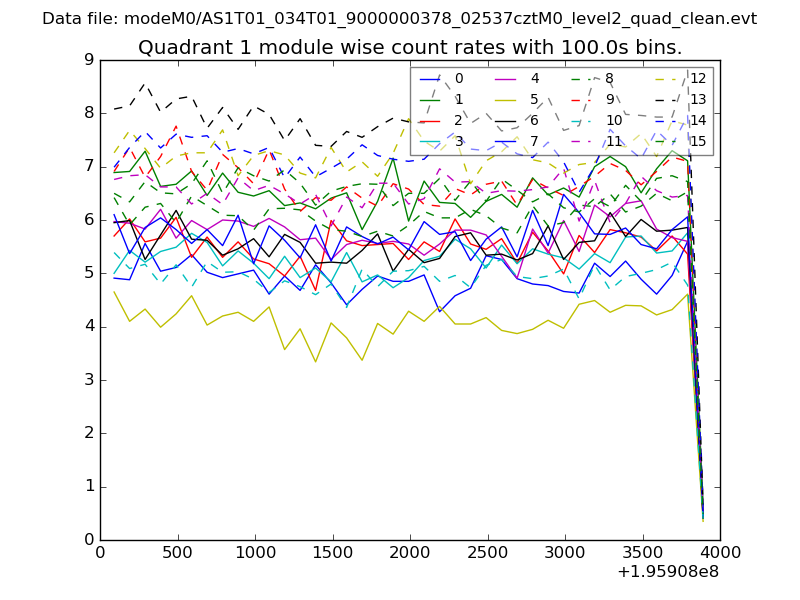
| Module-wise count rates for Quadrant A Data is divided into 100 sec bins |
 |
 |
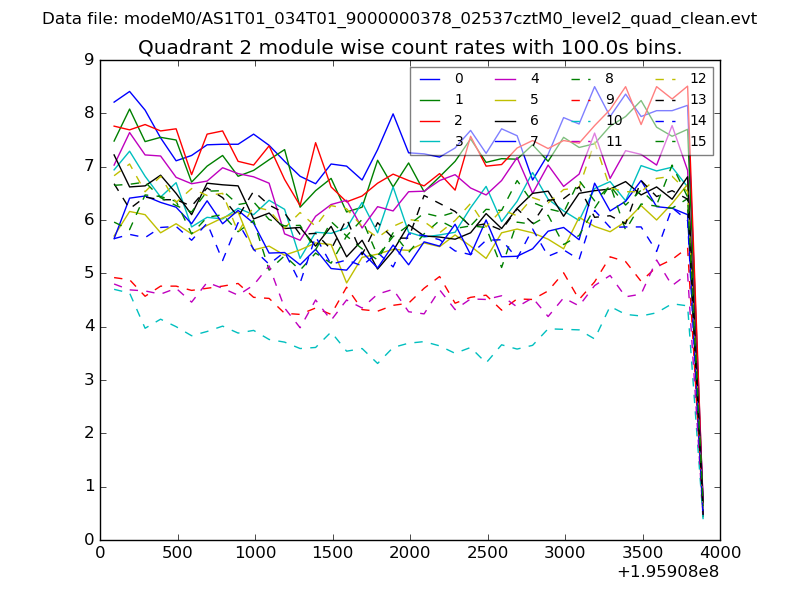
| Module-wise count rates for Quadrant B Data is divided into 100 sec bins |
 |
 |
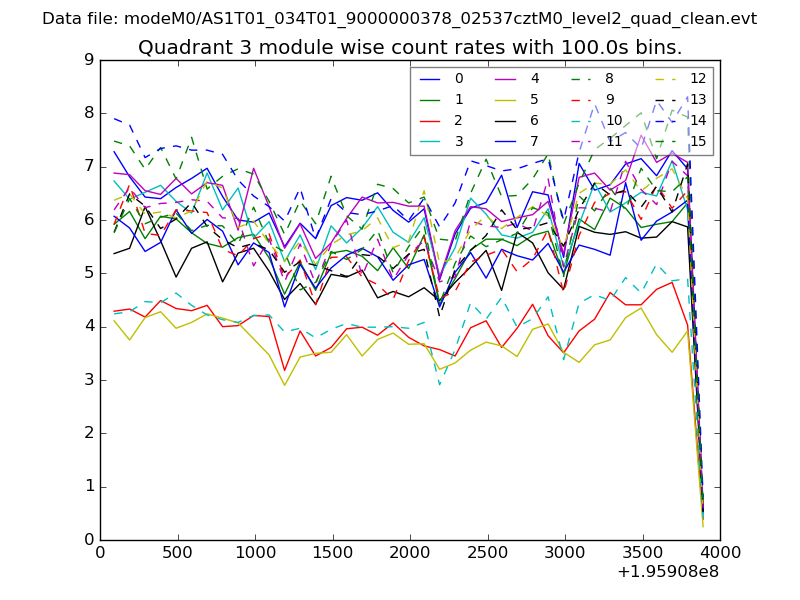
| Module-wise count rates for Quadrant C Data is divided into 100 sec bins |
 |
 |
| Module-wise count rates for Quadrant D Data is divided into 100 sec bins |
 |
 |
| Parameter | Plot |
|---|---|
| CZT HV Monitor |  |
| D_VDD | 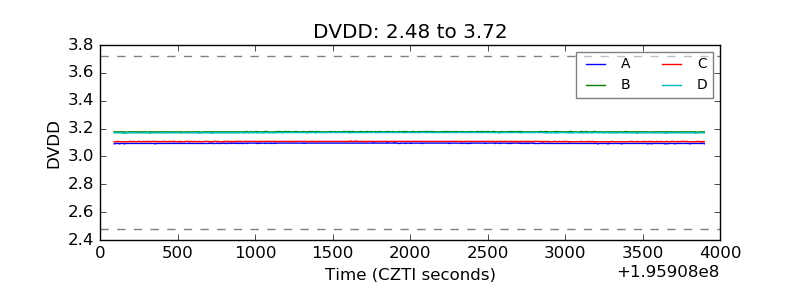 |
| Temperature 1 | 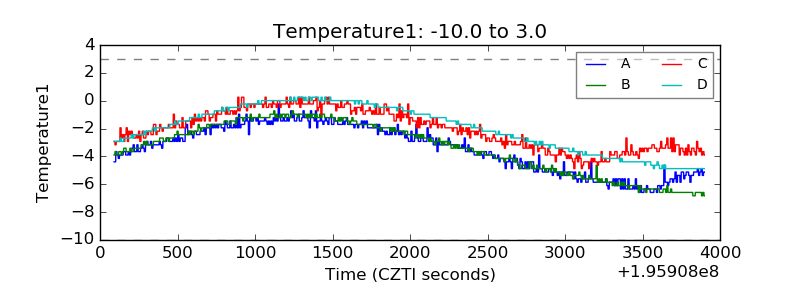 |
| Veto HV Monitor | 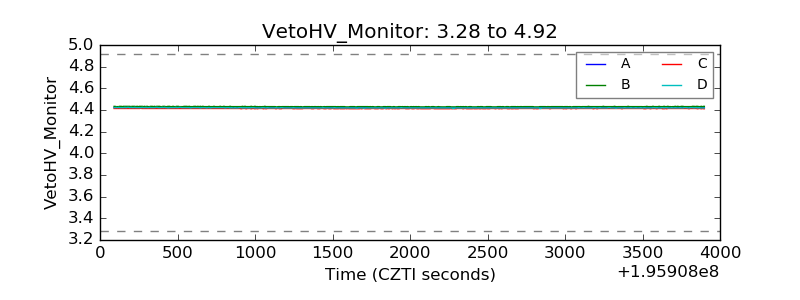 |
| Veto LLD | 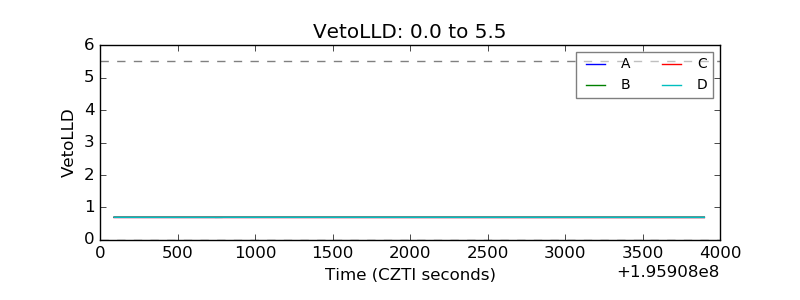 |
| Alpha Counter | 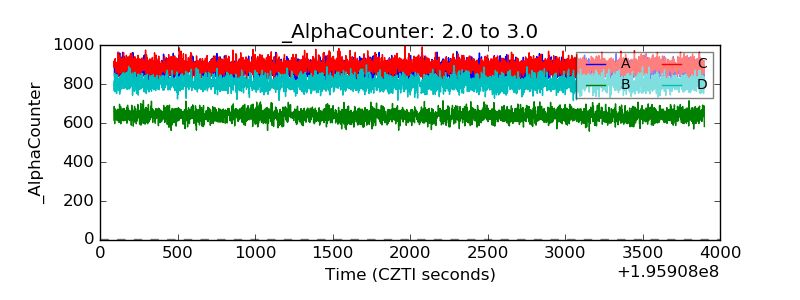 |
| _CPM_Rate | 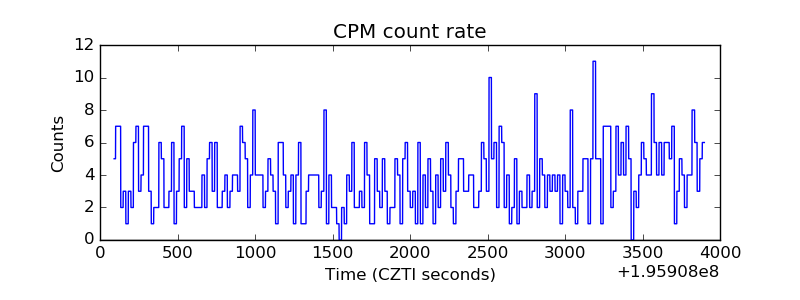 |
| CZT Counter |  |
| +2.5 Volts monitor |  |
| +5 Volts monitor | 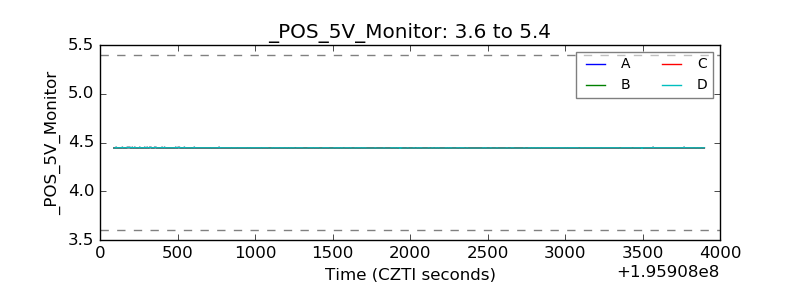 |
| Veto Counter | 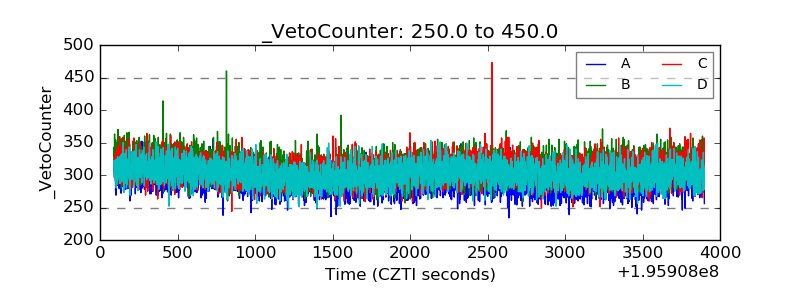 |