| Param | Original file | Final file |
|---|---|---|
| Filename | modeM0/AS1T01_051T01_9000000376cztM0_level2.fits | modeM0/AS1T01_051T01_9000000376cztM0_level2_quad_clean.evt |
| Size (bytes) | 51,523,200 | 32,751,360 |
| Size | 49.1 MB | 31.2 MB |
| Events in quadrant A | 302,714 | 151,029 |
| Events in quadrant B | 296,706 | 155,089 |
| Events in quadrant C | 299,618 | 149,830 |
| Events in quadrant D | 242,464 | 115,894 |
| Mode SS | |||
|---|---|---|---|
| Quadrant | BADHDUFLAG | Total packets | Discarded packets |
| A | 0 | 122 | 0 |
| B | 0 | 122 | 0 |
| C | 0 | 122 | 0 |
| D | 0 | 122 | 0 |
| Mode M9 | |||
|---|---|---|---|
| Quadrant | BADHDUFLAG | Total packets | Discarded packets |
| A | 0 | 8 | 0 |
| B | 0 | 8 | 0 |
| C | 0 | 8 | 0 |
| D | 0 | 8 | 0 |
| Mode M0 | |||
|---|---|---|---|
| Quadrant | BADHDUFLAG | Total packets | Discarded packets |
| A | 0 | 12086 | 0 |
| B | 0 | 12146 | 0 |
| C | 0 | 12173 | 0 |
| D | 0 | 18276 | 0 |
| Quadrant | Total seconds | Saturated seconds | Saturation percentage |
|---|---|---|---|
| A | 5995 | 9 | 0.150125% |
| B | 5995 | 10 | 0.166806% |
| C | 5995 | 13 | 0.216847% |
| D | 5995 | 616 | 10.275229% |
Noise dominated data is calculated using 1-second bins in cleaned event files. If a bin has >2000 counts, and if more than 50% of those come from <1% of pixels, then it is considered to be noise-dominated and hence unusable.
| Quadrant | # 1 sec bins | Bins with >0 counts | Bins with >2000 counts | High rate bins dominated by noise | Noise dominated (total time) | Noise dominated (detector-on time) | Marked lightcurve |
|---|---|---|---|---|---|---|---|
| A | 6805 | 5995 | 0 | 0 | 0.00% | 0.00% |  |
| B | 6805 | 5995 | 0 | 0 | 0.00% | 0.00% |  |
| C | 6805 | 5994 | 0 | 0 | 0.00% | 0.00% |  |
| D | 6805 | 5990 | 0 | 0 | 0.00% | 0.00% |  |
Top three noisy pixels from each quadrant. If the there are fewer than three noisy pixels in the level2.evt file, extra rows are filled as -1
| Pixel properties | Quadrant properties | ||||||
|---|---|---|---|---|---|---|---|
| Quadrant | DetID | PixID | Counts | Sigma | Mean | Median | Sigma |
| A | 7 | 110 | 299 | 10.34 | 78 | 73 | 21.9 |
| A | 14 | 188 | 294 | 10.11 | 78 | 73 | 21.9 |
| A | 0 | 29 | 290 | 9.92 | 78 | 73 | 21.9 |
| B | 2 | 9 | 252 | 9.92 | 78 | 74 | 17.9 |
| B | 12 | 226 | 227 | 8.53 | 78 | 74 | 17.9 |
| B | 14 | 254 | 223 | 8.3 | 78 | 74 | 17.9 |
| C | 9 | 188 | 218 | 6.25 | 79 | 73 | 23.2 |
| C | 1 | 65 | 216 | 6.16 | 79 | 73 | 23.2 |
| C | 1 | 81 | 208 | 5.82 | 79 | 73 | 23.2 |
| D | 3 | 14 | 222 | 7.85 | 68 | 62 | 20.4 |
| D | 11 | 82 | 194 | 6.48 | 68 | 62 | 20.4 |
| D | 7 | 3 | 191 | 6.33 | 68 | 62 | 20.4 |
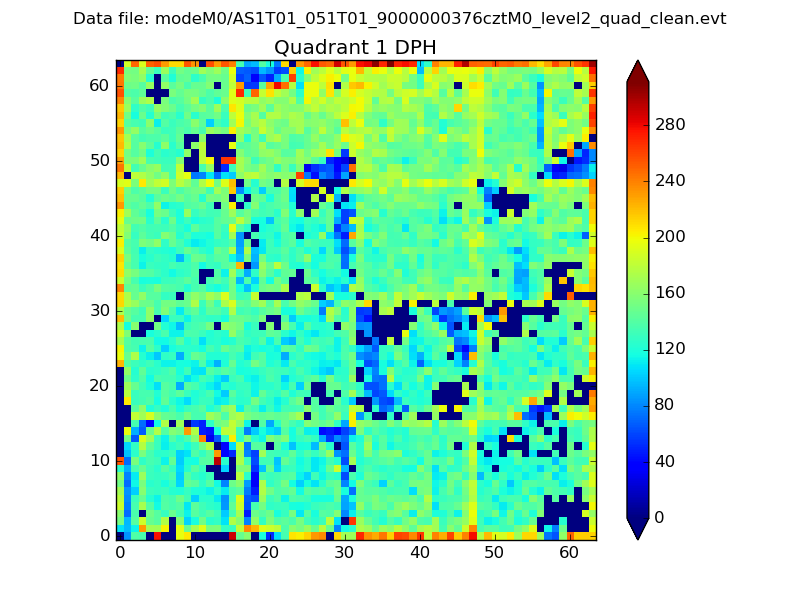
Histogram calculated using DETX and DETY for each event in the final _common_clean file
| Quadrant A |  |
 |
Quadrant B |
|---|---|---|---|
| Quadrant D |  |
 |
Quadrant C |
| Plot type | Count rate plots | Images |
|---|---|---|
| Comparison with Poisson distribution Blue bars denote a histogram of data divided into 1 sec bins. Red curve is a Poisson curve with rate = median count rate of data. |
 |
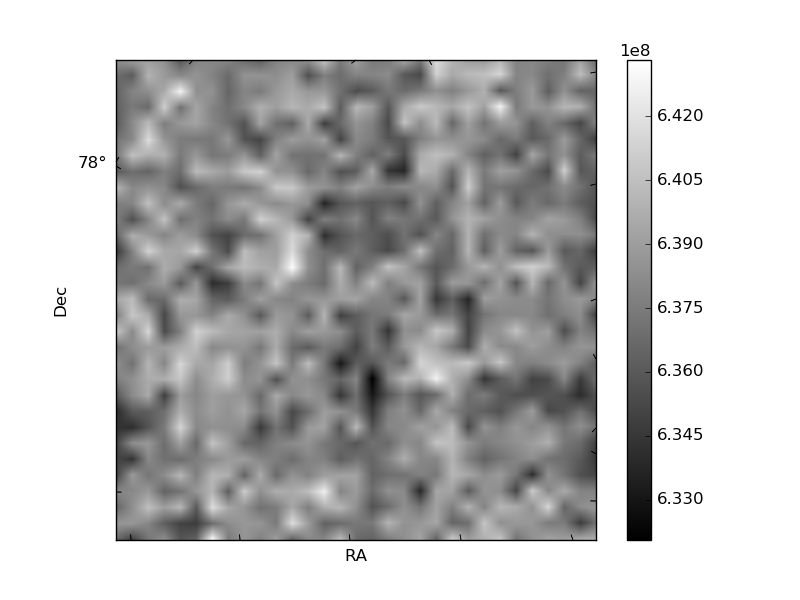 |
| Quadrant-wise count rates Data is divided into 100 sec bins |
 |
|
| Module-wise count rates for Quadrant A Data is divided into 100 sec bins |
 |
 |
| Module-wise count rates for Quadrant B Data is divided into 100 sec bins |
 |
 |
| Module-wise count rates for Quadrant C Data is divided into 100 sec bins |
 |
 |
| Module-wise count rates for Quadrant D Data is divided into 100 sec bins |
 |
 |
| Parameter | Plot |
|---|---|
| CZT HV Monitor | 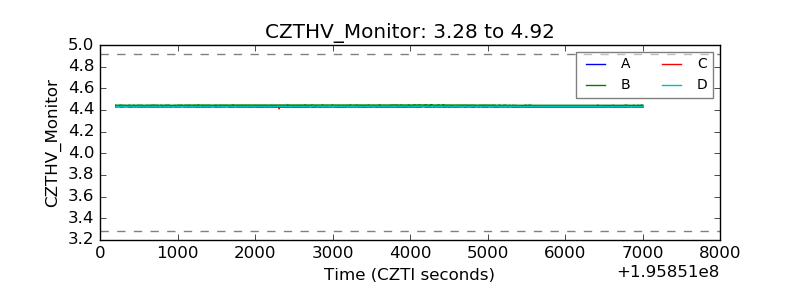 |
| D_VDD |  |
| Temperature 1 |  |
| Veto HV Monitor |  |
| Veto LLD |  |
| Alpha Counter |  |
| _CPM_Rate |  |
| CZT Counter |  |
| +2.5 Volts monitor |  |
| +5 Volts monitor |  |
| _ROLL_ROT |  |
| _Roll_DEC | 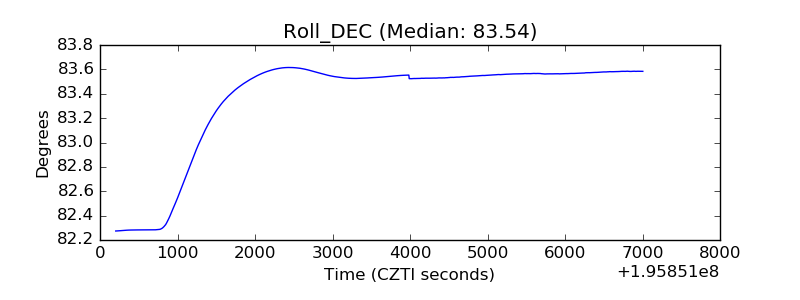 |
| _Roll_RA |  |
| Veto Counter |  |