| Param | Original file | Final file |
|---|---|---|
| Filename | modeM0/AS1T01_057T01_9000000380cztM0_level2.fits | modeM0/AS1T01_057T01_9000000380cztM0_level2_quad_clean.evt |
| Size (bytes) | 22,835,520 | 37,373,760 |
| Size | 21.8 MB | 35.6 MB |
| Events in quadrant A | 133,516 | 245,640 |
| Events in quadrant B | 126,954 | 244,138 |
| Events in quadrant C | 129,524 | 234,792 |
| Events in quadrant D | 110,346 | 215,210 |
| Mode M0 | |||
|---|---|---|---|
| Quadrant | BADHDUFLAG | Total packets | Discarded packets |
| A | 0 | 5373 | 0 |
| B | 0 | 5663 | 0 |
| C | 0 | 5549 | 0 |
| D | 0 | 6342 | 0 |
| Mode SS | |||
|---|---|---|---|
| Quadrant | BADHDUFLAG | Total packets | Discarded packets |
| A | 0 | 52 | 0 |
| B | 0 | 52 | 0 |
| C | 0 | 52 | 0 |
| D | 0 | 52 | 0 |
| Mode M9 | |||
|---|---|---|---|
| Quadrant | BADHDUFLAG | Total packets | Discarded packets |
| A | 0 | 204 | 0 |
| B | 0 | 204 | 0 |
| C | 0 | 204 | 0 |
| D | 0 | 204 | 0 |
| Quadrant | Total seconds | Saturated seconds | Saturation percentage |
|---|---|---|---|
| A | 2678 | 4 | 0.149365% |
| B | 2678 | 5 | 0.186706% |
| C | 2678 | 2 | 0.074683% |
| D | 2678 | 31 | 1.157580% |
Noise dominated data is calculated using 1-second bins in cleaned event files. If a bin has >2000 counts, and if more than 50% of those come from <1% of pixels, then it is considered to be noise-dominated and hence unusable.
| Quadrant | # 1 sec bins | Bins with >0 counts | Bins with >2000 counts | High rate bins dominated by noise | Noise dominated (total time) | Noise dominated (detector-on time) | Marked lightcurve |
|---|---|---|---|---|---|---|---|
| A | 2678 | 2678 | 0 | 0 | 0.00% | 0.00% |  |
| B | 2678 | 2678 | 0 | 0 | 0.00% | 0.00% |  |
| C | 2678 | 2678 | 0 | 0 | 0.00% | 0.00% |  |
| D | 2678 | 2678 | 0 | 0 | 0.00% | 0.00% |  |
Top three noisy pixels from each quadrant. If the there are fewer than three noisy pixels in the level2.evt file, extra rows are filled as -1
| Pixel properties | Quadrant properties | ||||||
|---|---|---|---|---|---|---|---|
| Quadrant | DetID | PixID | Counts | Sigma | Mean | Median | Sigma |
| A | 0 | 29 | 147 | 10.5 | 34 | 32 | 11.0 |
| A | 14 | 188 | 145 | 10.32 | 34 | 32 | 11.0 |
| A | 14 | 204 | 122 | 8.22 | 34 | 32 | 11.0 |
| B | 2 | 9 | 116 | 9.26 | 33 | 32 | 9.1 |
| B | 12 | 226 | 108 | 8.38 | 33 | 32 | 9.1 |
| B | 5 | 225 | 98 | 7.28 | 33 | 32 | 9.1 |
| C | 12 | 241 | 105 | 6.67 | 34 | 31 | 11.1 |
| C | 9 | 188 | 103 | 6.49 | 34 | 31 | 11.1 |
| C | 7 | 111 | 103 | 6.49 | 34 | 31 | 11.1 |
| D | 4 | 160 | 97 | 6.74 | 31 | 28 | 10.2 |
| D | 1 | 19 | 97 | 6.74 | 31 | 28 | 10.2 |
| D | 4 | 144 | 85 | 5.57 | 31 | 28 | 10.2 |
Histogram calculated using DETX and DETY for each event in the final _common_clean file
| Quadrant A |  |
 |
Quadrant B |
|---|---|---|---|
| Quadrant D |  |
 |
Quadrant C |
| Plot type | Count rate plots | Images |
|---|---|---|
| Comparison with Poisson distribution Blue bars denote a histogram of data divided into 1 sec bins. Red curve is a Poisson curve with rate = median count rate of data. |
 |
 |
| Quadrant-wise count rates Data is divided into 100 sec bins |
 |
|
| Module-wise count rates for Quadrant A Data is divided into 100 sec bins |
 |
 |
| Module-wise count rates for Quadrant B Data is divided into 100 sec bins |
 |
 |
| Module-wise count rates for Quadrant C Data is divided into 100 sec bins |
 |
 |
| Module-wise count rates for Quadrant D Data is divided into 100 sec bins |
 |
 |
| Parameter | Plot |
|---|---|
| CZT HV Monitor |  |
| D_VDD | 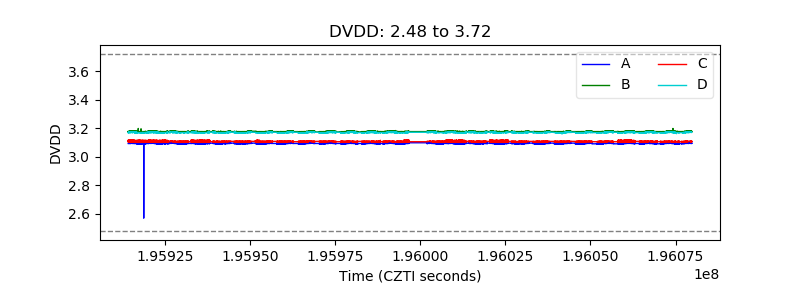 |
| Temperature 1 |  |
| Veto HV Monitor |  |
| Veto LLD |  |
| Alpha Counter |  |
| _CPM_Rate |  |
| CZT Counter |  |
| +2.5 Volts monitor |  |
| +5 Volts monitor |  |
| _ROLL_ROT |  |
| _Roll_DEC |  |
| _Roll_RA |  |
| Veto Counter |  |