| Param | Original file | Final file |
|---|---|---|
| Filename | modeM0/AS1T01_057T01_9000000380_02537cztM0_level2.evt | modeM0/AS1T01_057T01_9000000380_02537cztM0_level2_quad_clean.evt |
| Size (bytes) | 223,750,080 | 33,183,360 |
| Size | 213.4 MB | 31.6 MB |
| Events in quadrant A | 1,369,378 | 208,524 |
| Events in quadrant B | 1,364,562 | 213,172 |
| Events in quadrant C | 1,943,269 | 206,819 |
| Events in quadrant D | 1,928,332 | 197,230 |
| Mode M0 | |||
|---|---|---|---|
| Quadrant | BADHDUFLAG | Total packets | Discarded packets |
| A | 0 | 5669 | 2 |
| B | 0 | 5698 | 1 |
| C | 0 | 7462 | 1 |
| D | 0 | 7414 | 1 |
| Mode SS | |||
|---|---|---|---|
| Quadrant | BADHDUFLAG | Total packets | Discarded packets |
| A | 0 | 50 | 0 |
| B | 0 | 50 | 0 |
| C | 0 | 50 | 0 |
| D | 0 | 50 | 0 |
| Quadrant | Total seconds | Saturated seconds | Saturation percentage |
|---|---|---|---|
| A | 2485 | 149 | 5.995976% |
| B | 2485 | 148 | 5.955734% |
| C | 2485 | 246 | 9.899396% |
| D | 2485 | 169 | 6.800805% |
Noise dominated data is calculated using 1-second bins in cleaned event files. If a bin has >2000 counts, and if more than 50% of those come from <1% of pixels, then it is considered to be noise-dominated and hence unusable.
| Quadrant | # 1 sec bins | Bins with >0 counts | Bins with >2000 counts | High rate bins dominated by noise | Noise dominated (total time) | Noise dominated (detector-on time) | Marked lightcurve |
|---|---|---|---|---|---|---|---|
| A | 2500 | 2486 | 0 | 0 | 0.00% | 0.00% | 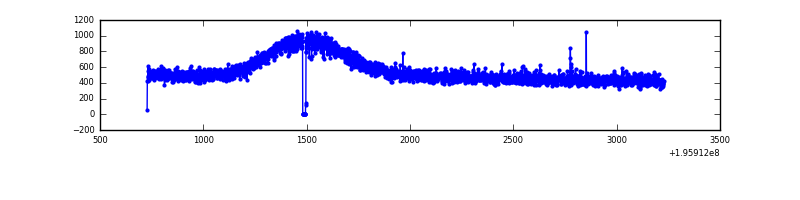 |
| B | 2500 | 2486 | 0 | 0 | 0.00% | 0.00% | 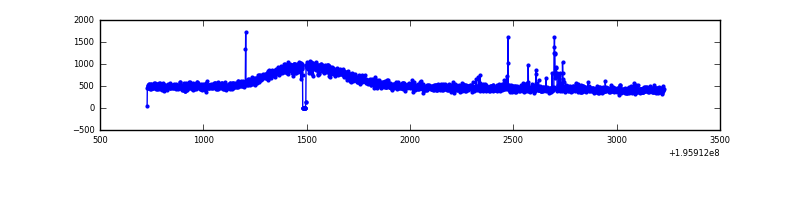 |
| C | 2500 | 2486 | 125 | 125 | 5.00% | 5.03% | 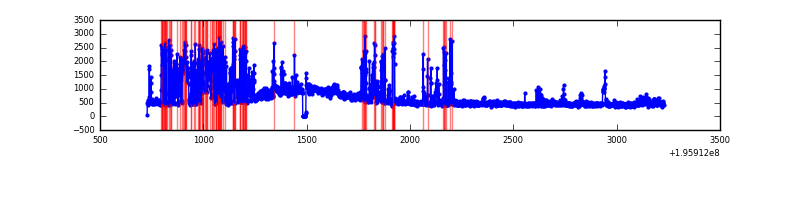 |
| D | 2500 | 2486 | 100 | 100 | 4.00% | 4.02% | 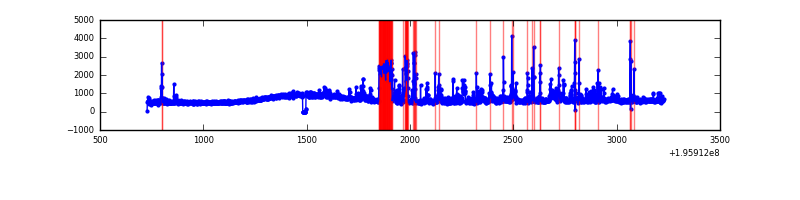 |
Top three noisy pixels from each quadrant. If the there are fewer than three noisy pixels in the level2.evt file, extra rows are filled as -1
| Pixel properties | Quadrant properties | ||||||
|---|---|---|---|---|---|---|---|
| Quadrant | DetID | PixID | Counts | Sigma | Mean | Median | Sigma |
| A | 8 | 15 | 31541 | 415.44 | 347 | 337 | 75.1 |
| A | 12 | 194 | 3899 | 47.42 | 347 | 337 | 75.1 |
| A | 0 | 226 | 3732 | 45.2 | 347 | 337 | 75.1 |
| B | 5 | 172 | 14924 | 201.3 | 346 | 336 | 72.5 |
| B | 12 | 111 | 5504 | 71.31 | 346 | 336 | 72.5 |
| B | 15 | 85 | 5167 | 66.66 | 346 | 336 | 72.5 |
| C | 9 | 144 | 602638 | 7585.05 | 321 | 322 | 79.4 |
| C | 12 | 4 | 57237 | 716.74 | 321 | 322 | 79.4 |
| C | 8 | 112 | 9115 | 110.73 | 321 | 322 | 79.4 |
| D | 11 | 131 | 244617 | 3026.19 | 326 | 318 | 80.7 |
| D | 10 | 102 | 212966 | 2634.13 | 326 | 318 | 80.7 |
| D | 2 | 184 | 62221 | 766.81 | 326 | 318 | 80.7 |
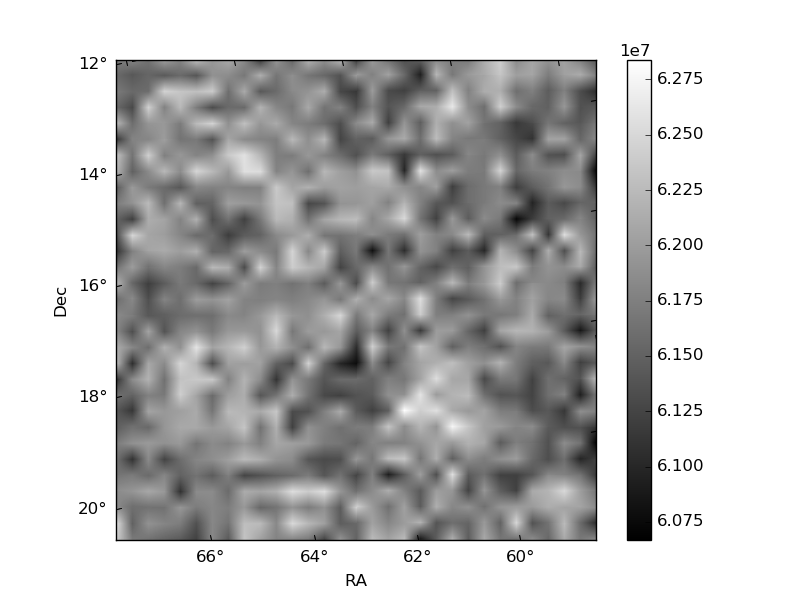
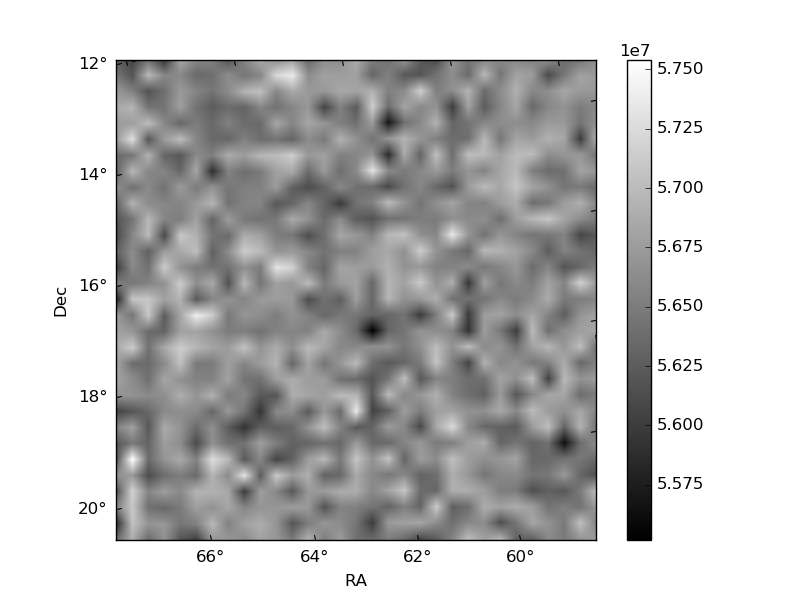
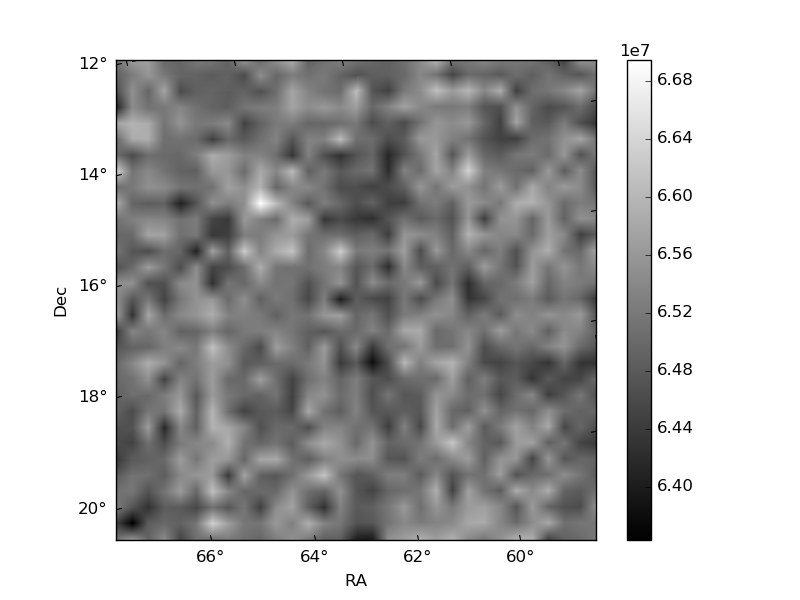
Histogram calculated using DETX and DETY for each event in the final _common_clean file
| Quadrant A | 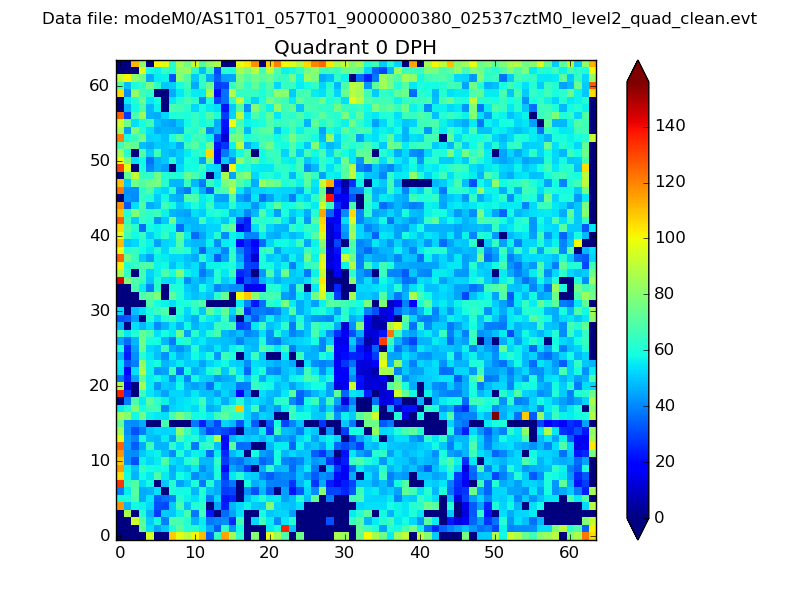 |
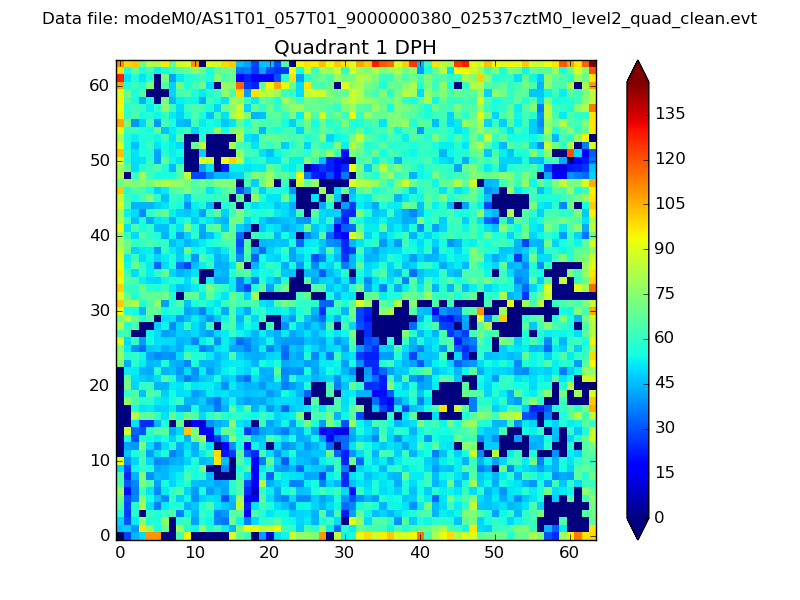 |
Quadrant B |
|---|---|---|---|
| Quadrant D | 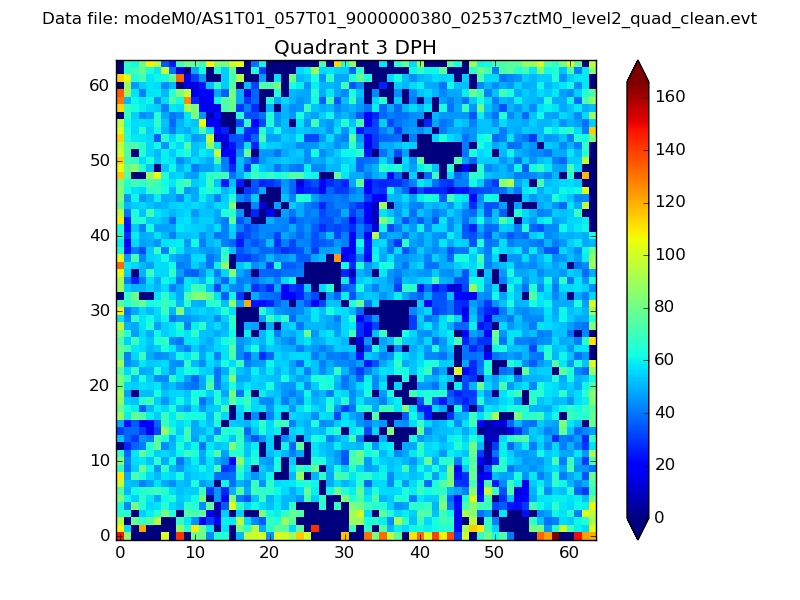 |
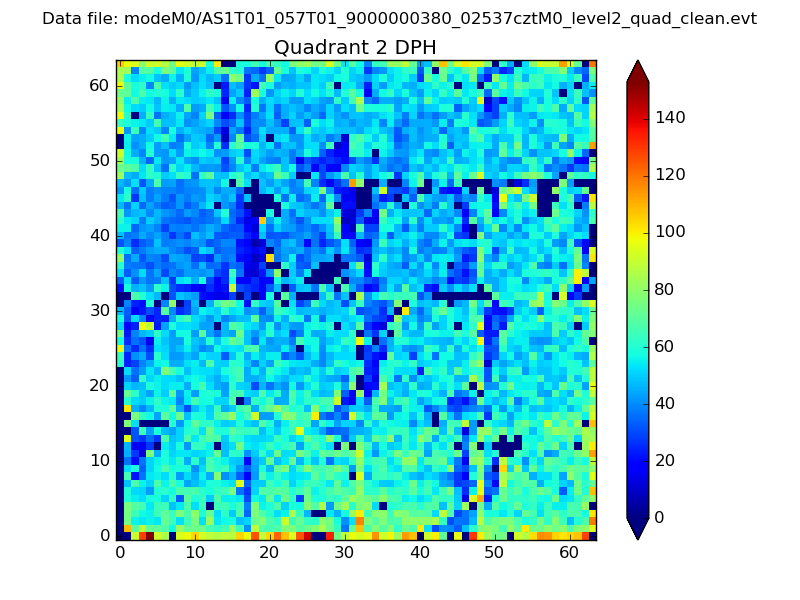 |
Quadrant C |
| Plot type | Count rate plots | Images |
|---|---|---|
| Comparison with Poisson distribution Blue bars denote a histogram of data divided into 1 sec bins. Red curve is a Poisson curve with rate = median count rate of data. |
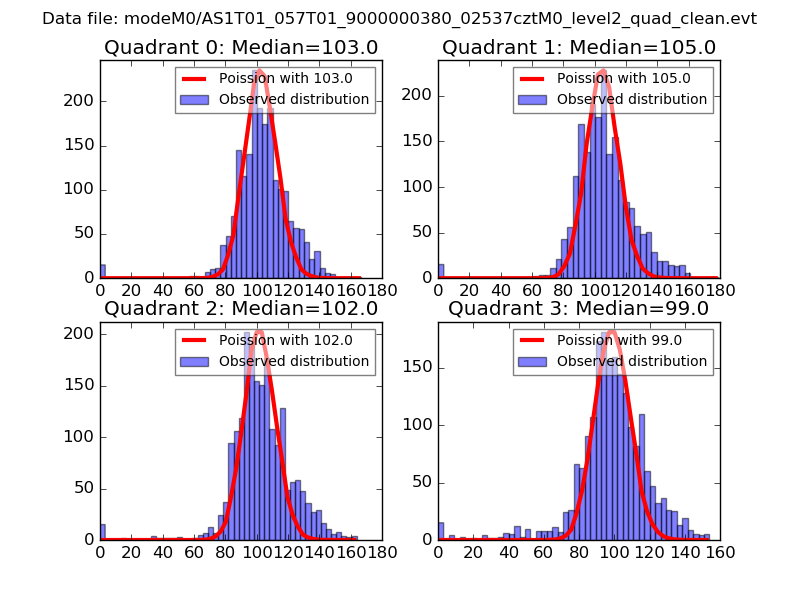 |
 |
| Quadrant-wise count rates Data is divided into 100 sec bins |
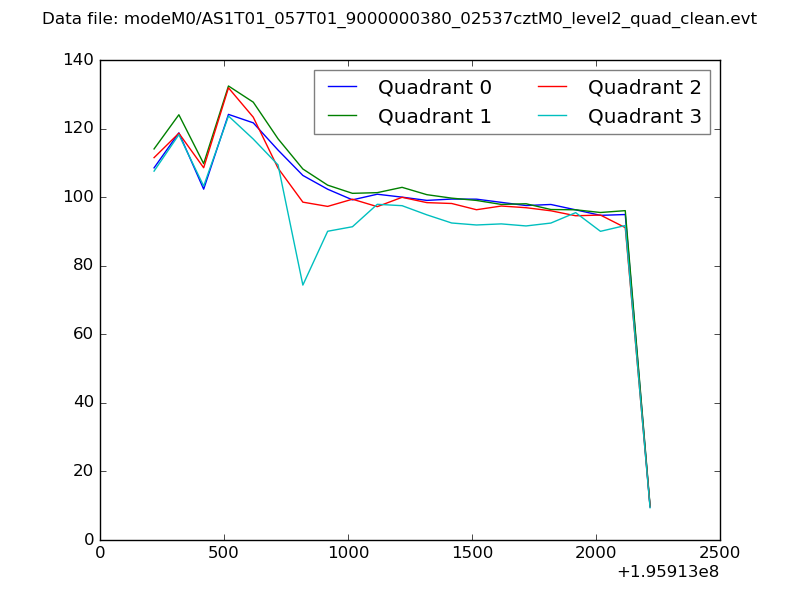 |
|
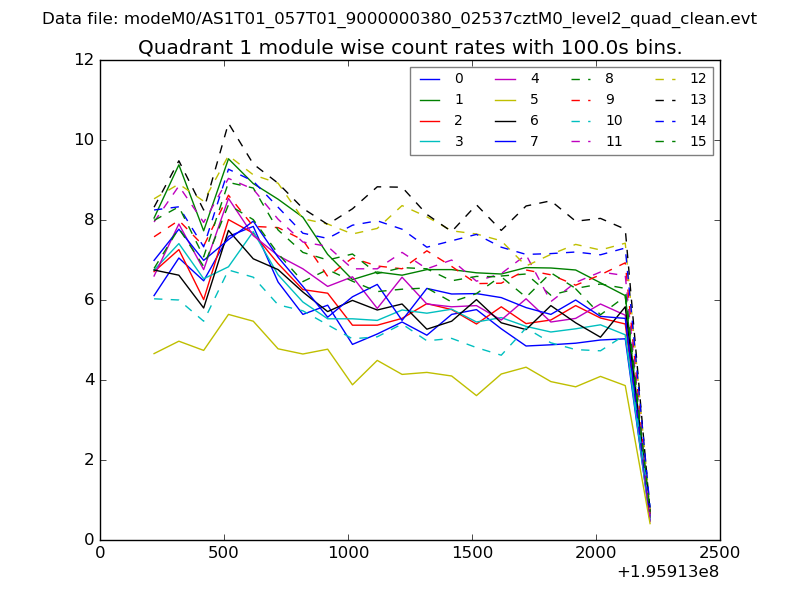
| Module-wise count rates for Quadrant A Data is divided into 100 sec bins |
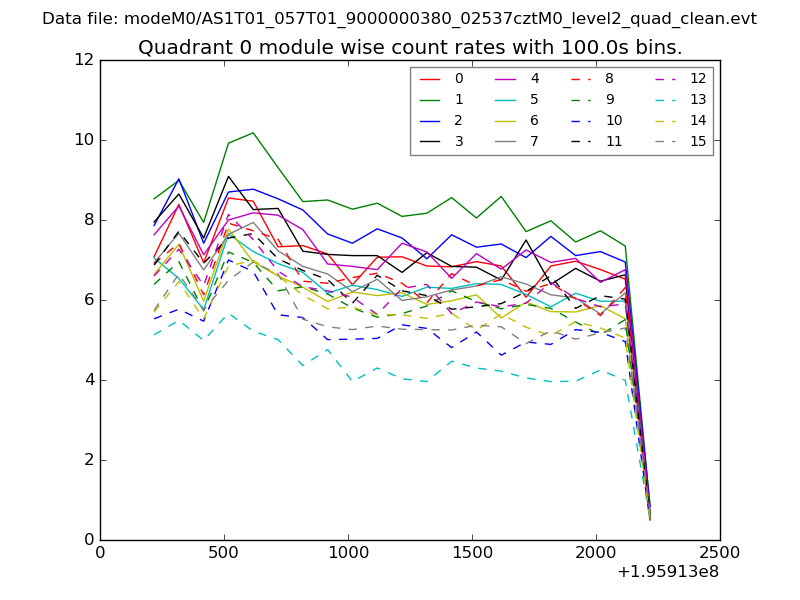 |
 |
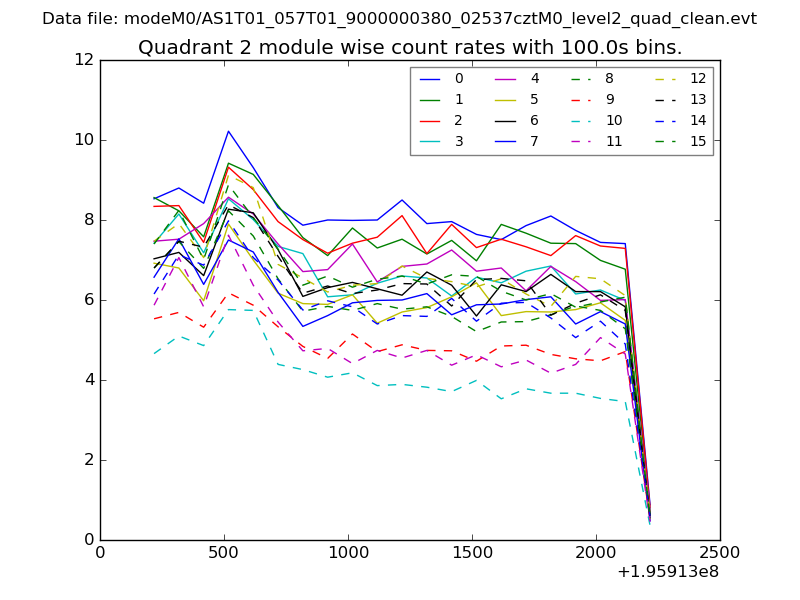
| Module-wise count rates for Quadrant B Data is divided into 100 sec bins |
 |
 |
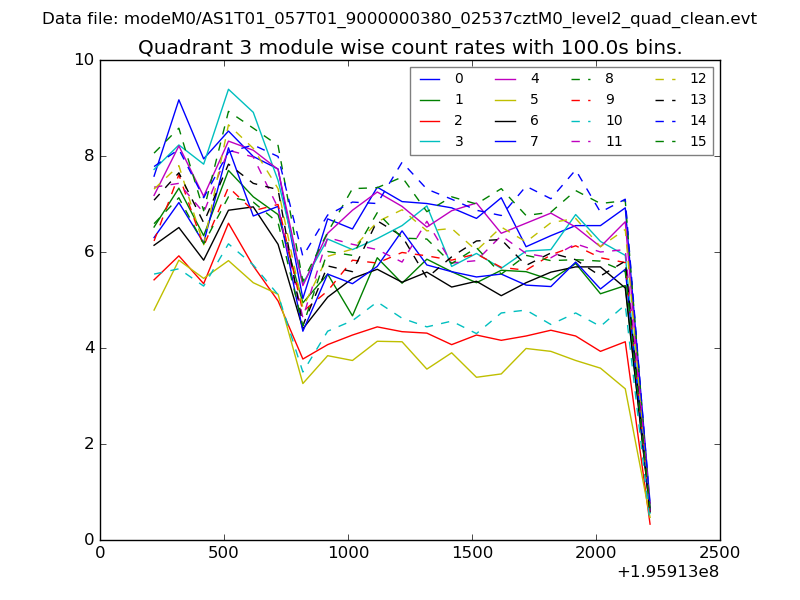
| Module-wise count rates for Quadrant C Data is divided into 100 sec bins |
 |
 |
| Module-wise count rates for Quadrant D Data is divided into 100 sec bins |
 |
 |
| Parameter | Plot |
|---|---|
| CZT HV Monitor | 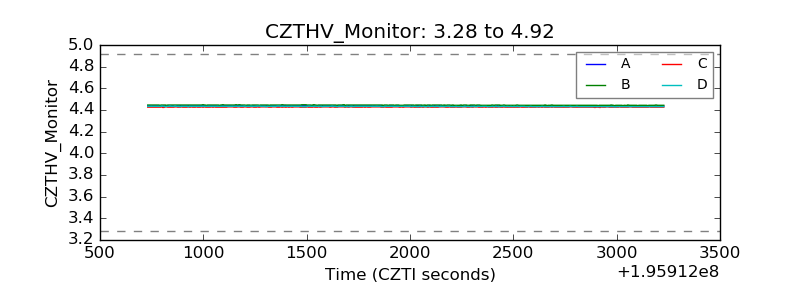 |
| D_VDD | 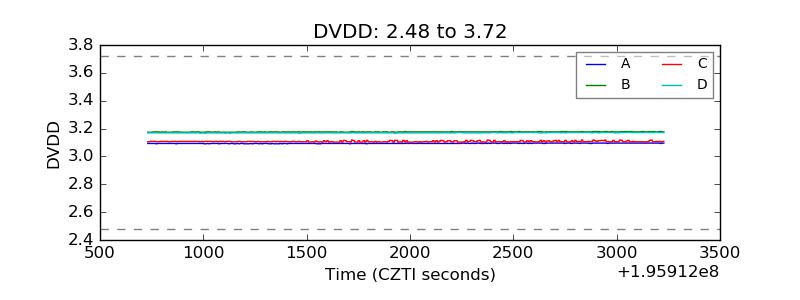 |
| Temperature 1 | 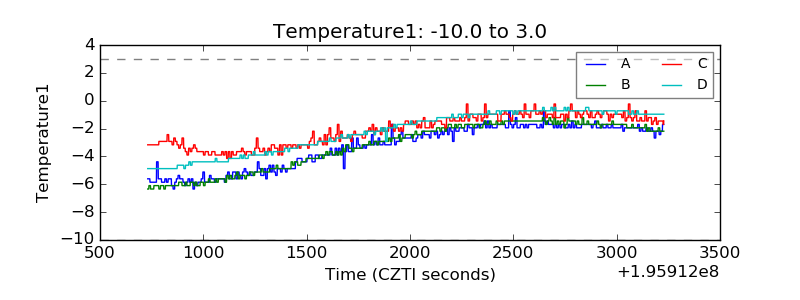 |
| Veto HV Monitor | 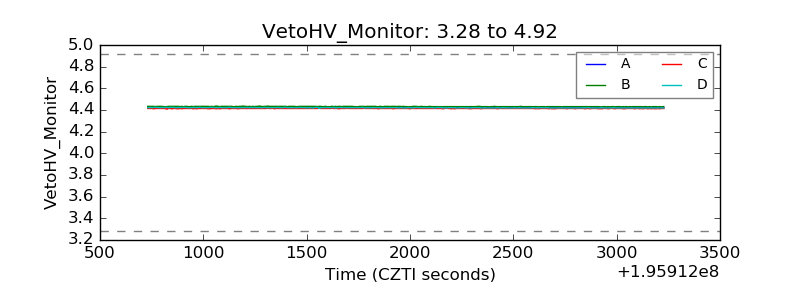 |
| Veto LLD | 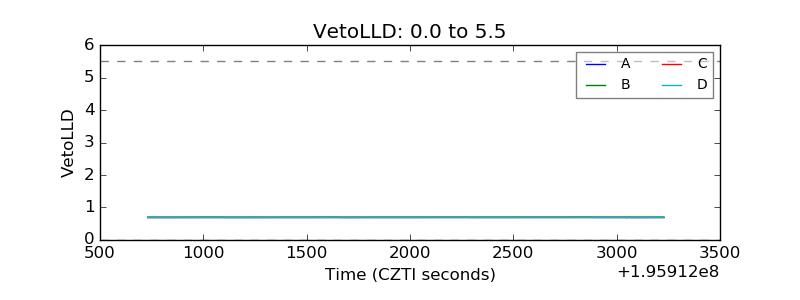 |
| Alpha Counter | 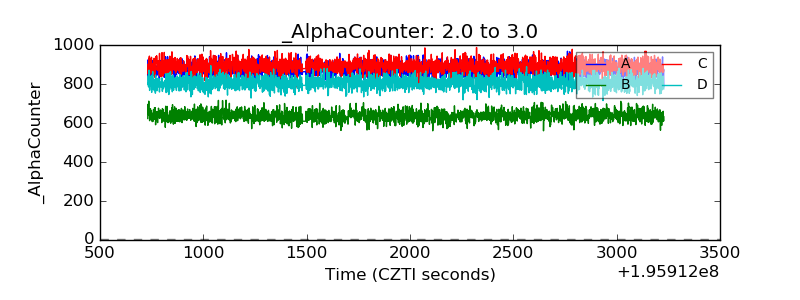 |
| _CPM_Rate |  |
| CZT Counter | 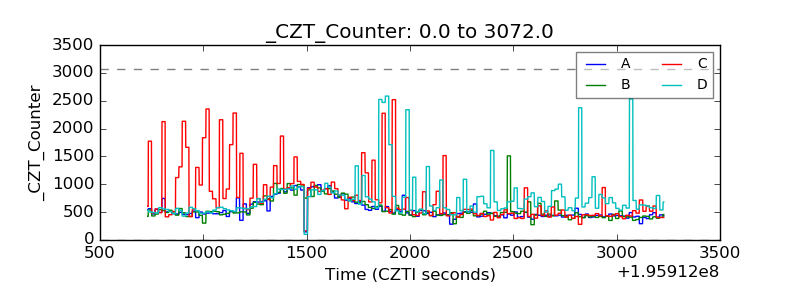 |
| +2.5 Volts monitor |  |
| +5 Volts monitor |  |
| Veto Counter | 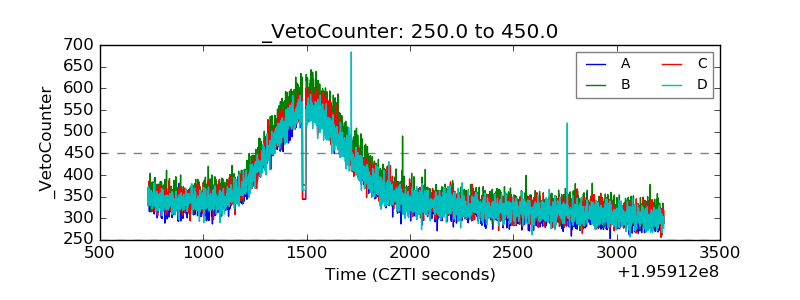 |