| Param | Original file | Final file |
|---|---|---|
| Filename | modeM0/AS1T01_071T01_9000000382cztM0_level2.fits | modeM0/AS1T01_071T01_9000000382cztM0_level2_quad_clean.evt |
| Size (bytes) | 1,516,406,400 | 1,595,718,720 |
| Size | 1.4 GB | 1.5 GB |
| Events in quadrant A | 9,011,584 | 9,457,537 |
| Events in quadrant B | 8,788,574 | 9,578,676 |
| Events in quadrant C | 8,898,826 | 9,207,728 |
| Events in quadrant D | 7,521,914 | 8,384,828 |
| Mode M9 | |||
|---|---|---|---|
| Quadrant | BADHDUFLAG | Total packets | Discarded packets |
| A | 0 | 219 | 0 |
| B | 0 | 219 | 0 |
| C | 0 | 219 | 0 |
| D | 0 | 219 | 0 |
| Mode M0 | |||
|---|---|---|---|
| Quadrant | BADHDUFLAG | Total packets | Discarded packets |
| A | 0 | 353142 | 0 |
| B | 0 | 356971 | 0 |
| C | 0 | 360596 | 0 |
| D | 0 | 397888 | 0 |
| Mode SS | |||
|---|---|---|---|
| Quadrant | BADHDUFLAG | Total packets | Discarded packets |
| A | 0 | 3472 | 0 |
| B | 0 | 3472 | 0 |
| C | 0 | 3472 | 0 |
| D | 0 | 3472 | 0 |
| Quadrant | Total seconds | Saturated seconds | Saturation percentage |
|---|---|---|---|
| A | 170806 | 2420 | 1.416812% |
| B | 170806 | 2511 | 1.470089% |
| C | 170806 | 2397 | 1.403346% |
| D | 170806 | 3534 | 2.069014% |
Noise dominated data is calculated using 1-second bins in cleaned event files. If a bin has >2000 counts, and if more than 50% of those come from <1% of pixels, then it is considered to be noise-dominated and hence unusable.
| Quadrant | # 1 sec bins | Bins with >0 counts | Bins with >2000 counts | High rate bins dominated by noise | Noise dominated (total time) | Noise dominated (detector-on time) | Marked lightcurve |
|---|---|---|---|---|---|---|---|
| A | 192587 | 170809 | 0 | 0 | 0.00% | 0.00% | 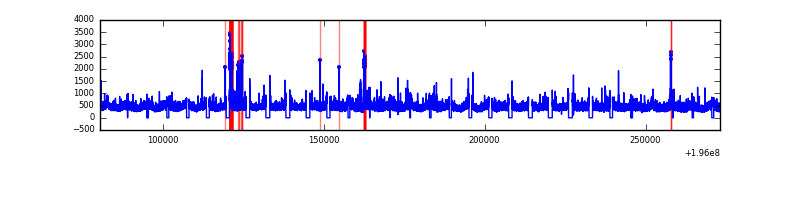 |
| B | 192587 | 170807 | 0 | 0 | 0.00% | 0.00% |  |
| C | 192587 | 170802 | 0 | 0 | 0.00% | 0.00% | 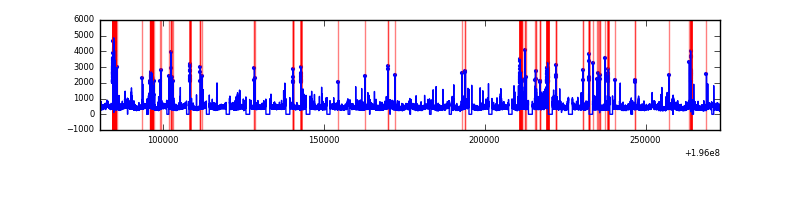 |
| D | 192587 | 170800 | 0 | 0 | 0.00% | 0.00% |  |
Top three noisy pixels from each quadrant. If the there are fewer than three noisy pixels in the level2.evt file, extra rows are filled as -1
| Pixel properties | Quadrant properties | ||||||
|---|---|---|---|---|---|---|---|
| Quadrant | DetID | PixID | Counts | Sigma | Mean | Median | Sigma |
| A | 0 | 29 | 8484 | 10.34 | 2340 | 2171 | 610.3 |
| A | 7 | 110 | 7903 | 9.39 | 2340 | 2171 | 610.3 |
| A | 14 | 79 | 6680 | 7.39 | 2340 | 2171 | 610.3 |
| B | 2 | 9 | 7861 | 12.44 | 2321 | 2198 | 455.4 |
| B | 12 | 226 | 6674 | 9.83 | 2321 | 2198 | 455.4 |
| B | 14 | 254 | 6330 | 9.07 | 2321 | 2198 | 455.4 |
| C | 2 | 127 | 6067 | 6.16 | 2355 | 2162 | 633.8 |
| C | 9 | 188 | 5923 | 5.93 | 2355 | 2162 | 633.8 |
| C | 9 | 242 | 5906 | 5.91 | 2355 | 2162 | 633.8 |
| D | 3 | 14 | 5665 | 6.21 | 2152 | 1943 | 599.0 |
| D | 11 | 82 | 5590 | 6.09 | 2152 | 1943 | 599.0 |
| D | 6 | 231 | 5561 | 6.04 | 2152 | 1943 | 599.0 |
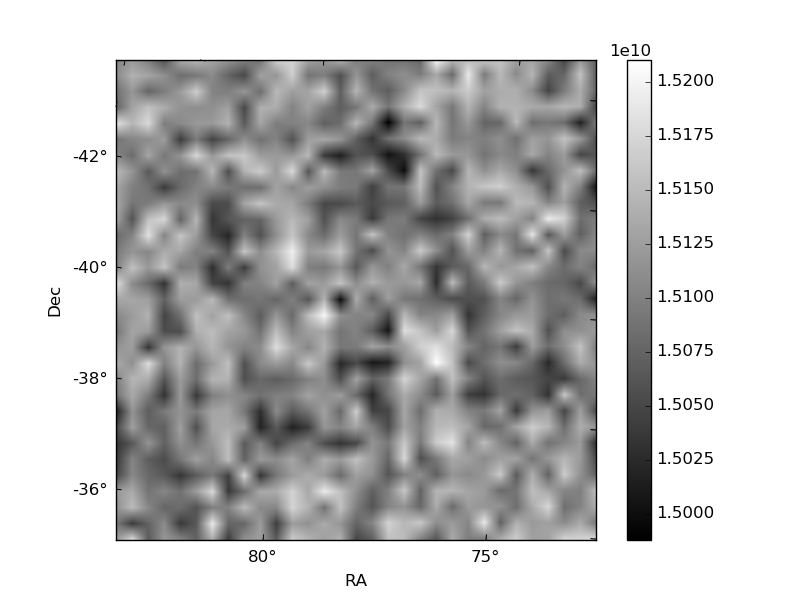
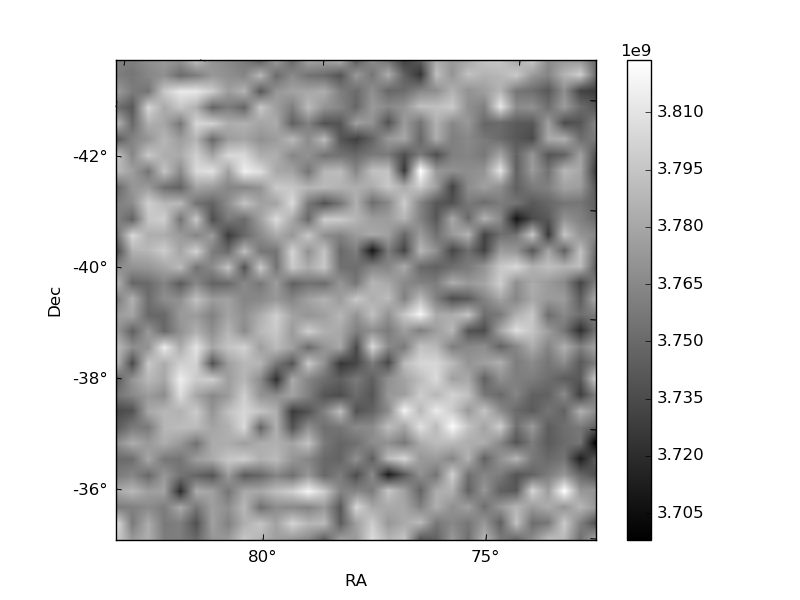
Histogram calculated using DETX and DETY for each event in the final _common_clean file
| Quadrant A |  |
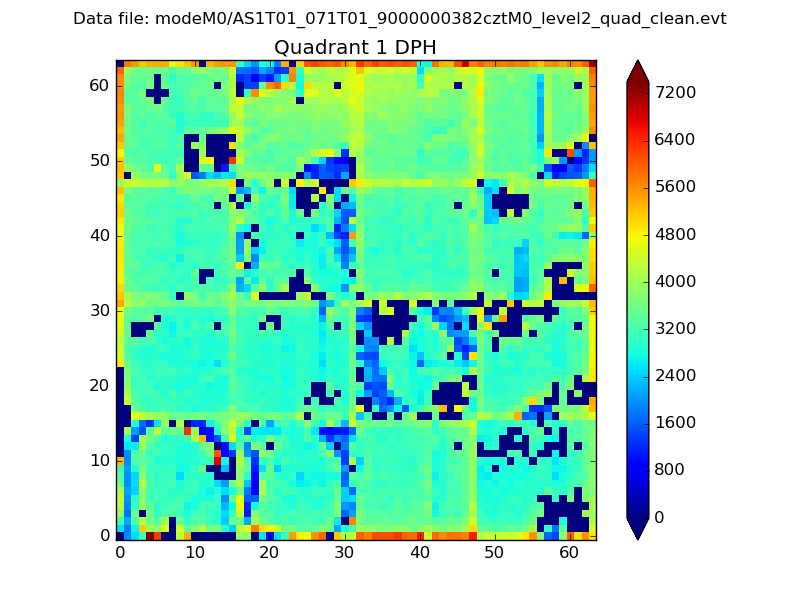 |
Quadrant B |
|---|---|---|---|
| Quadrant D | 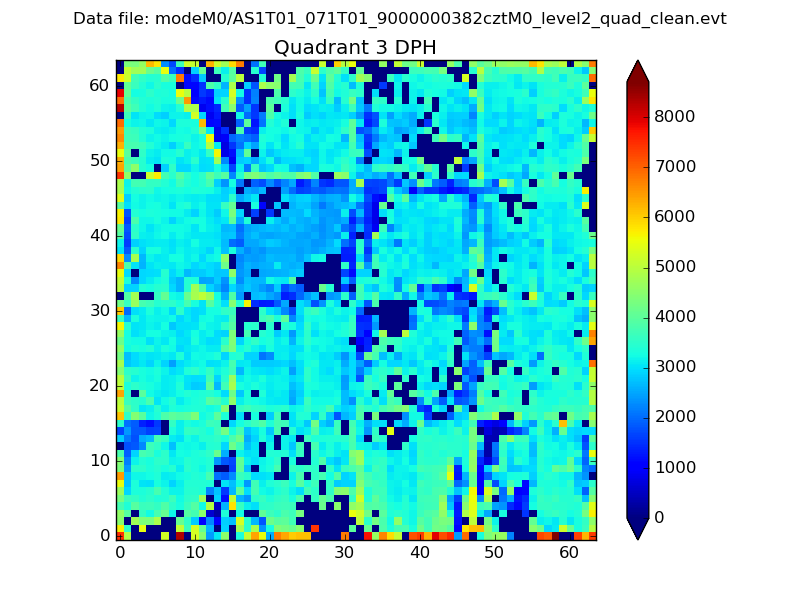 |
 |
Quadrant C |
| Plot type | Count rate plots | Images |
|---|---|---|
| Comparison with Poisson distribution Blue bars denote a histogram of data divided into 1 sec bins. Red curve is a Poisson curve with rate = median count rate of data. |
 |
 |
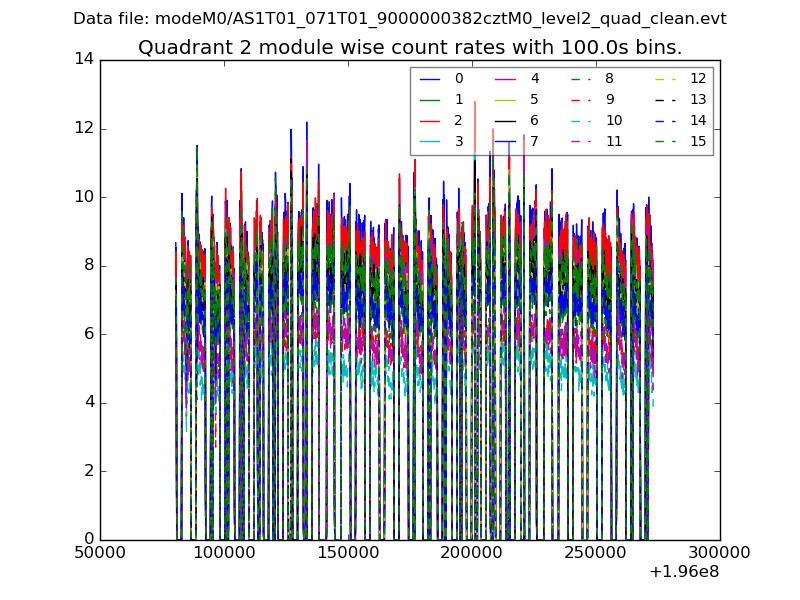
| Quadrant-wise count rates Data is divided into 100 sec bins |
 |
|
| Module-wise count rates for Quadrant A Data is divided into 100 sec bins |
 |
 |
| Module-wise count rates for Quadrant B Data is divided into 100 sec bins |
 |
 |
| Module-wise count rates for Quadrant C Data is divided into 100 sec bins |
 |
 |
| Module-wise count rates for Quadrant D Data is divided into 100 sec bins |
 |
 |
| Parameter | Plot |
|---|---|
| CZT HV Monitor |  |
| D_VDD |  |
| Temperature 1 |  |
| Veto HV Monitor |  |
| Veto LLD |  |
| Alpha Counter |  |
| _CPM_Rate |  |
| CZT Counter | 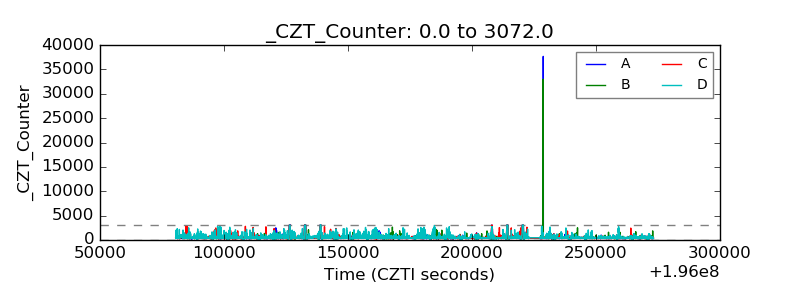 |
| +2.5 Volts monitor | 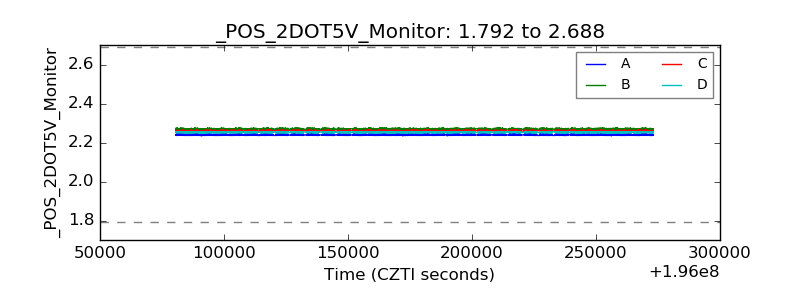 |
| +5 Volts monitor |  |
| _ROLL_ROT | 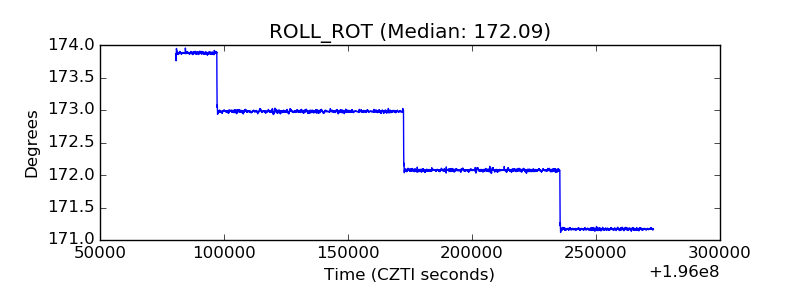 |
| _Roll_DEC | 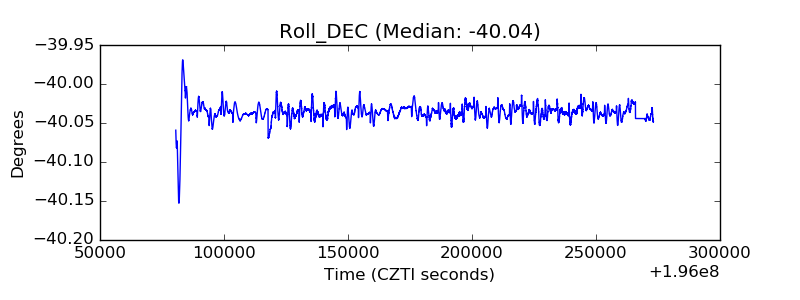 |
| _Roll_RA | 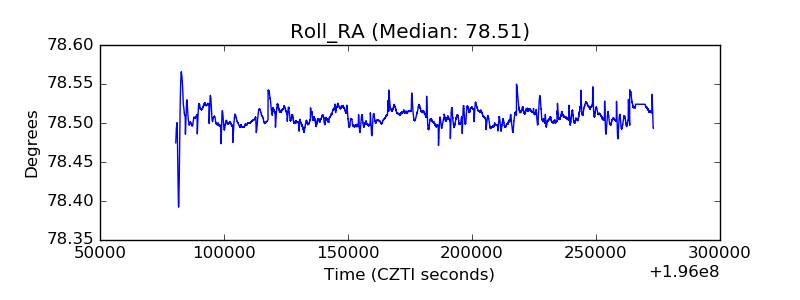 |
| Veto Counter |  |