| Param | Original file | Final file |
|---|---|---|
| Filename | modeM0/AS1T01_071T01_9000000382_02594cztM0_level2.evt | modeM0/AS1T01_071T01_9000000382_02594cztM0_level2_quad_clean.evt |
| Size (bytes) | 469,808,640 | 77,250,240 |
| Size | 448.0 MB | 73.7 MB |
| Events in quadrant A | 3,304,146 | 455,804 |
| Events in quadrant B | 3,559,167 | 461,062 |
| Events in quadrant C | 3,331,366 | 464,164 |
| Events in quadrant D | 3,534,118 | 447,179 |
| Mode M9 | |||
|---|---|---|---|
| Quadrant | BADHDUFLAG | Total packets | Discarded packets |
| A | 0 | 5 | 0 |
| B | 0 | 5 | 0 |
| C | 0 | 5 | 0 |
| D | 0 | 6 | 0 |
| Mode M0 | |||
|---|---|---|---|
| Quadrant | BADHDUFLAG | Total packets | Discarded packets |
| A | 0 | 15112 | 3 |
| B | 0 | 15636 | 2 |
| C | 0 | 15216 | 2 |
| D | 0 | 15757 | 2 |
| Mode SS | |||
|---|---|---|---|
| Quadrant | BADHDUFLAG | Total packets | Discarded packets |
| A | 0 | 148 | 0 |
| B | 0 | 148 | 0 |
| C | 0 | 148 | 0 |
| D | 0 | 148 | 0 |
| Quadrant | Total seconds | Saturated seconds | Saturation percentage |
|---|---|---|---|
| A | 7349 | 169 | 2.299633% |
| B | 7349 | 185 | 2.517349% |
| C | 7349 | 123 | 1.673697% |
| D | 7349 | 138 | 1.877807% |
Noise dominated data is calculated using 1-second bins in cleaned event files. If a bin has >2000 counts, and if more than 50% of those come from <1% of pixels, then it is considered to be noise-dominated and hence unusable.
| Quadrant | # 1 sec bins | Bins with >0 counts | Bins with >2000 counts | High rate bins dominated by noise | Noise dominated (total time) | Noise dominated (detector-on time) | Marked lightcurve |
|---|---|---|---|---|---|---|---|
| A | 7754 | 7351 | 0 | 0 | 0.00% | 0.00% | 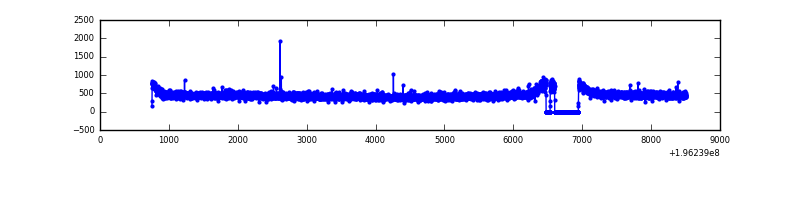 |
| B | 7754 | 7351 | 20 | 20 | 0.26% | 0.27% | 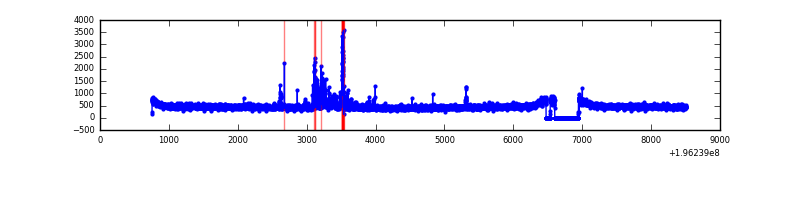 |
| C | 7754 | 7351 | 3 | 3 | 0.04% | 0.04% | 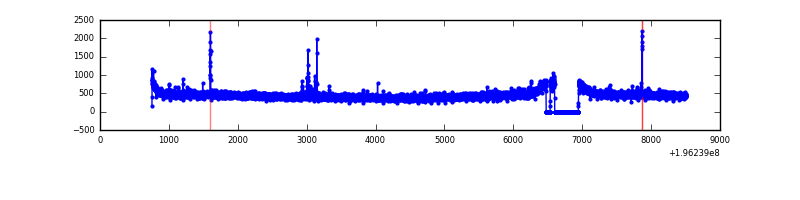 |
| D | 7754 | 7351 | 13 | 13 | 0.17% | 0.18% | 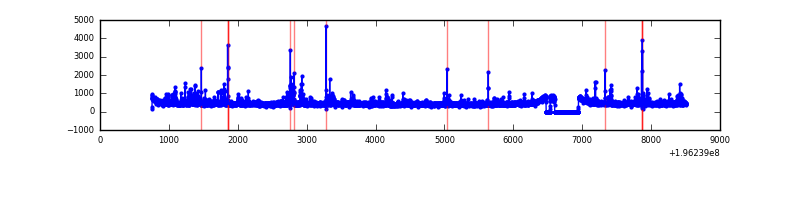 |
Top three noisy pixels from each quadrant. If the there are fewer than three noisy pixels in the level2.evt file, extra rows are filled as -1
| Pixel properties | Quadrant properties | ||||||
|---|---|---|---|---|---|---|---|
| Quadrant | DetID | PixID | Counts | Sigma | Mean | Median | Sigma |
| A | 3 | 1 | 18624 | 101.26 | 853 | 830 | 175.7 |
| A | 12 | 194 | 9688 | 50.41 | 853 | 830 | 175.7 |
| A | 0 | 226 | 9003 | 46.51 | 853 | 830 | 175.7 |
| B | 0 | 171 | 178821 | 1062.2 | 866 | 843 | 167.6 |
| B | 15 | 85 | 18448 | 105.07 | 866 | 843 | 167.6 |
| B | 12 | 111 | 12231 | 67.97 | 866 | 843 | 167.6 |
| C | 10 | 65 | 23459 | 116.41 | 833 | 835 | 194.4 |
| C | 12 | 4 | 20498 | 101.17 | 833 | 835 | 194.4 |
| C | 10 | 34 | 15788 | 76.94 | 833 | 835 | 194.4 |
| D | 2 | 184 | 176764 | 894.4 | 824 | 803 | 196.7 |
| D | 2 | 54 | 83552 | 420.61 | 824 | 803 | 196.7 |
| D | 2 | 136 | 50049 | 250.31 | 824 | 803 | 196.7 |
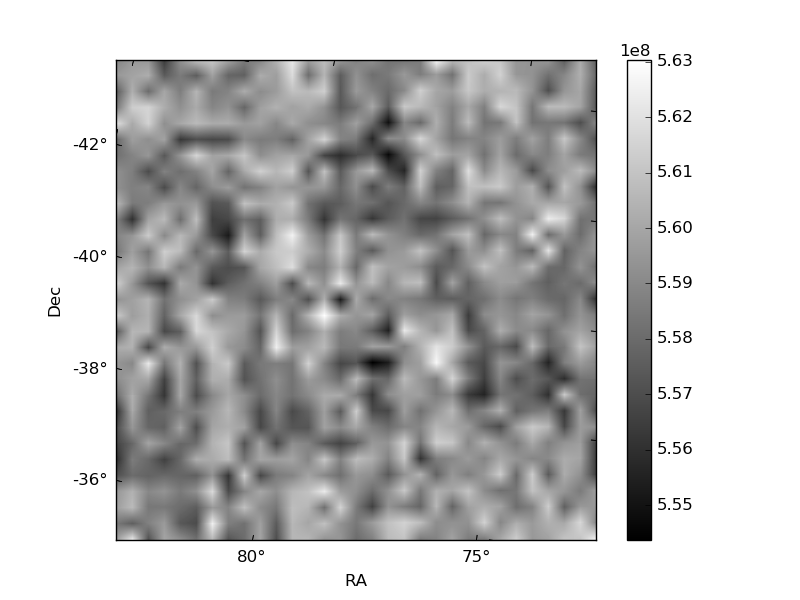
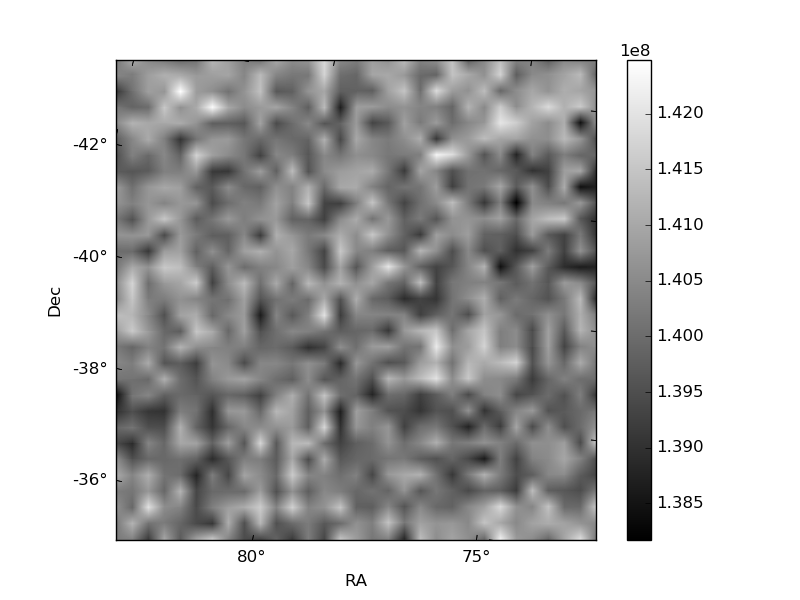
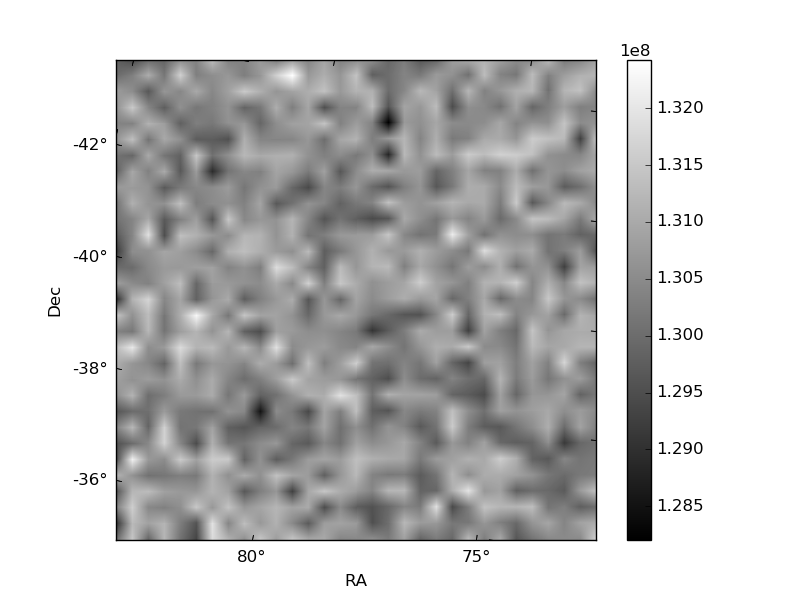
Histogram calculated using DETX and DETY for each event in the final _common_clean file
| Quadrant A | 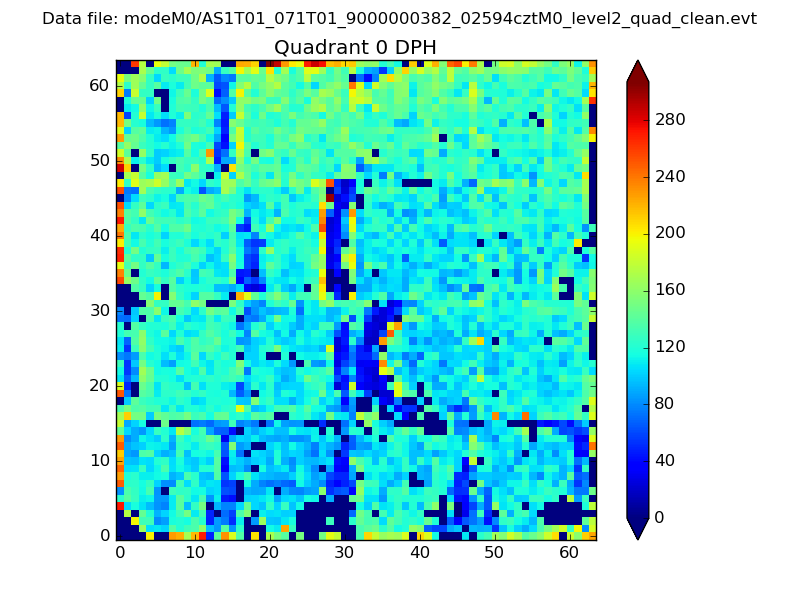 |
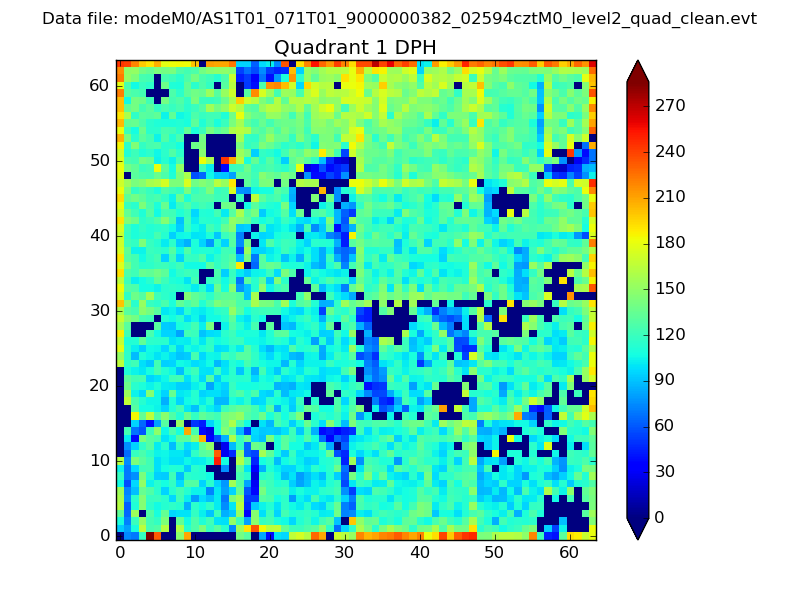 |
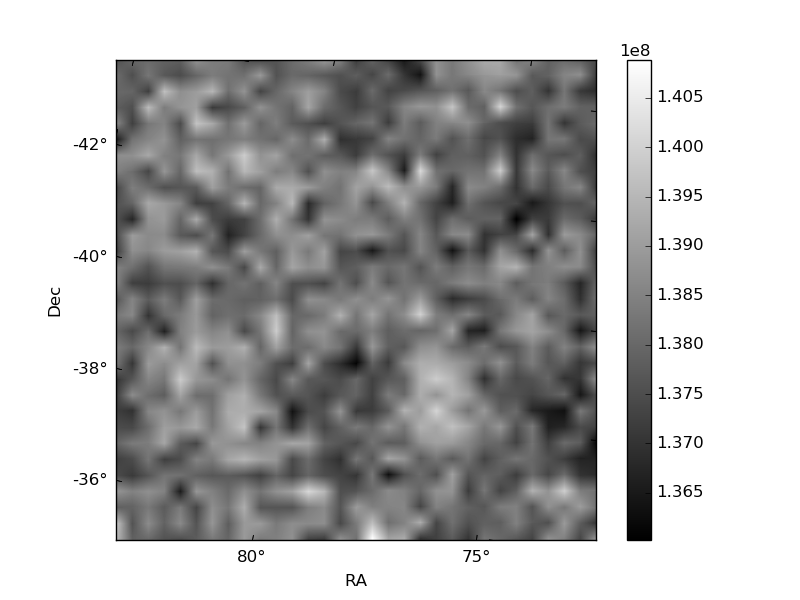
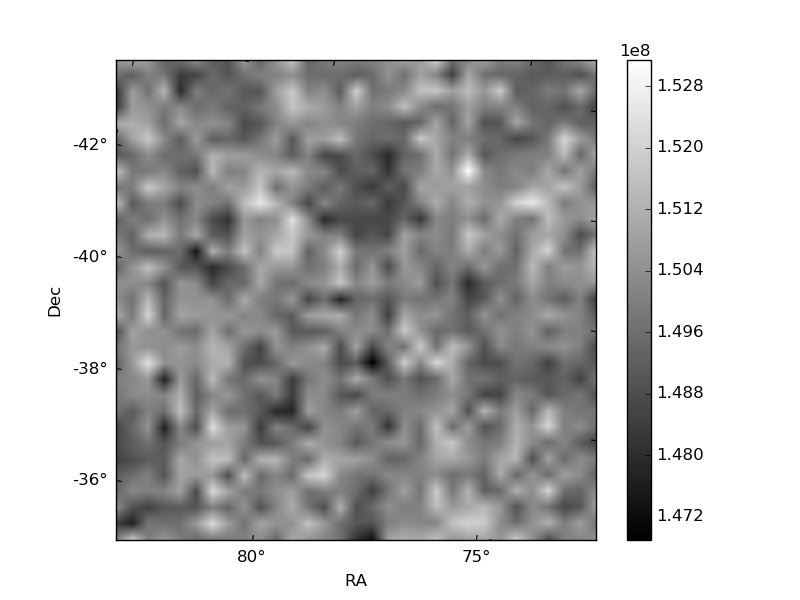
Quadrant B |
|---|---|---|---|
| Quadrant D | 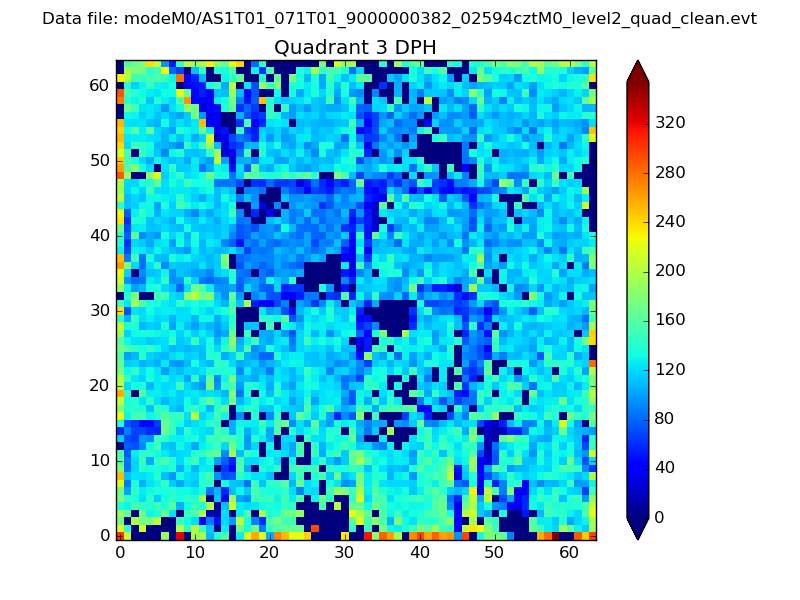 |
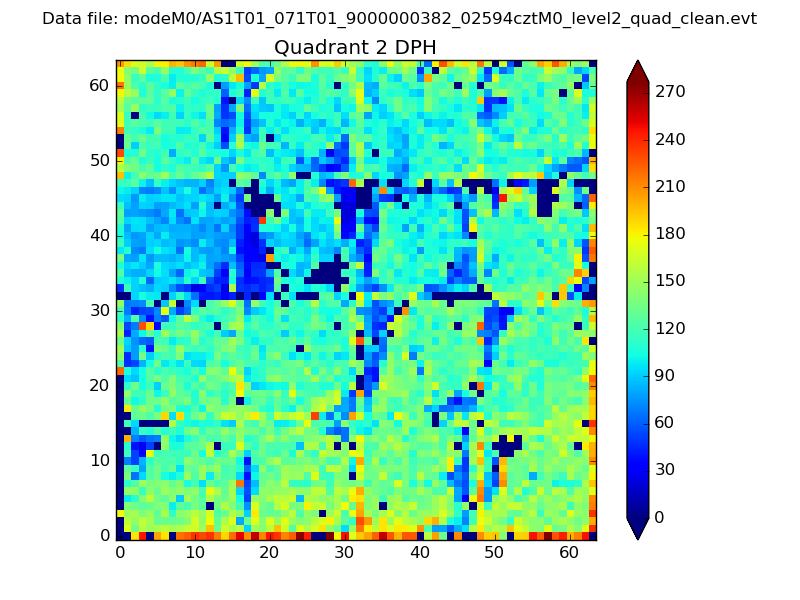 |
Quadrant C |
| Plot type | Count rate plots | Images |
|---|---|---|
| Comparison with Poisson distribution Blue bars denote a histogram of data divided into 1 sec bins. Red curve is a Poisson curve with rate = median count rate of data. |
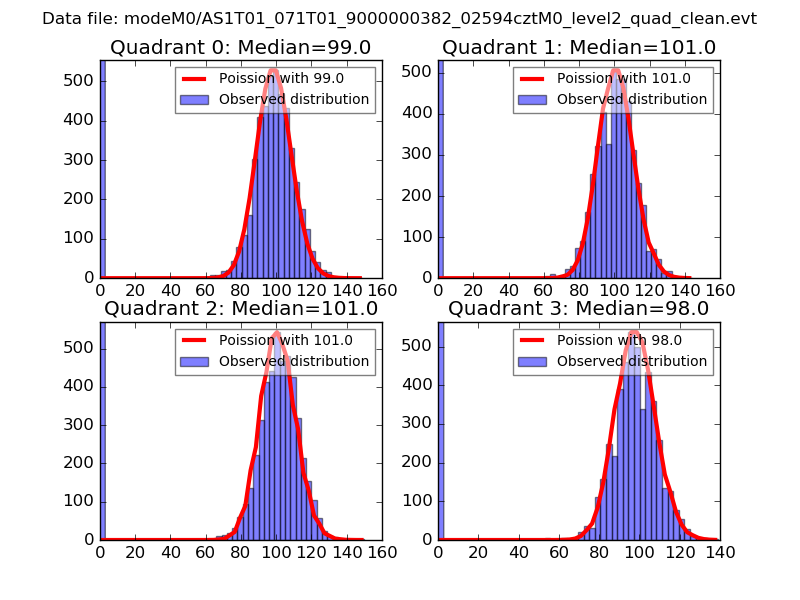 |
 |
| Quadrant-wise count rates Data is divided into 100 sec bins |
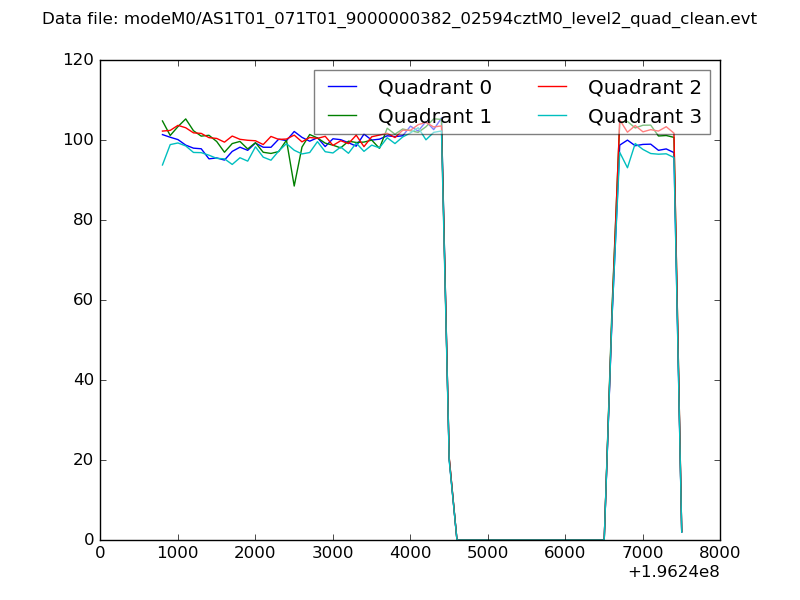 |
|
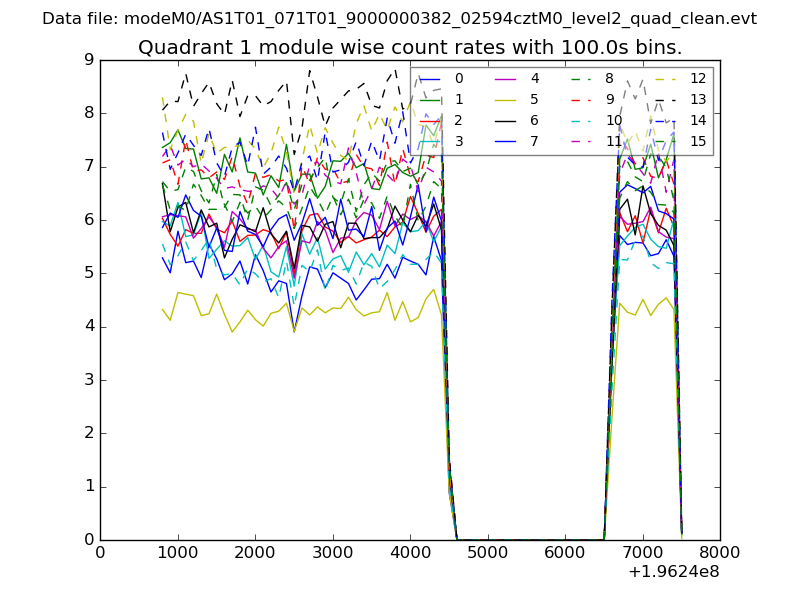
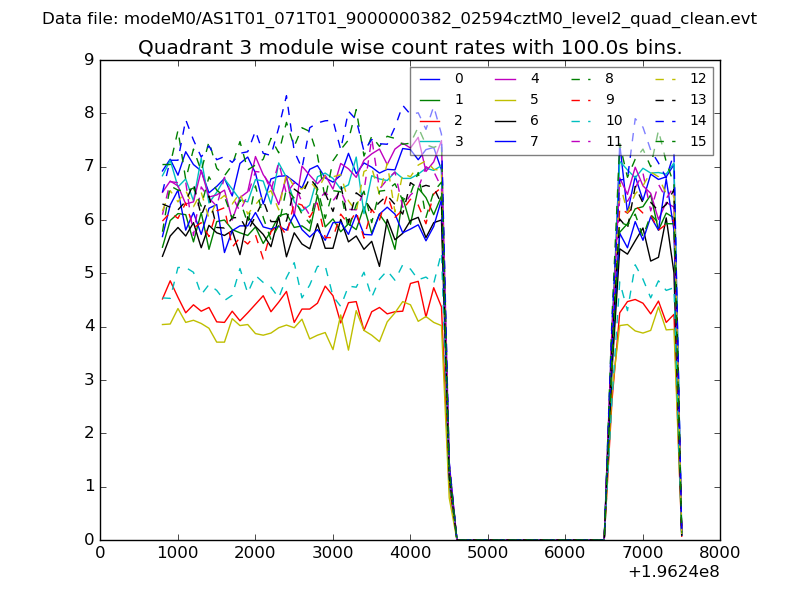
| Module-wise count rates for Quadrant A Data is divided into 100 sec bins |
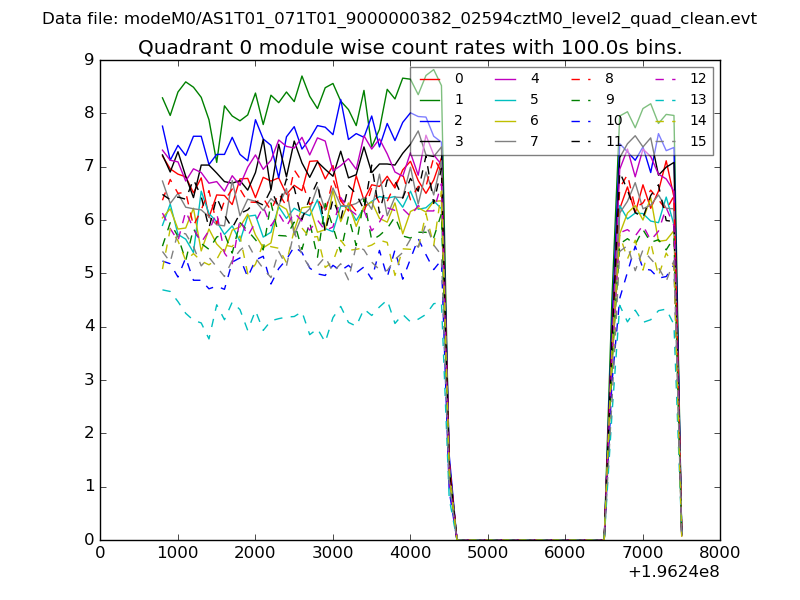 |
 |
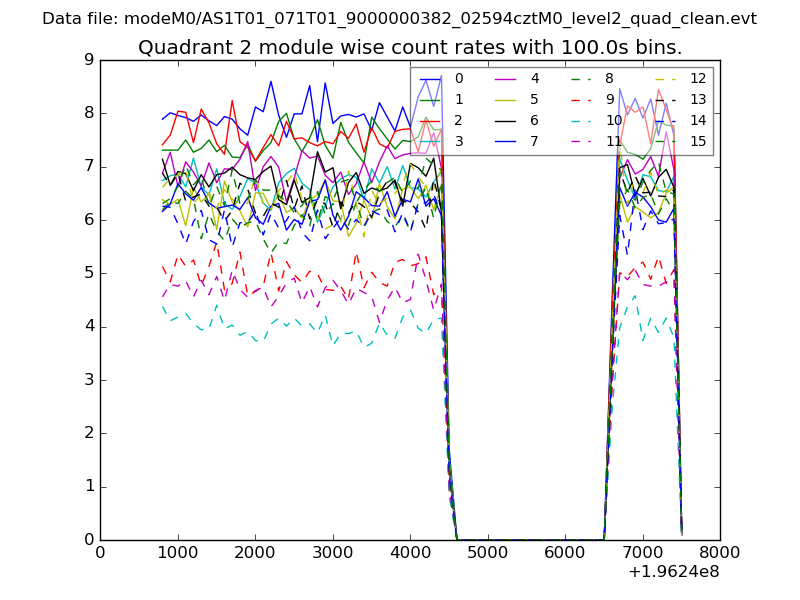
| Module-wise count rates for Quadrant B Data is divided into 100 sec bins |
 |
 |
| Module-wise count rates for Quadrant C Data is divided into 100 sec bins |
 |
 |
| Module-wise count rates for Quadrant D Data is divided into 100 sec bins |
 |
 |
| Parameter | Plot |
|---|---|
| CZT HV Monitor | 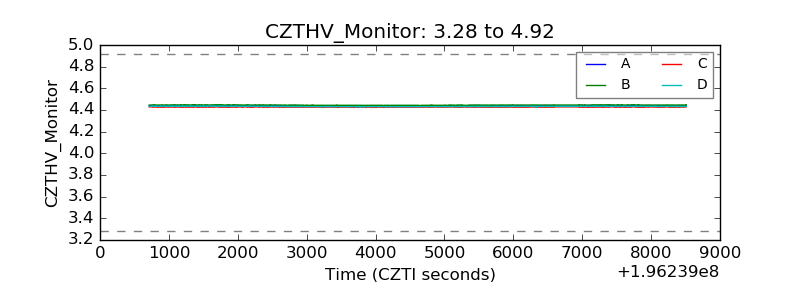 |
| D_VDD | 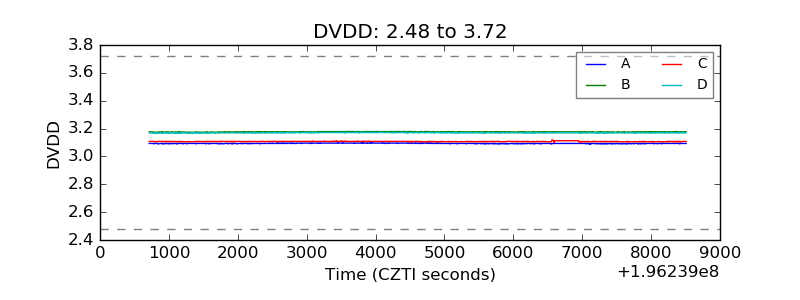 |
| Temperature 1 | 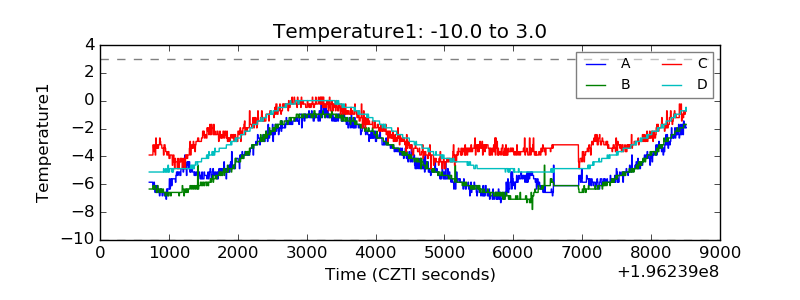 |
| Veto HV Monitor | 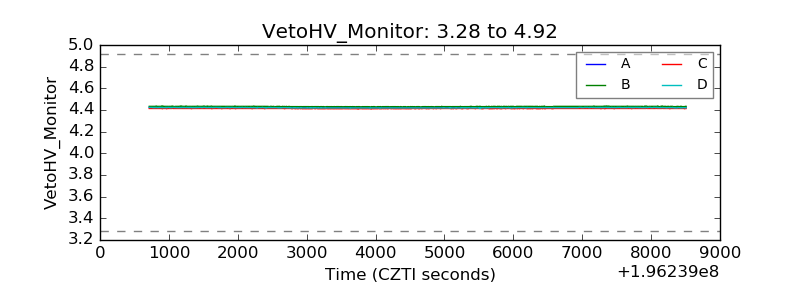 |
| Veto LLD | 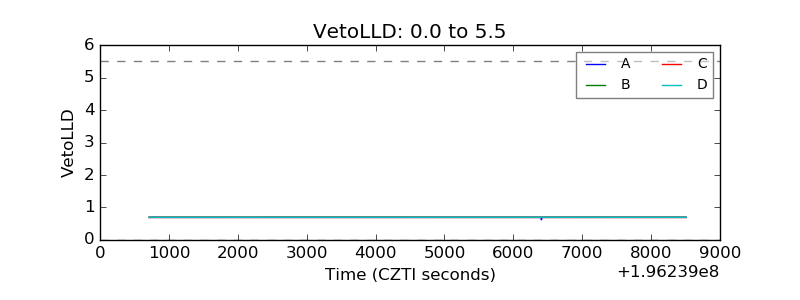 |
| Alpha Counter | 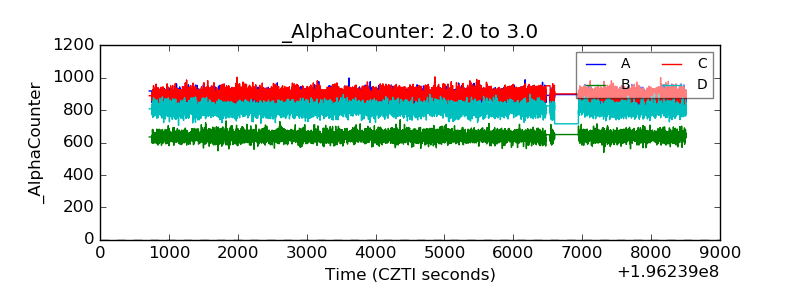 |
| _CPM_Rate | 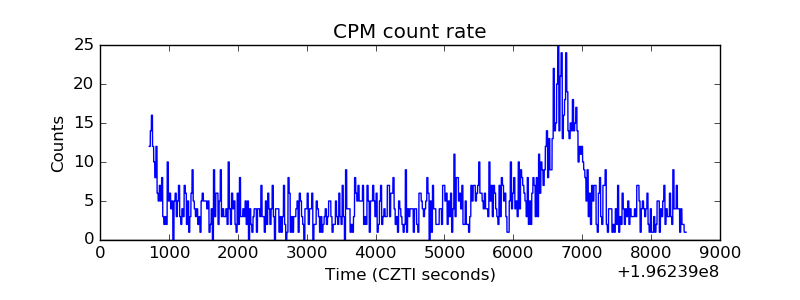 |
| CZT Counter | 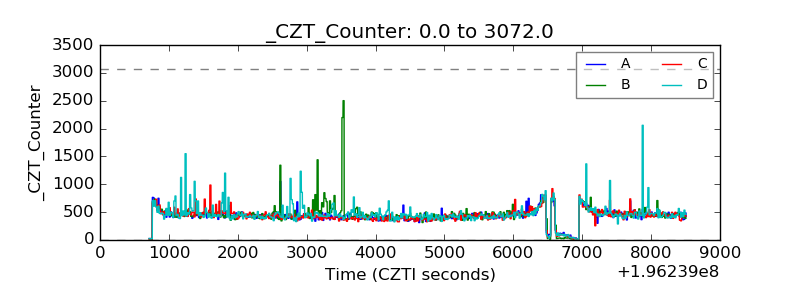 |
| +2.5 Volts monitor | 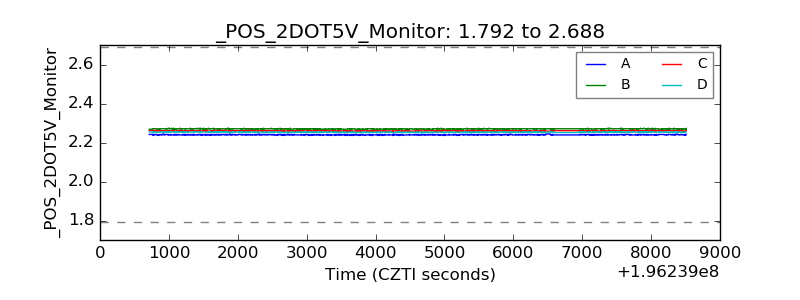 |
| +5 Volts monitor | 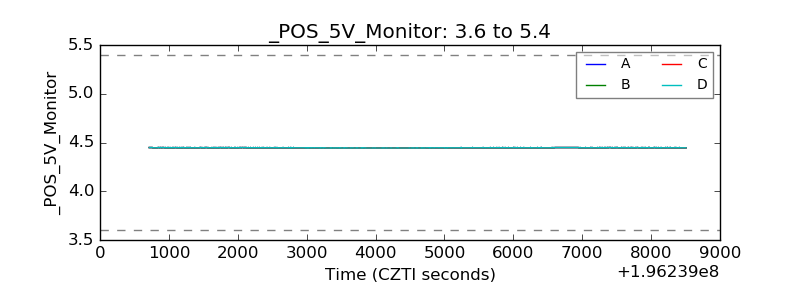 |
| _ROLL_ROT | 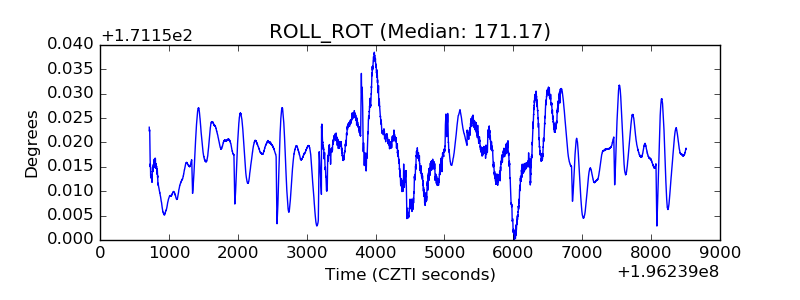 |
| _Roll_DEC | 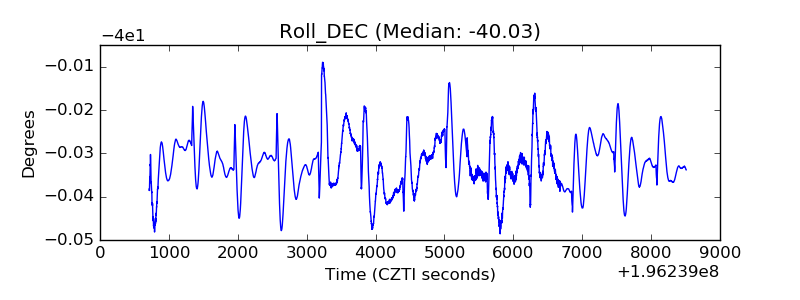 |
| _Roll_RA | 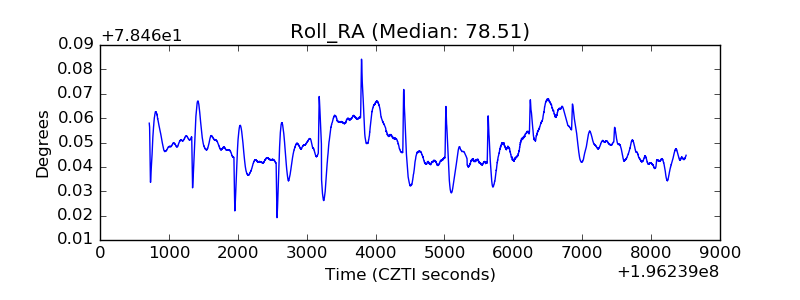 |
| Veto Counter | 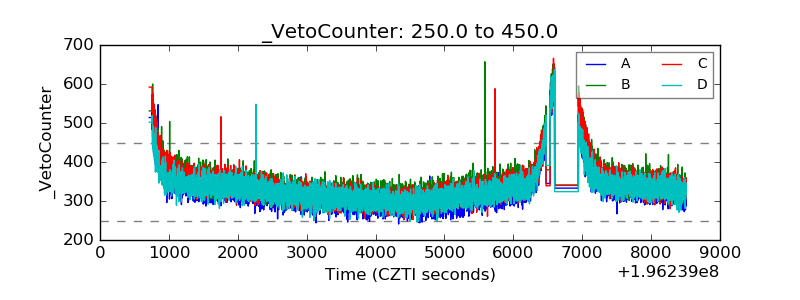 |