| Param | Original file | Final file |
|---|---|---|
| Filename | modeM0/AS1T01_071T01_9000000382_02595cztM0_level2.evt | modeM0/AS1T01_071T01_9000000382_02595cztM0_level2_quad_clean.evt |
| Size (bytes) | 452,482,560 | 82,103,040 |
| Size | 431.5 MB | 78.3 MB |
| Events in quadrant A | 3,243,755 | 495,319 |
| Events in quadrant B | 3,313,783 | 502,784 |
| Events in quadrant C | 3,224,004 | 505,168 |
| Events in quadrant D | 3,435,520 | 485,100 |
| Mode M0 | |||
|---|---|---|---|
| Quadrant | BADHDUFLAG | Total packets | Discarded packets |
| A | 0 | 14820 | 1 |
| B | 0 | 14912 | 0 |
| C | 0 | 14842 | 0 |
| D | 0 | 15341 | 0 |
| Mode SS | |||
|---|---|---|---|
| Quadrant | BADHDUFLAG | Total packets | Discarded packets |
| A | 0 | 142 | 0 |
| B | 0 | 142 | 0 |
| C | 0 | 142 | 0 |
| D | 0 | 142 | 0 |
| Quadrant | Total seconds | Saturated seconds | Saturation percentage |
|---|---|---|---|
| A | 7152 | 190 | 2.656600% |
| B | 7152 | 165 | 2.307047% |
| C | 7152 | 71 | 0.992729% |
| D | 7152 | 105 | 1.468121% |
Noise dominated data is calculated using 1-second bins in cleaned event files. If a bin has >2000 counts, and if more than 50% of those come from <1% of pixels, then it is considered to be noise-dominated and hence unusable.
| Quadrant | # 1 sec bins | Bins with >0 counts | Bins with >2000 counts | High rate bins dominated by noise | Noise dominated (total time) | Noise dominated (detector-on time) | Marked lightcurve |
|---|---|---|---|---|---|---|---|
| A | 7152 | 7152 | 0 | 0 | 0.00% | 0.00% |  |
| B | 7152 | 7152 | 3 | 3 | 0.04% | 0.04% |  |
| C | 7152 | 7152 | 2 | 2 | 0.03% | 0.03% |  |
| D | 7152 | 7152 | 13 | 13 | 0.18% | 0.18% |  |
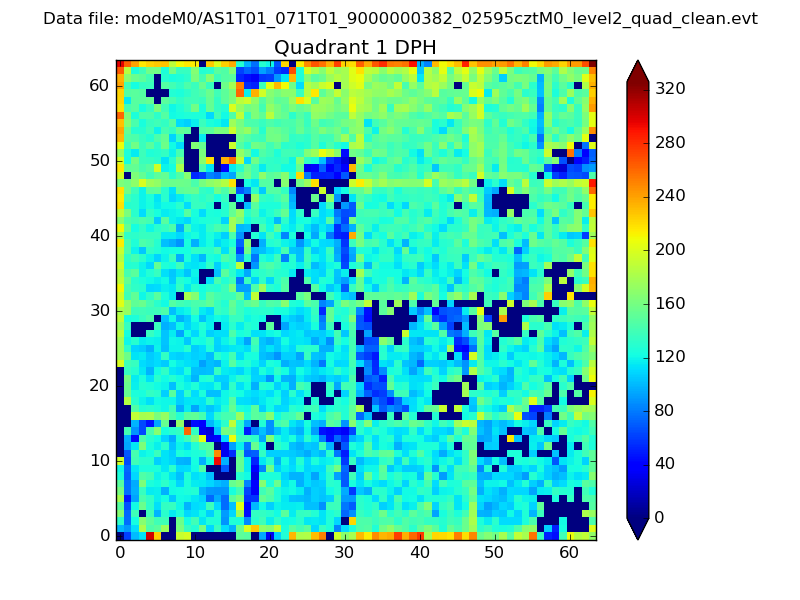
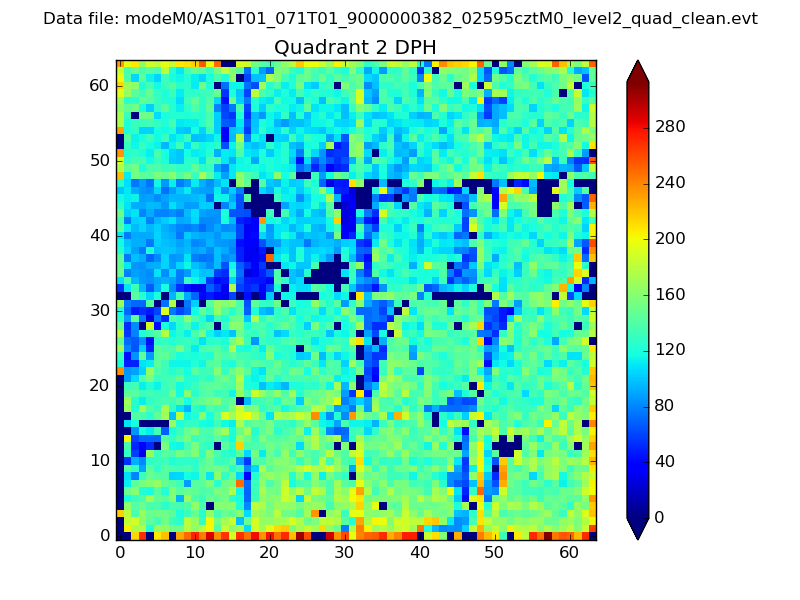
Top three noisy pixels from each quadrant. If the there are fewer than three noisy pixels in the level2.evt file, extra rows are filled as -1
| Pixel properties | Quadrant properties | ||||||
|---|---|---|---|---|---|---|---|
| Quadrant | DetID | PixID | Counts | Sigma | Mean | Median | Sigma |
| A | 3 | 1 | 26026 | 145.79 | 834 | 812 | 172.9 |
| A | 12 | 194 | 9324 | 49.22 | 834 | 812 | 172.9 |
| A | 0 | 226 | 8973 | 47.19 | 834 | 812 | 172.9 |
| B | 15 | 54 | 14862 | 84.98 | 845 | 820 | 165.2 |
| B | 12 | 111 | 11698 | 65.83 | 845 | 820 | 165.2 |
| B | 0 | 171 | 11500 | 64.63 | 845 | 820 | 165.2 |
| C | 10 | 65 | 24562 | 126.03 | 811 | 813 | 188.4 |
| C | 12 | 4 | 16489 | 83.19 | 811 | 813 | 188.4 |
| C | 13 | 61 | 7250 | 34.16 | 811 | 813 | 188.4 |
| D | 2 | 136 | 107975 | 554.48 | 806 | 783 | 193.3 |
| D | 2 | 54 | 93060 | 477.33 | 806 | 783 | 193.3 |
| D | 2 | 184 | 74331 | 380.45 | 806 | 783 | 193.3 |
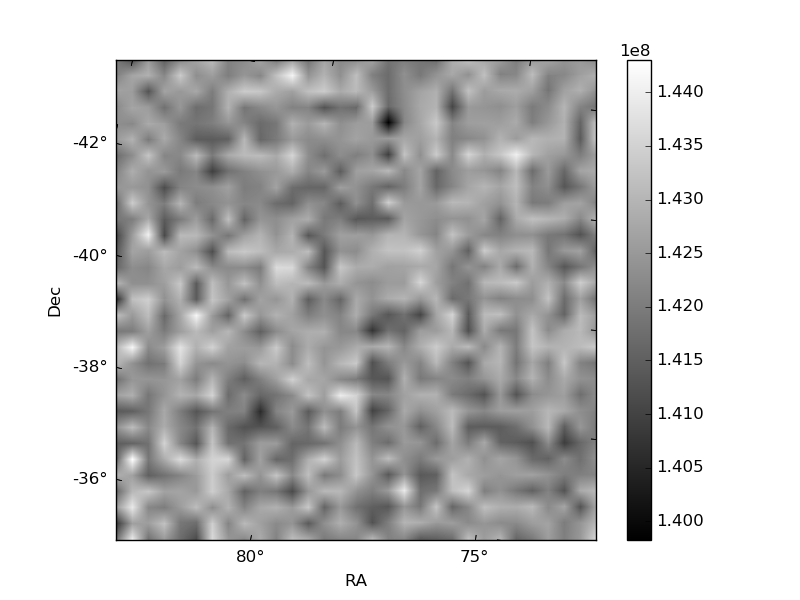
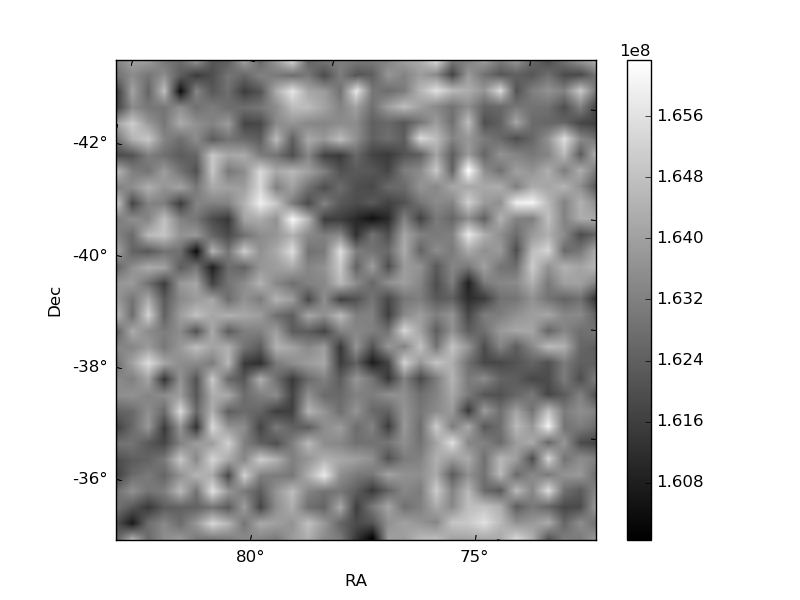
Histogram calculated using DETX and DETY for each event in the final _common_clean file
| Quadrant A | 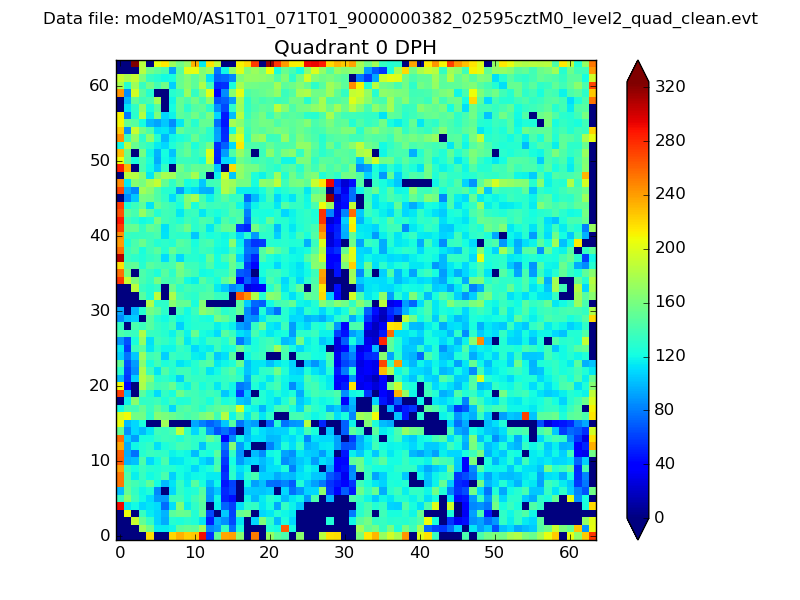 |
 |
Quadrant B |
|---|---|---|---|
| Quadrant D | 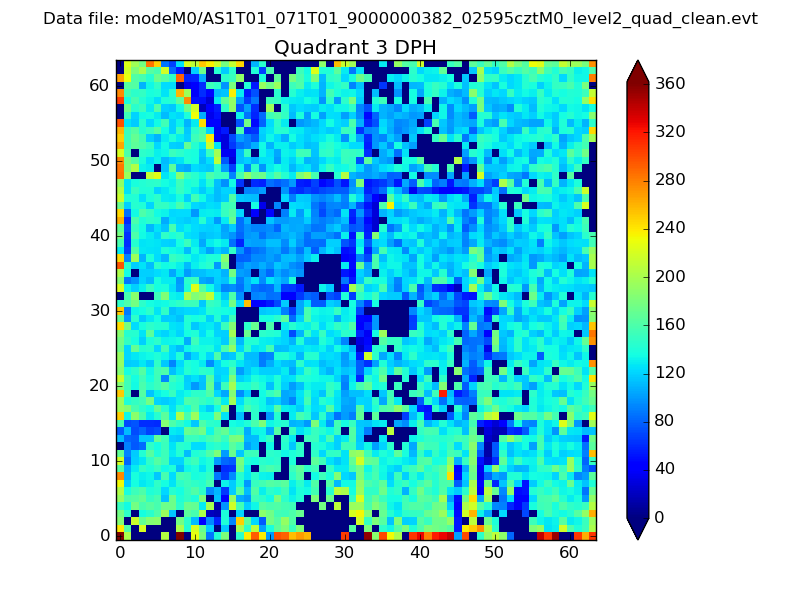 |
 |
Quadrant C |
| Plot type | Count rate plots | Images |
|---|---|---|
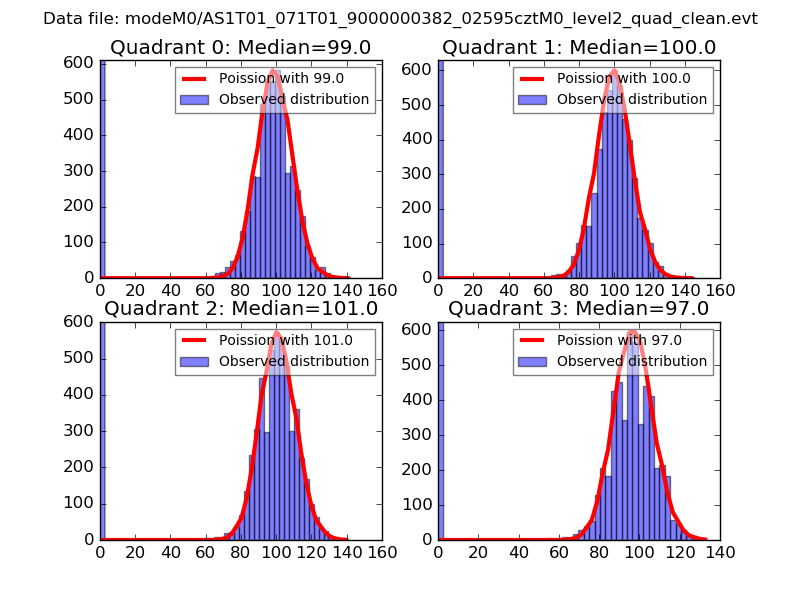
| Comparison with Poisson distribution Blue bars denote a histogram of data divided into 1 sec bins. Red curve is a Poisson curve with rate = median count rate of data. |
 |
 |
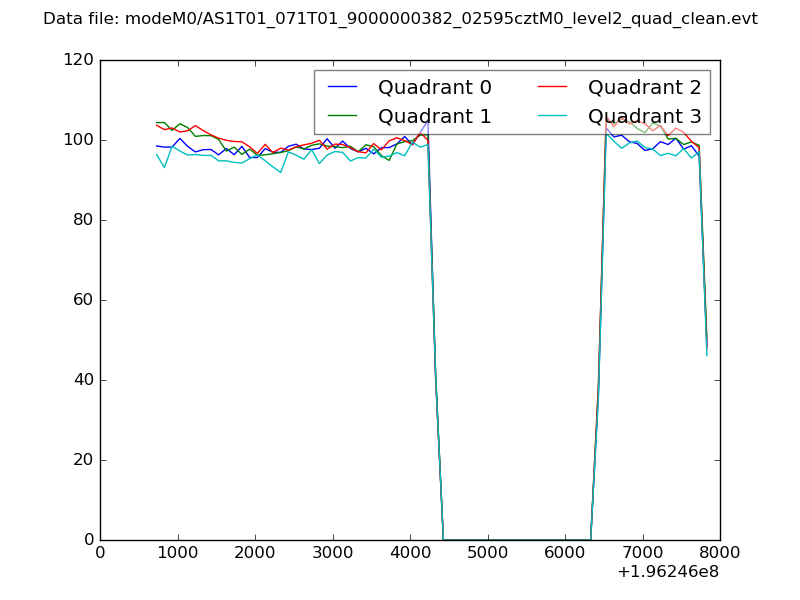
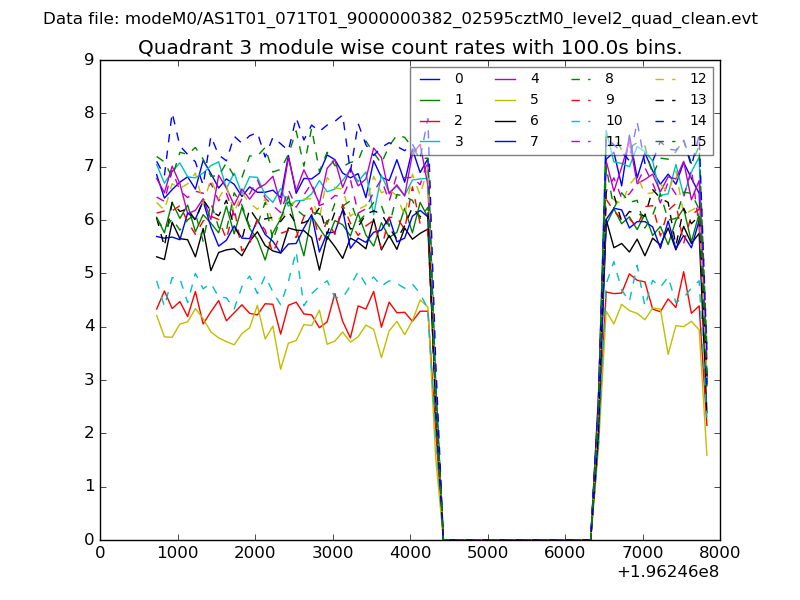
| Quadrant-wise count rates Data is divided into 100 sec bins |
 |
|
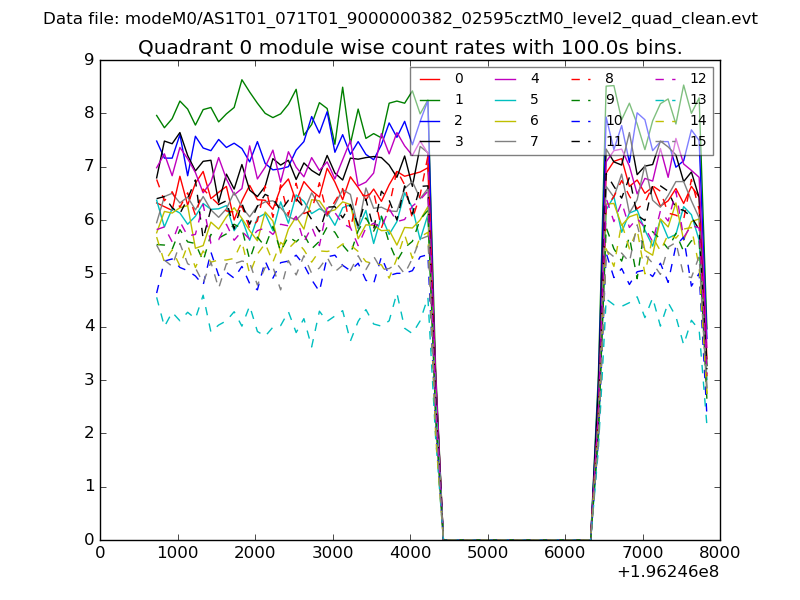
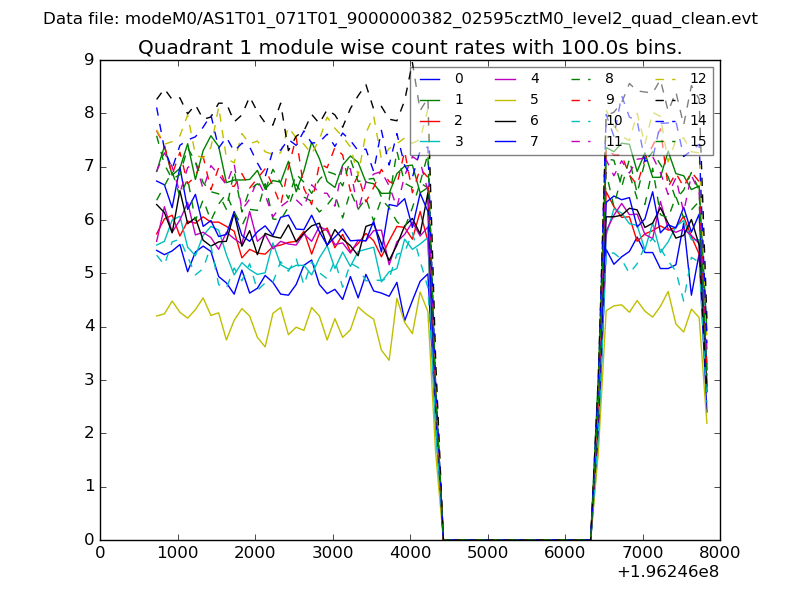
| Module-wise count rates for Quadrant A Data is divided into 100 sec bins |
 |
 |
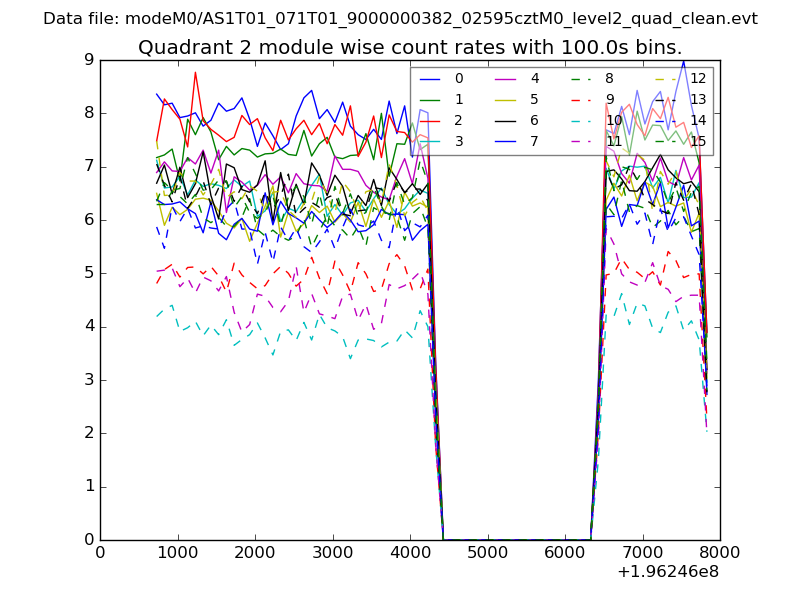
| Module-wise count rates for Quadrant B Data is divided into 100 sec bins |
 |
 |
| Module-wise count rates for Quadrant C Data is divided into 100 sec bins |
 |
 |
| Module-wise count rates for Quadrant D Data is divided into 100 sec bins |
 |
 |
| Parameter | Plot |
|---|---|
| CZT HV Monitor | 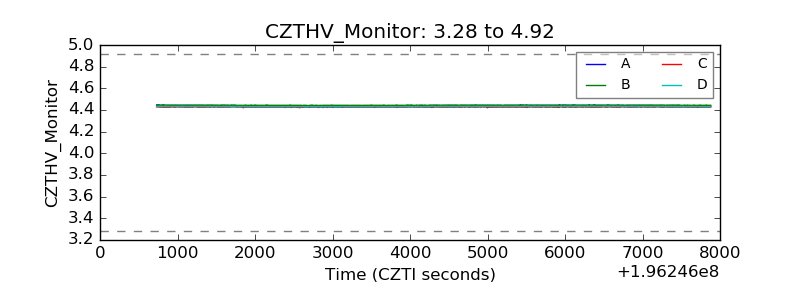 |
| D_VDD | 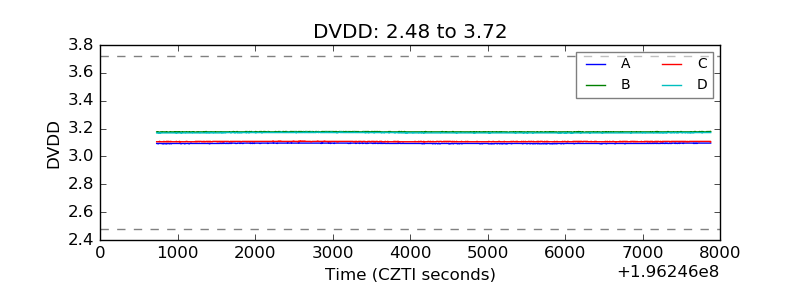 |
| Temperature 1 | 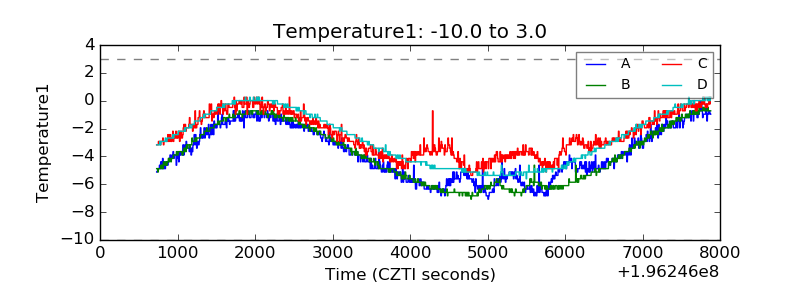 |
| Veto HV Monitor | 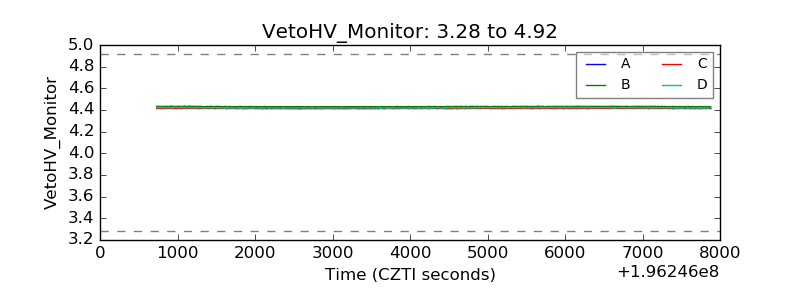 |
| Veto LLD | 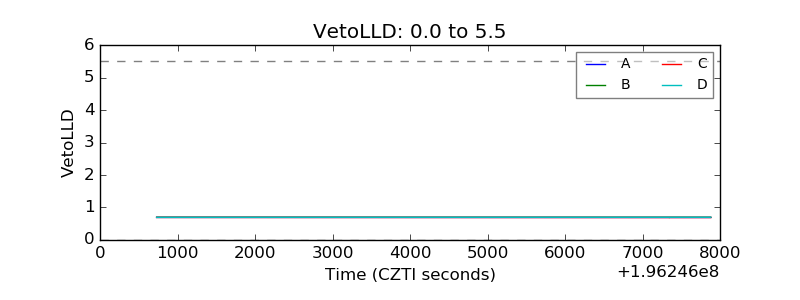 |
| Alpha Counter | 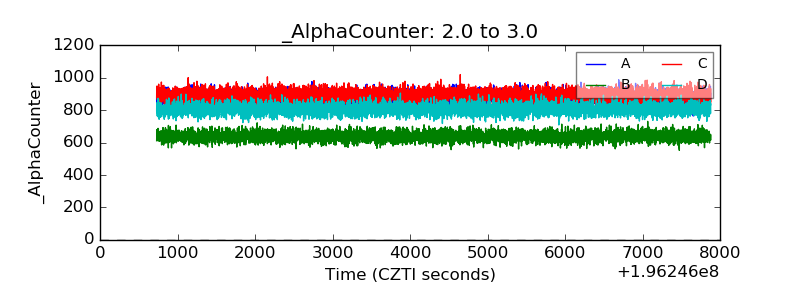 |
| _CPM_Rate | 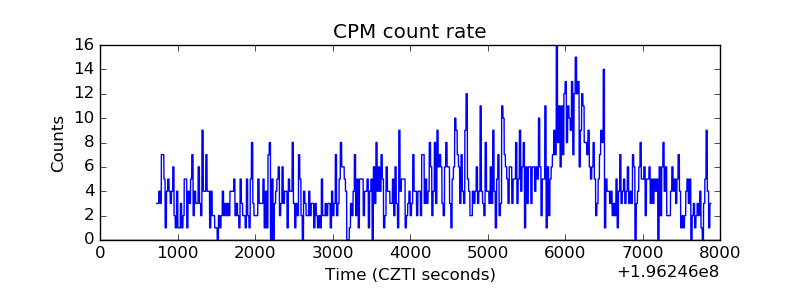 |
| CZT Counter | 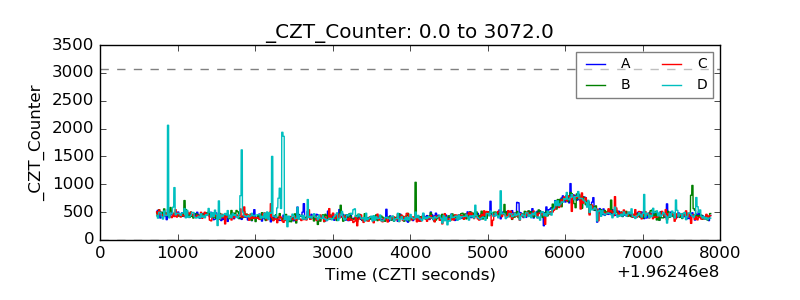 |
| +2.5 Volts monitor |  |
| +5 Volts monitor | 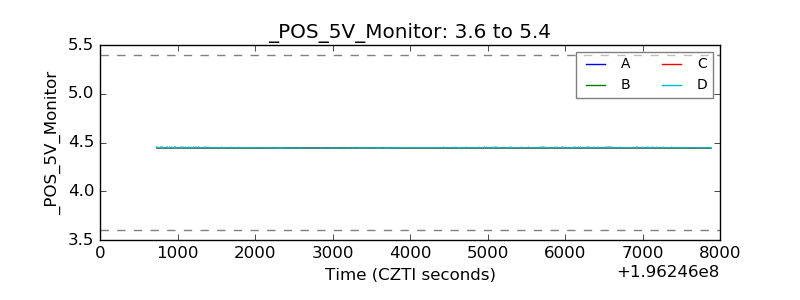 |
| _ROLL_ROT | 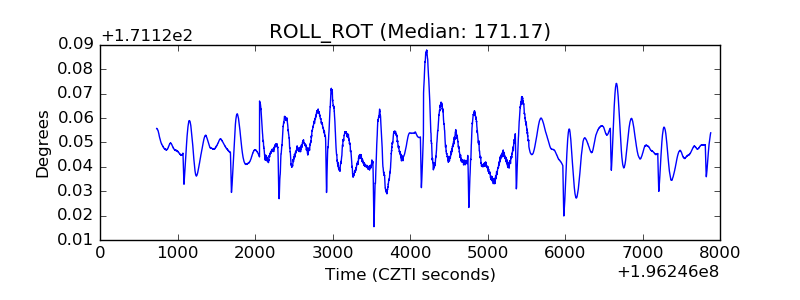 |
| _Roll_DEC | 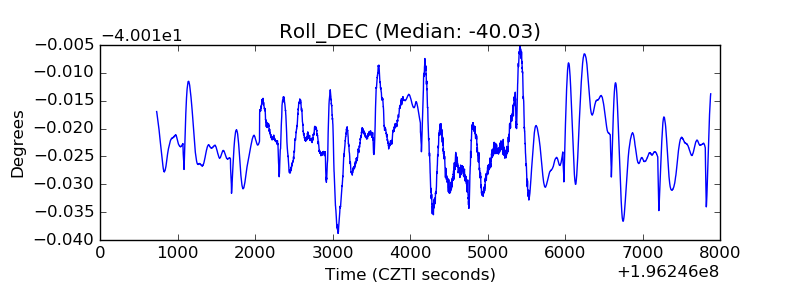 |
| _Roll_RA | 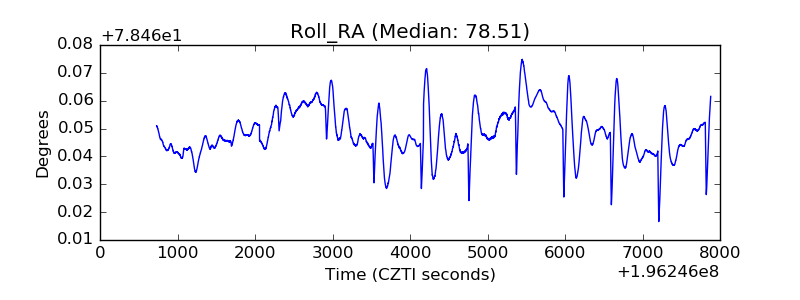 |
| Veto Counter | 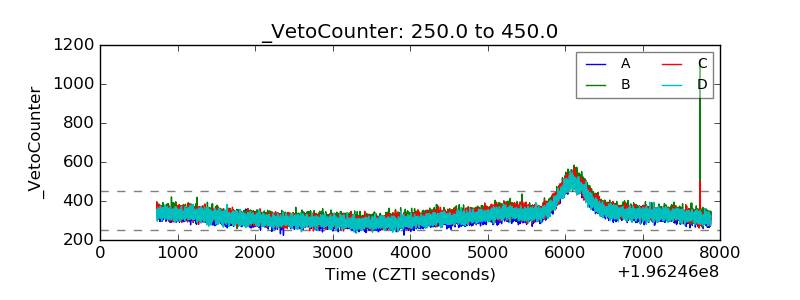 |