| Param | Original file | Final file |
|---|---|---|
| Filename | modeM0/AS1T01_071T01_9000000382_02600cztM0_level2.evt | modeM0/AS1T01_071T01_9000000382_02600cztM0_level2_quad_clean.evt |
| Size (bytes) | 825,624,000 | 145,984,320 |
| Size | 787.4 MB | 139.2 MB |
| Events in quadrant A | 5,707,683 | 876,267 |
| Events in quadrant B | 6,099,698 | 888,477 |
| Events in quadrant C | 5,754,095 | 886,961 |
| Events in quadrant D | 6,551,162 | 860,778 |
| Mode M9 | |||
|---|---|---|---|
| Quadrant | BADHDUFLAG | Total packets | Discarded packets |
| A | 0 | 10 | 0 |
| B | 0 | 10 | 0 |
| C | 0 | 10 | 0 |
| D | 0 | 10 | 0 |
| Mode M0 | |||
|---|---|---|---|
| Quadrant | BADHDUFLAG | Total packets | Discarded packets |
| A | 0 | 26663 | 2 |
| B | 0 | 27372 | 2 |
| C | 0 | 26929 | 2 |
| D | 0 | 28865 | 2 |
| Mode SS | |||
|---|---|---|---|
| Quadrant | BADHDUFLAG | Total packets | Discarded packets |
| A | 0 | 268 | 0 |
| B | 0 | 268 | 0 |
| C | 0 | 268 | 0 |
| D | 0 | 268 | 0 |
| Quadrant | Total seconds | Saturated seconds | Saturation percentage |
|---|---|---|---|
| A | 13146 | 60 | 0.456413% |
| B | 13146 | 70 | 0.532481% |
| C | 13146 | 53 | 0.403164% |
| D | 13146 | 118 | 0.897611% |
Noise dominated data is calculated using 1-second bins in cleaned event files. If a bin has >2000 counts, and if more than 50% of those come from <1% of pixels, then it is considered to be noise-dominated and hence unusable.
| Quadrant | # 1 sec bins | Bins with >0 counts | Bins with >2000 counts | High rate bins dominated by noise | Noise dominated (total time) | Noise dominated (detector-on time) | Marked lightcurve |
|---|---|---|---|---|---|---|---|
| A | 14211 | 13148 | 0 | 0 | 0.00% | 0.00% | 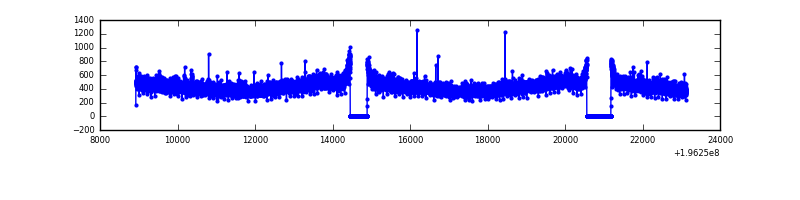 |
| B | 14211 | 13148 | 6 | 6 | 0.04% | 0.05% | 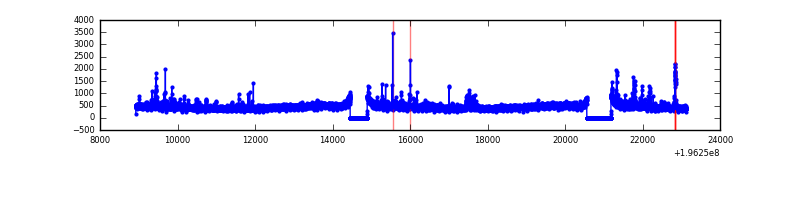 |
| C | 14211 | 13148 | 22 | 22 | 0.15% | 0.17% | 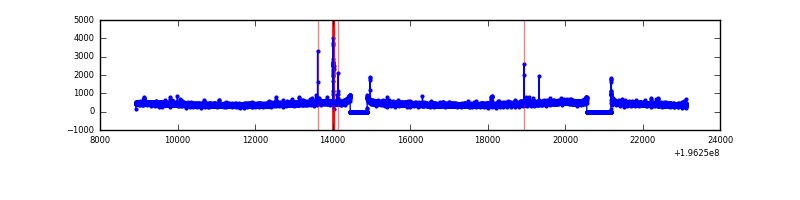 |
| D | 14211 | 13148 | 66 | 66 | 0.46% | 0.50% | 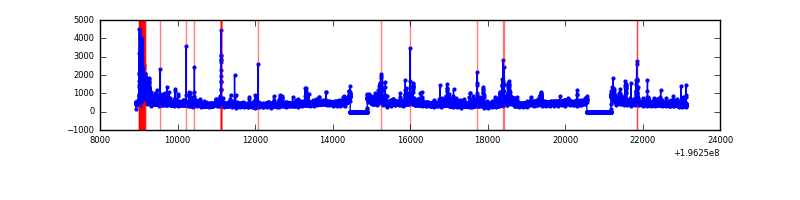 |
Top three noisy pixels from each quadrant. If the there are fewer than three noisy pixels in the level2.evt file, extra rows are filled as -1
| Pixel properties | Quadrant properties | ||||||
|---|---|---|---|---|---|---|---|
| Quadrant | DetID | PixID | Counts | Sigma | Mean | Median | Sigma |
| A | 12 | 194 | 16519 | 49.71 | 1476 | 1440 | 303.3 |
| A | 0 | 226 | 15863 | 47.55 | 1476 | 1440 | 303.3 |
| A | 3 | 1 | 12645 | 36.94 | 1476 | 1440 | 303.3 |
| B | 6 | 36 | 102308 | 348.1 | 1498 | 1463 | 289.7 |
| B | 14 | 167 | 52591 | 176.49 | 1498 | 1463 | 289.7 |
| B | 0 | 171 | 43905 | 146.5 | 1498 | 1463 | 289.7 |
| C | 14 | 223 | 73724 | 218.09 | 1423 | 1428 | 331.5 |
| C | 8 | 112 | 28541 | 81.79 | 1423 | 1428 | 331.5 |
| C | 10 | 65 | 26671 | 76.15 | 1423 | 1428 | 331.5 |
| D | 1 | 83 | 385408 | 1145.98 | 1412 | 1376 | 335.1 |
| D | 2 | 54 | 227615 | 675.12 | 1412 | 1376 | 335.1 |
| D | 13 | 169 | 222703 | 660.46 | 1412 | 1376 | 335.1 |
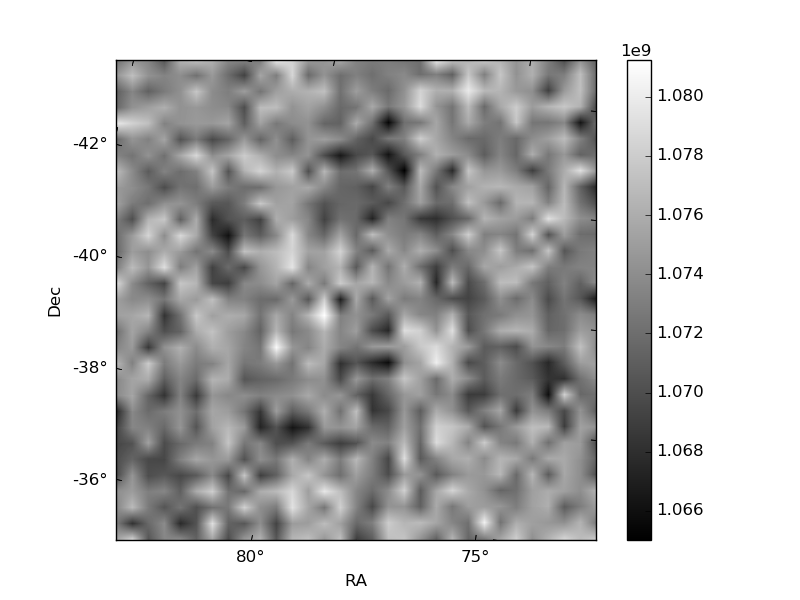
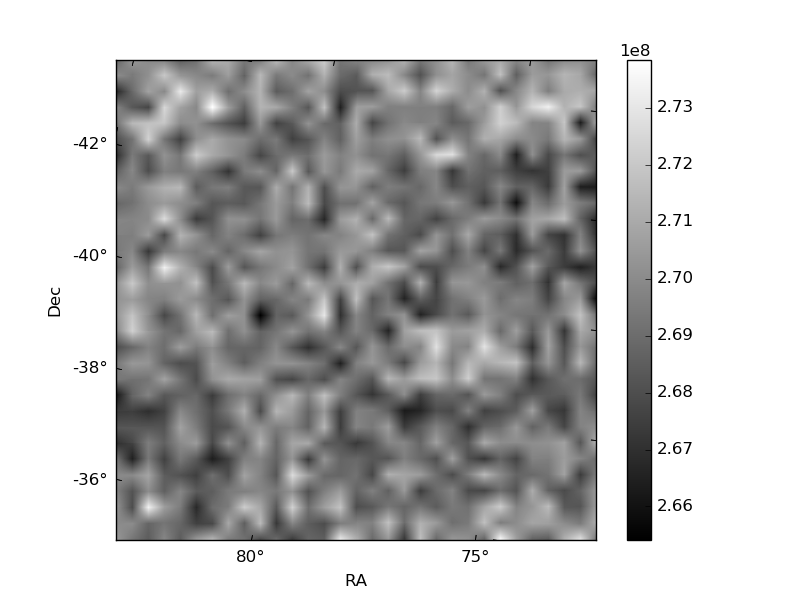
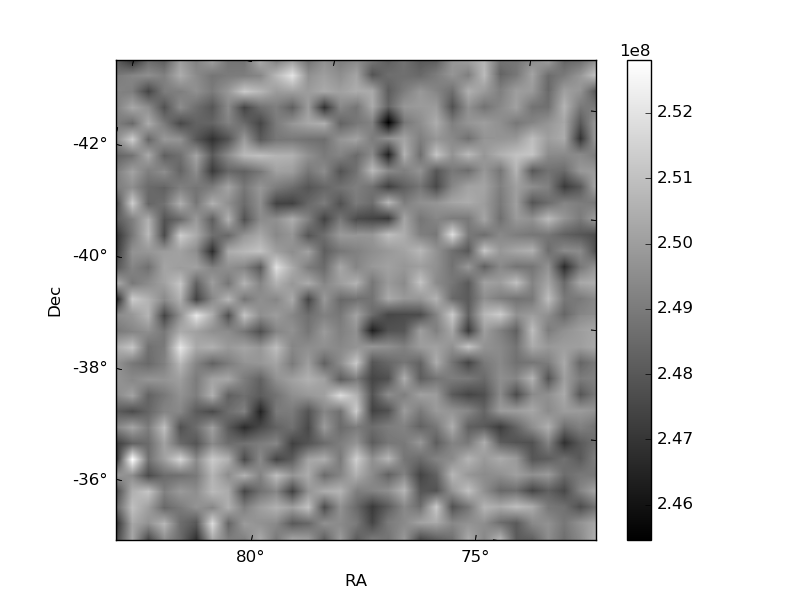
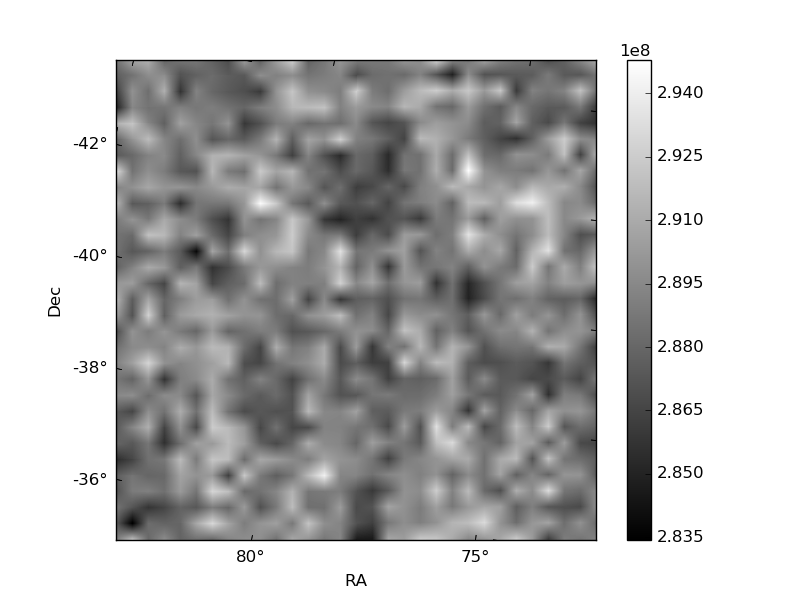
Histogram calculated using DETX and DETY for each event in the final _common_clean file
| Quadrant A | 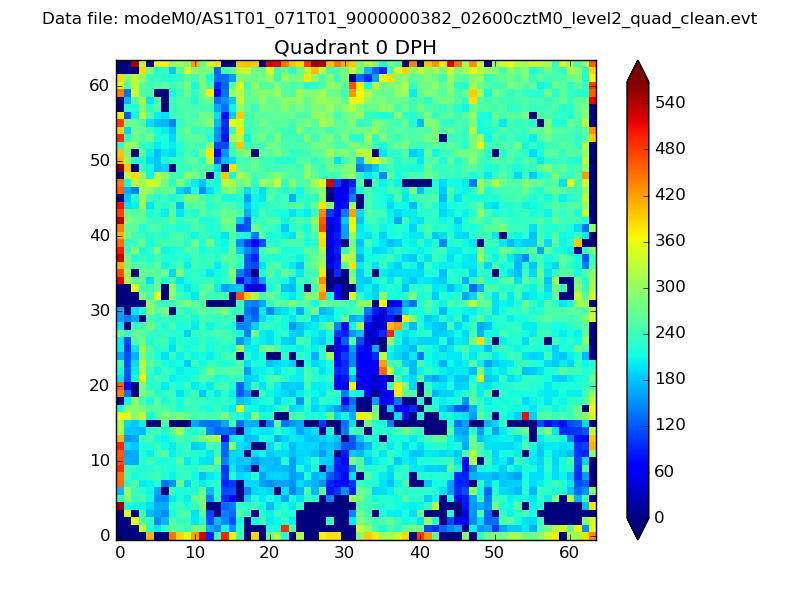 |
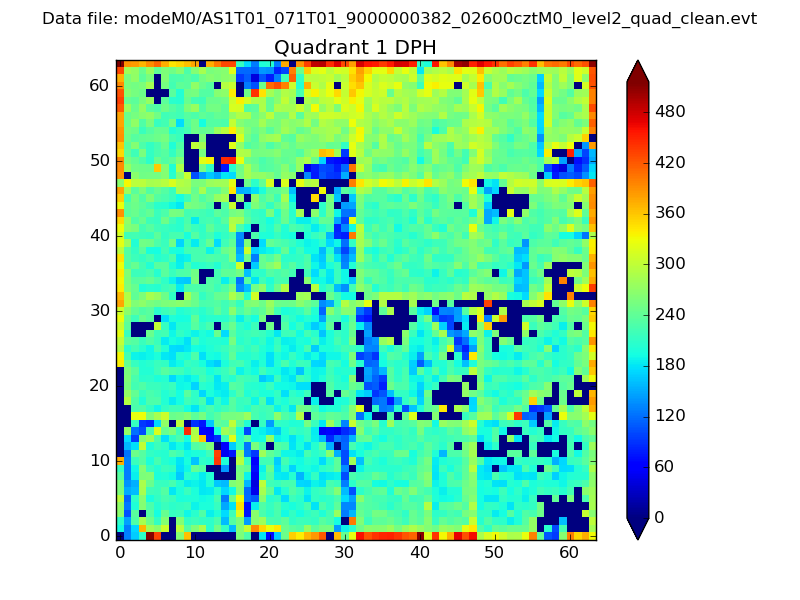 |
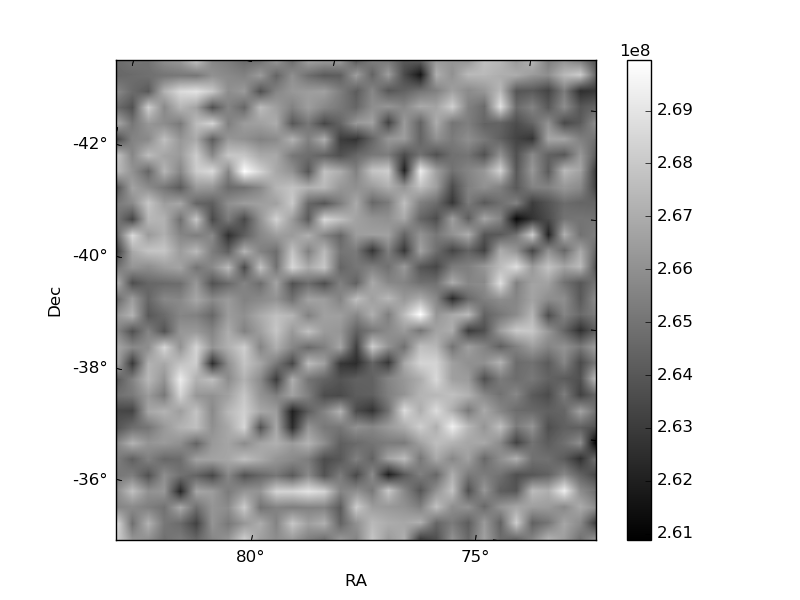
Quadrant B |
|---|---|---|---|
| Quadrant D | 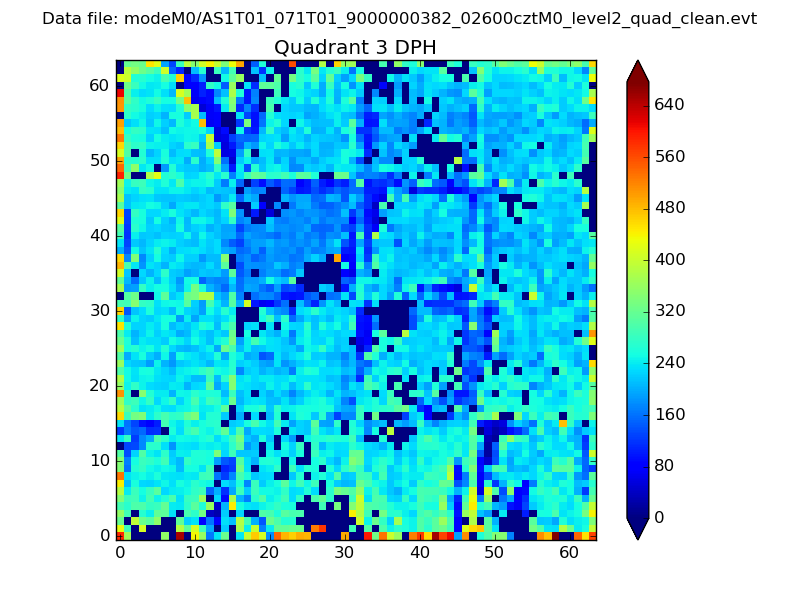 |
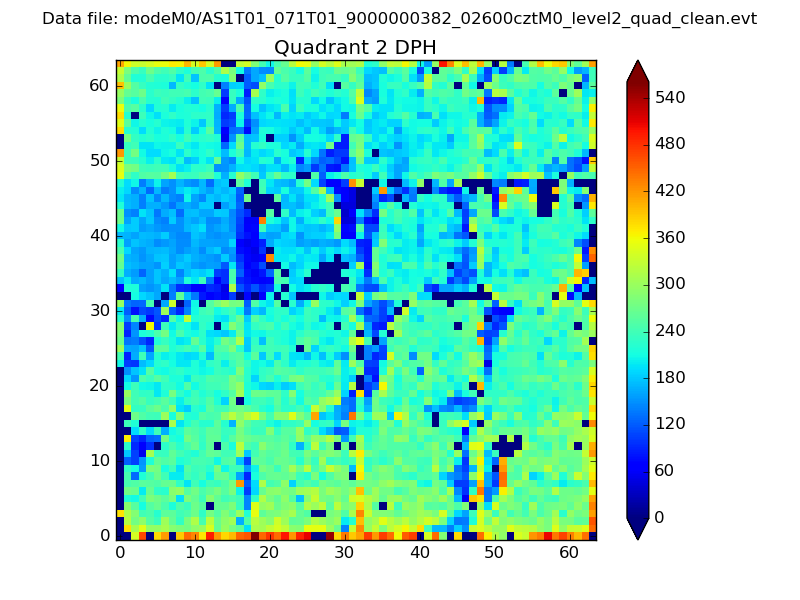 |
Quadrant C |
| Plot type | Count rate plots | Images |
|---|---|---|
| Comparison with Poisson distribution Blue bars denote a histogram of data divided into 1 sec bins. Red curve is a Poisson curve with rate = median count rate of data. |
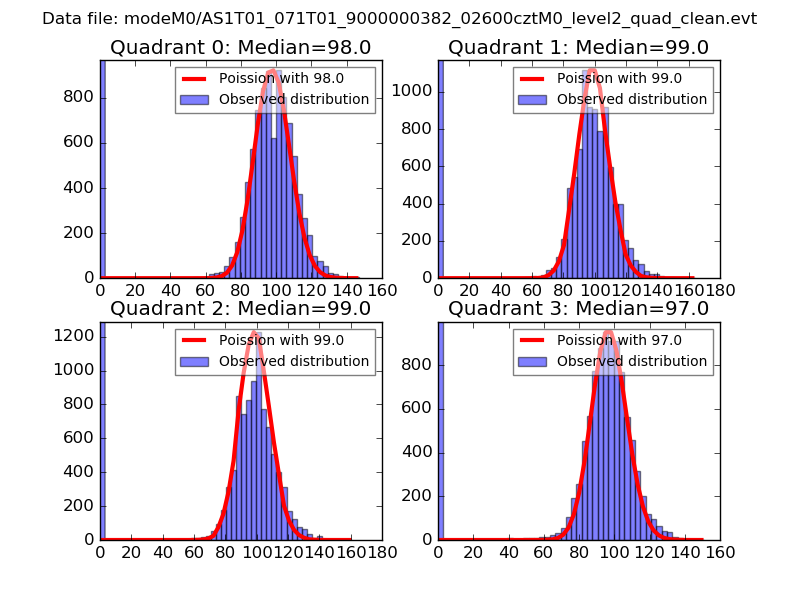 |
 |
| Quadrant-wise count rates Data is divided into 100 sec bins |
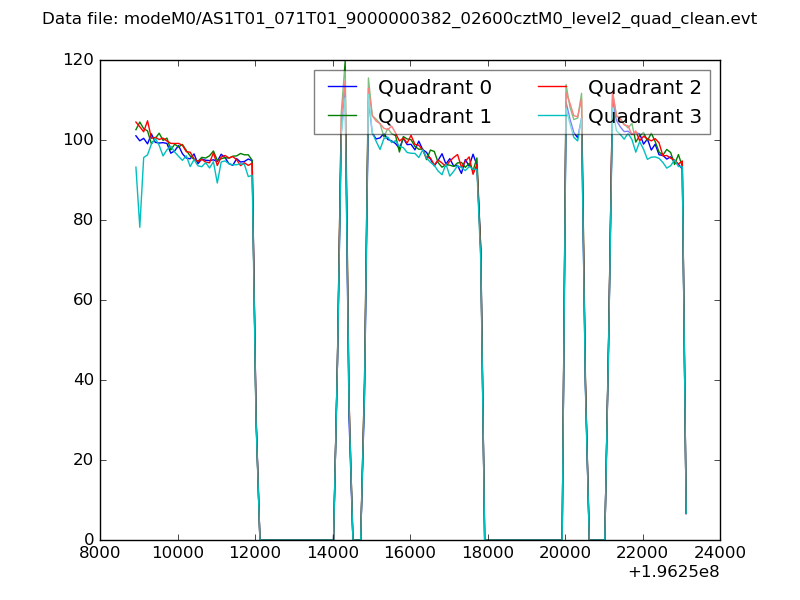 |
|
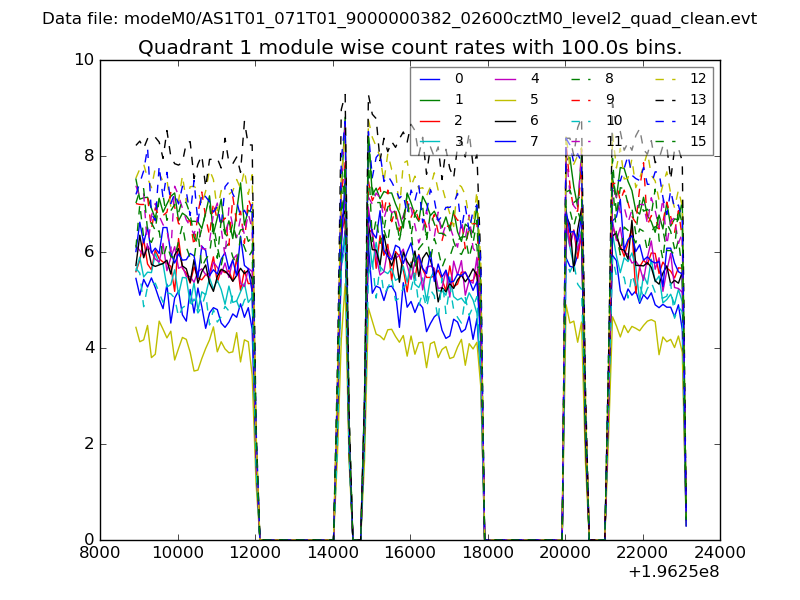
| Module-wise count rates for Quadrant A Data is divided into 100 sec bins |
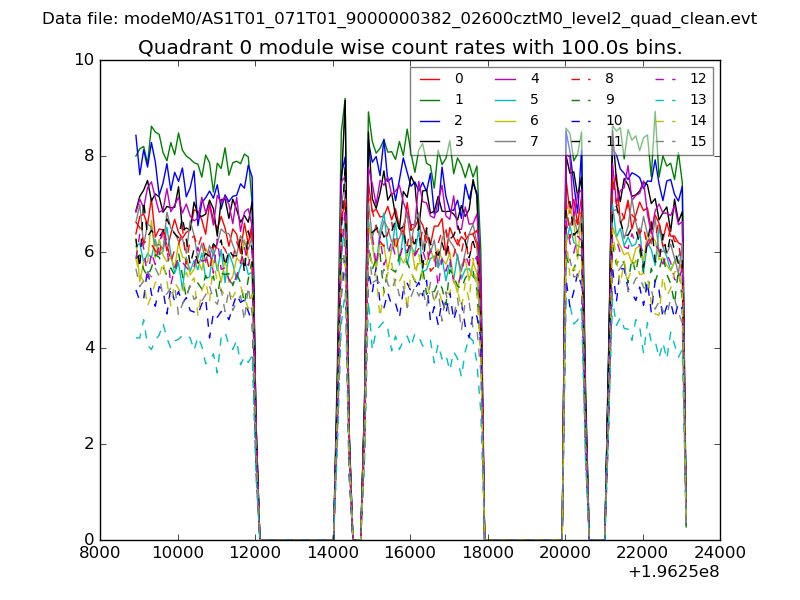 |
 |
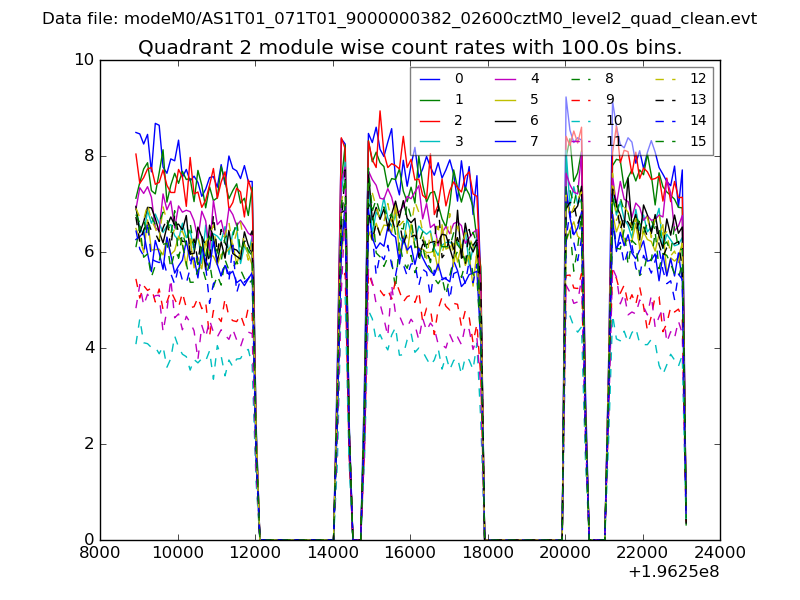
| Module-wise count rates for Quadrant B Data is divided into 100 sec bins |
 |
 |
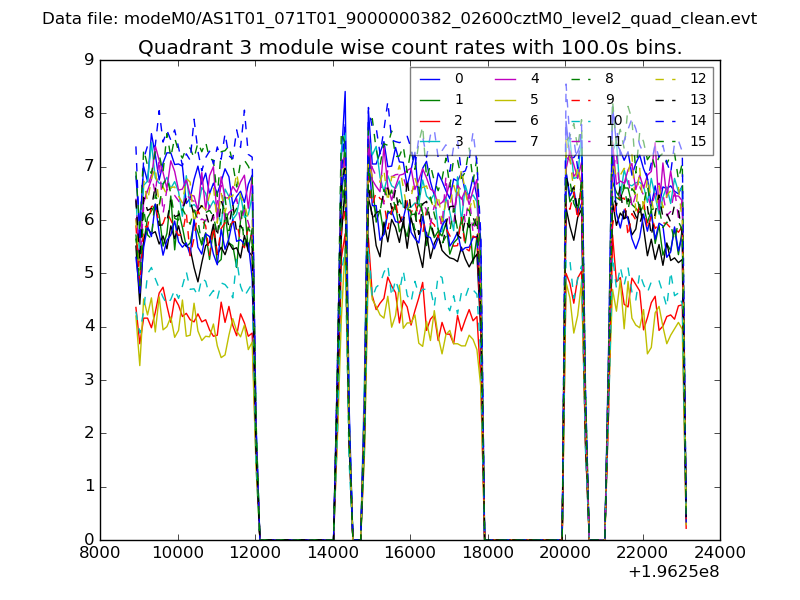
| Module-wise count rates for Quadrant C Data is divided into 100 sec bins |
 |
 |
| Module-wise count rates for Quadrant D Data is divided into 100 sec bins |
 |
 |
| Parameter | Plot |
|---|---|
| CZT HV Monitor | 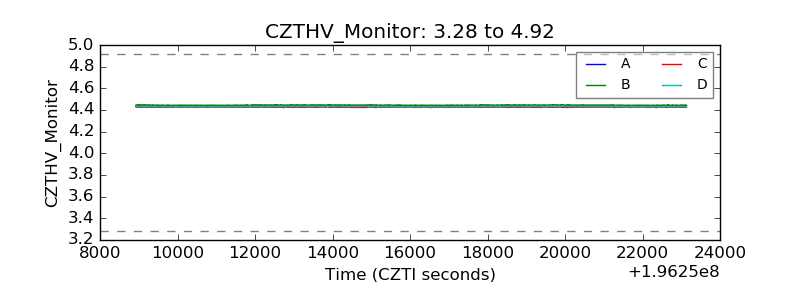 |
| D_VDD | 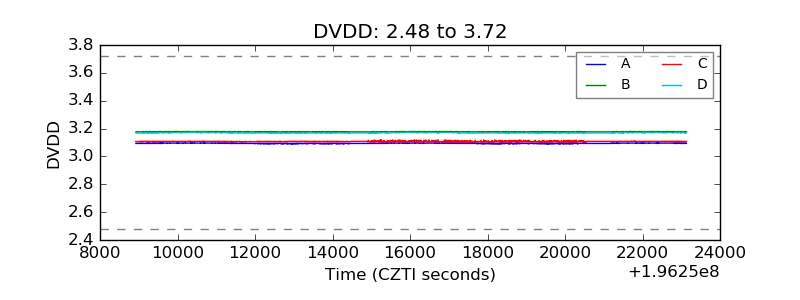 |
| Temperature 1 | 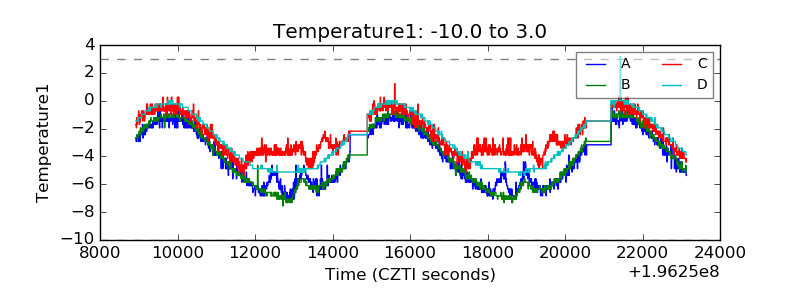 |
| Veto HV Monitor | 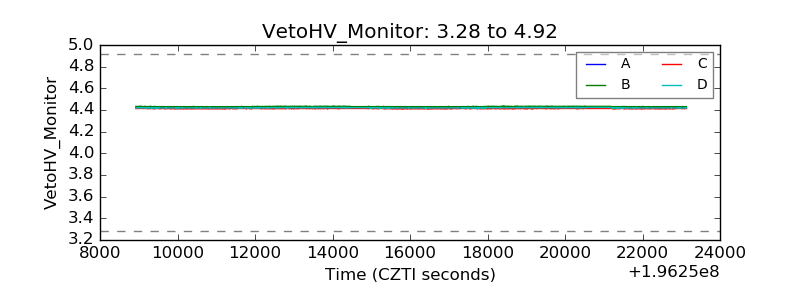 |
| Veto LLD | 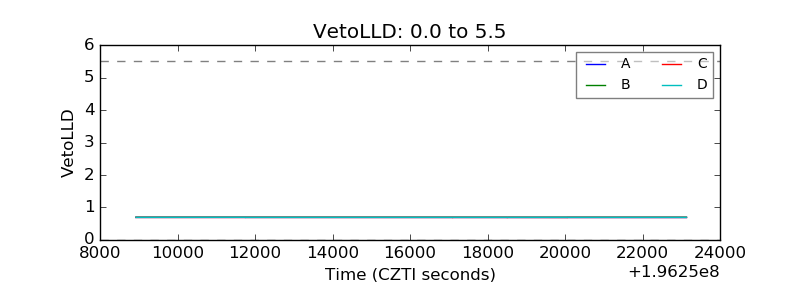 |
| Alpha Counter | 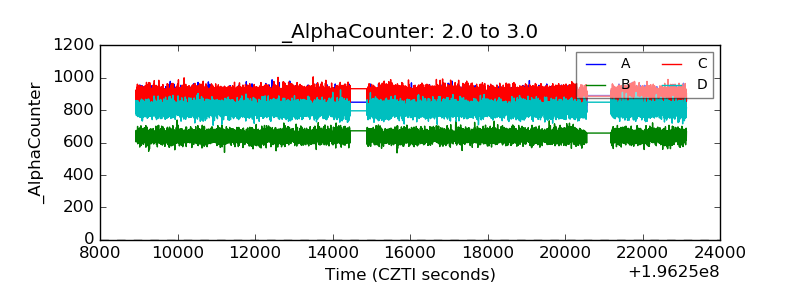 |
| _CPM_Rate | 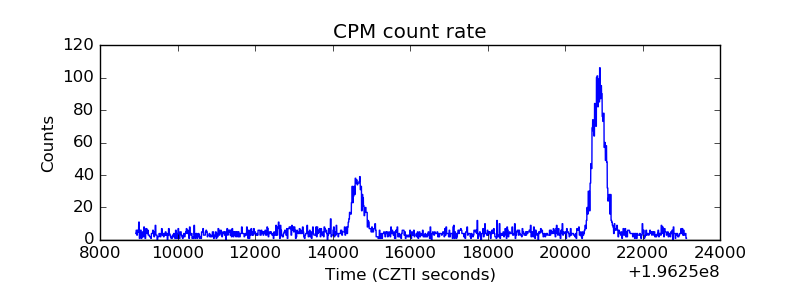 |
| CZT Counter | 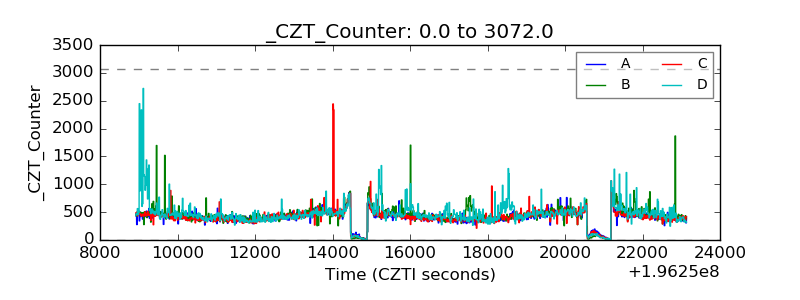 |
| +2.5 Volts monitor | 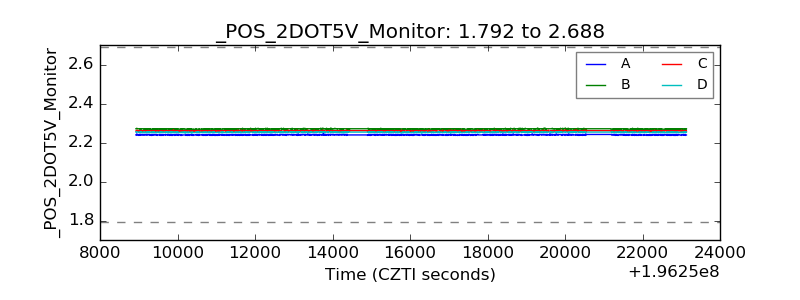 |
| +5 Volts monitor | 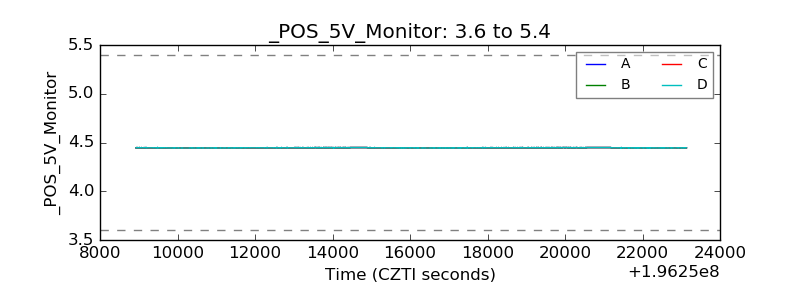 |
| Veto Counter | 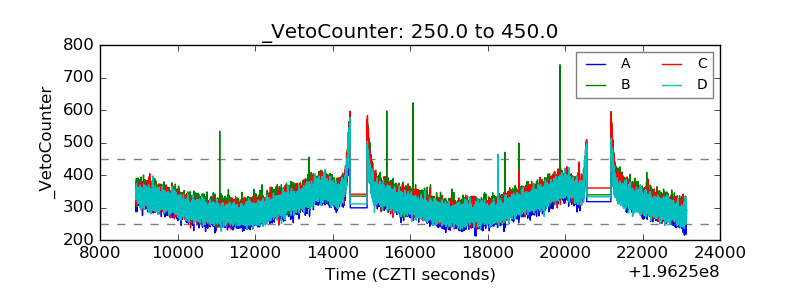 |